. 2017 Aug 29;7(1):9897.
doi: 10.1038/s41598-017-03693-x.

Model-Based Therapy Planning Allows Prediction of Haemodynamic Outcome after Aortic Valve Replacement

Collaborators, Affiliations

Model-Based Therapy Planning Allows Prediction of Haemodynamic Outcome after Aortic Valve Replacement

M Kelm et al. Sci Rep. .

Erratum in

Abstract

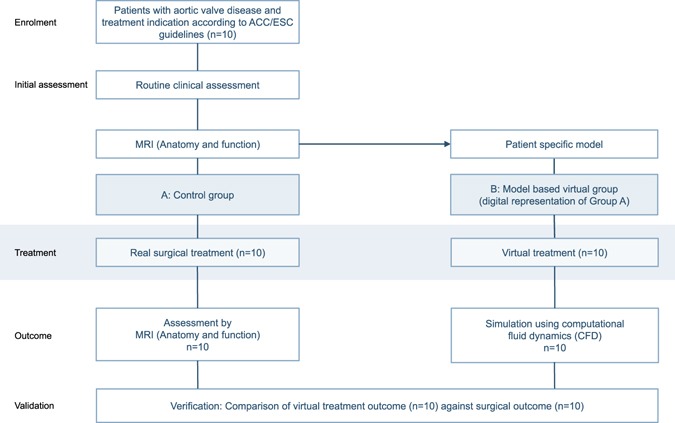
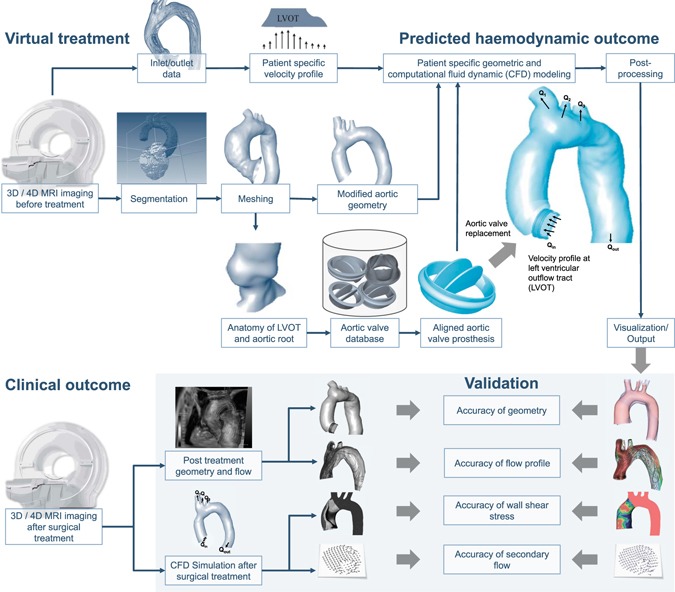
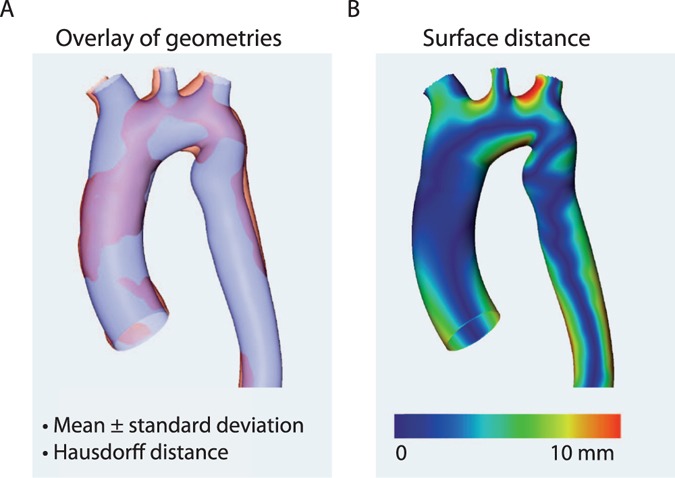
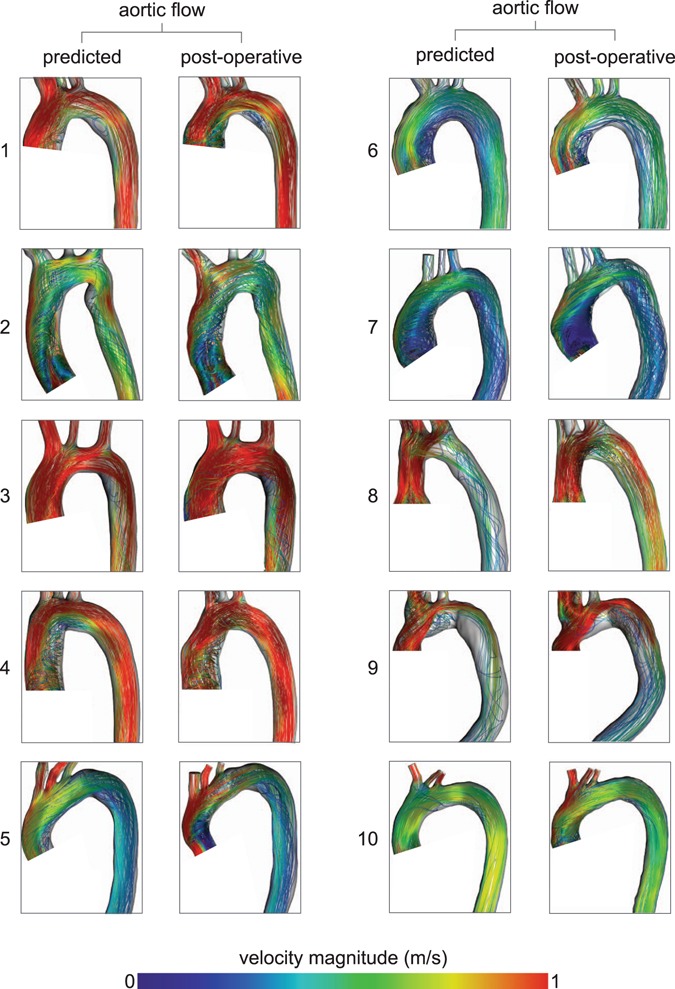
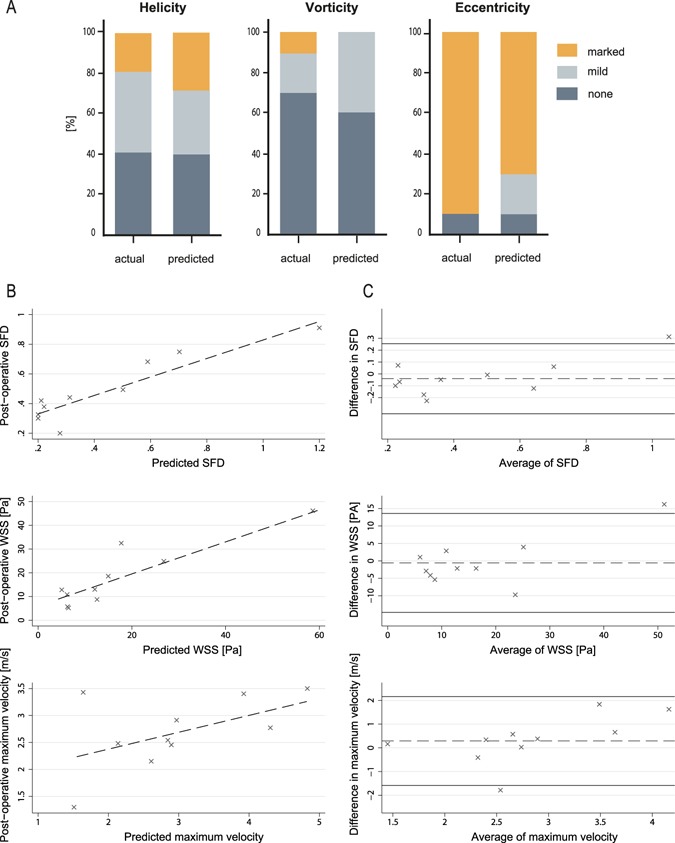
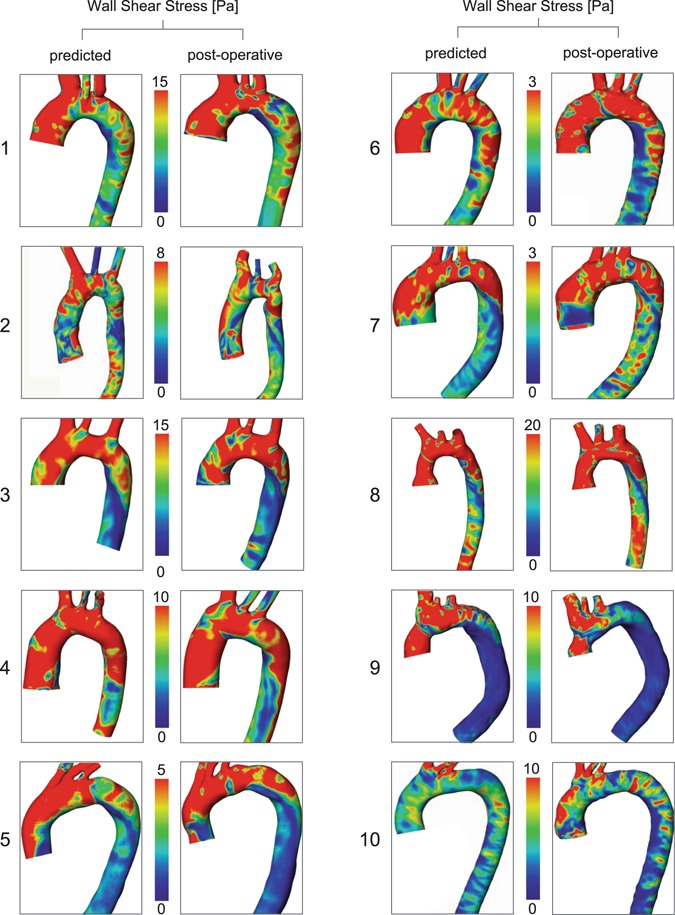
Optimizing treatment planning is essential for advances in patient care and outcomes. Precisely tailored therapy for each patient remains a yearned-for goal. Cardiovascular modelling has the potential to simulate and predict the functional response before the actual intervention is performed. The objective of this study was to proof the validity of model-based prediction of haemodynamic outcome after aortic valve replacement. In a prospective study design virtual (model-based) treatment of the valve and the surrounding vasculature were performed alongside the actual surgical procedure (control group). The resulting predictions of anatomic and haemodynamic outcome based on information from magnetic resonance imaging before the procedure were compared to post-operative imaging assessment of the surgical control group in ten patients. Predicted vs. post-operative peak velocities across the valve were comparable (2.97 ± 1.12 vs. 2.68 ± 0.67 m/s; p = 0.362). In wall shear stress (17.3 ± 12.3 Pa vs. 16.7 ± 16.84 Pa; p = 0.803) and secondary flow degree (0.44 ± 0.32 vs. 0.49 ± 0.23; p = 0.277) significant linear correlations (p < 0.001) were found between predicted and post-operative outcomes. Between groups blood flow patterns showed good agreement (helicity p = 0.852, vorticity p = 0.185, eccentricity p = 0.333). Model-based therapy planning is able to accurately predict post-operative haemodynamics after aortic valve replacement. These validated virtual treatment procedures open up promising opportunities for individually targeted interventions.


Conflict of interest statement

The authors declare that they have no competing interests.

Figures

Figure 1
Figure 1
Design of the virtual intervention study. In parallel to the surgical treatment (Group A, control group) a virtual intervention was performed in a digital representation of the patients (Group B). Individual models were built in all patients. The predicted outcome after a virtual procedure was reassessed by computational fluid dynamics (CFD) and compared to the surgical control.
Figure 2
Figure 2
Virtual aortic valve replacement and clinical validation. The virtual aortic valve replacement procedure is outlined (upper panel of the figure). After virtual treatment a patient-specific computational fluid dynamic (CFD) simulation is performed, resulting in a prediction of the haemodynamic outcome. In the clinical validation process (lower panel of the figure) this outcome is compared against the clinical outcome of the patient.
Figure 3
Figure 3
The comparison of aortic geometries (example). The accuracy of the vascular geometry is verified in order to ensure accurately set boundary conditions (A) The virtual anatomy is automatically overlaid with the actually resulting anatomy, providing mean differences between both measures and the Hausdorff distance. (B) shows the surfaces distance between geometries.
Figure 4
Figure 4
Visualization of flow patterns using CFD simulations based on post-operative imaging data (post-operative) and virtually treated preoperative imaging data (predicted).
Figure 5
Figure 5
Comparison between predicted and post-operative haemodynamic outcome. (A) Comparison of blood flow profiles (helicity, vorticity, eccentricity, secondary flow degree) between the model-based prediction (CFD) and the post-operative flow profiles (4D Flow MRI) after a surgical procedure are compared. (B) Linear regression plots of predicted and post-operative secondary flow degree, surface averaged wall shear stress and maximal flow velocity across the valve. (C) Bland-Altman plots of predicted and post-operative secondary flow degree, surface averaged wall shear stress and maximal flow velocity across the valve, plotted against the mean. The continuous horizontal lines illustrate mean −1.96 and +1.96 standard deviations.
Figure 6
Figure 6
Visualization of WSS distributions using CFD simulations based on post-operative imaging data (post-operative) and virtually treated preoperative imaging data (predicted).

Similar articles

Cited by

References

    1. Jaffe S. Planning for US Precision Medicine Initiative underway. Lancet. 2015;385:2448–2449. doi: 10.1016/S0140-6736(15)61124-2. - DOI - PubMed
    1. Hamburg MA, Collins FS. The path to personalized medicine. N Engl J Med. 2010;363:301–304. doi: 10.1056/NEJMp1006304. - DOI - PubMed
    1. Ashley EA. The precision medicine initiative: a new national effort. JAMA. 2015;313:2119–2120. doi: 10.1001/jama.2015.3595. - DOI - PubMed
    1. Bonow RO, Leon MB, Doshi D, Moat N. Management strategies and future challenges for aortic valve disease. Lancet. 2016;387:1312–1323. doi: 10.1016/S0140-6736(16)00586-9. - DOI - PubMed
    1. von Knobelsdorff-Brenkenhoff F, et al. Blood flow characteristics in the ascending aorta after aortic valve replacement–a pilot study using 4D-flow MRI. Int J Cardiol. 2014;170:426–433. doi: 10.1016/j.ijcard.2013.11.034. - DOI - PMC - PubMed

Publication types