. 2017 Aug 29;8(1):383.
doi: 10.1038/s41467-017-00405-x.

VEGF amplifies transcription through ETS1 acetylation to enable angiogenesis

Affiliations

VEGF amplifies transcription through ETS1 acetylation to enable angiogenesis

Jiahuan Chen et al. Nat Commun. .

Abstract

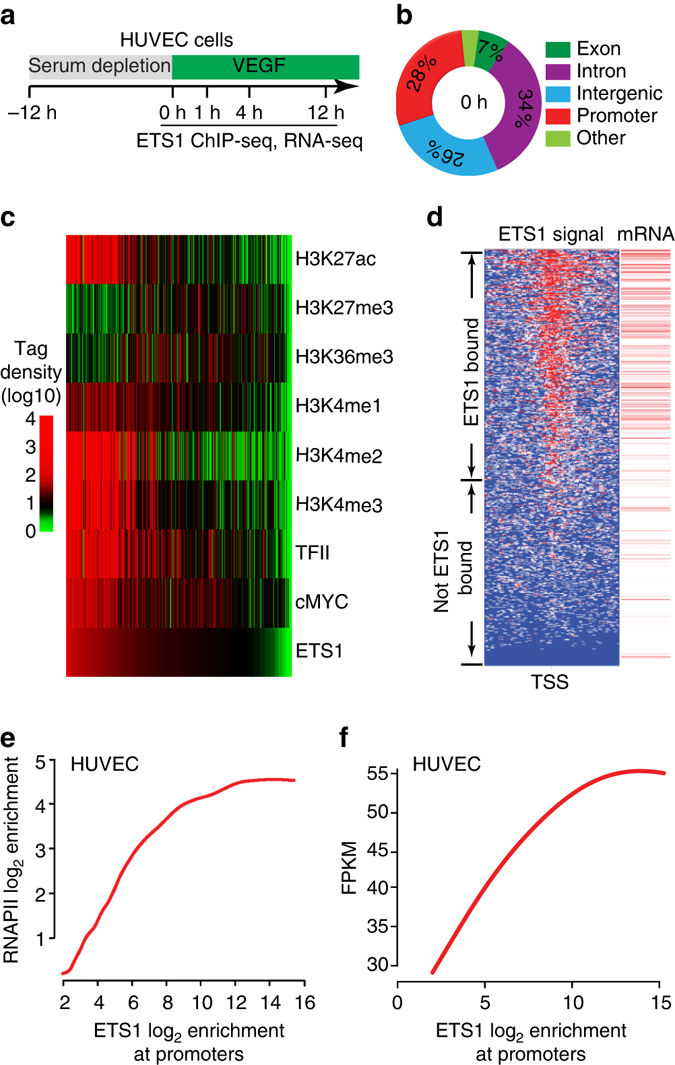
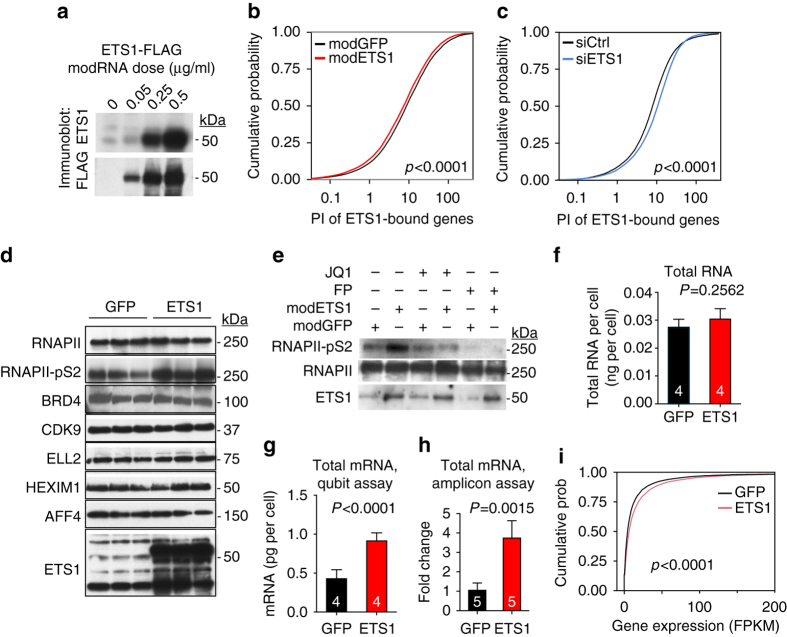
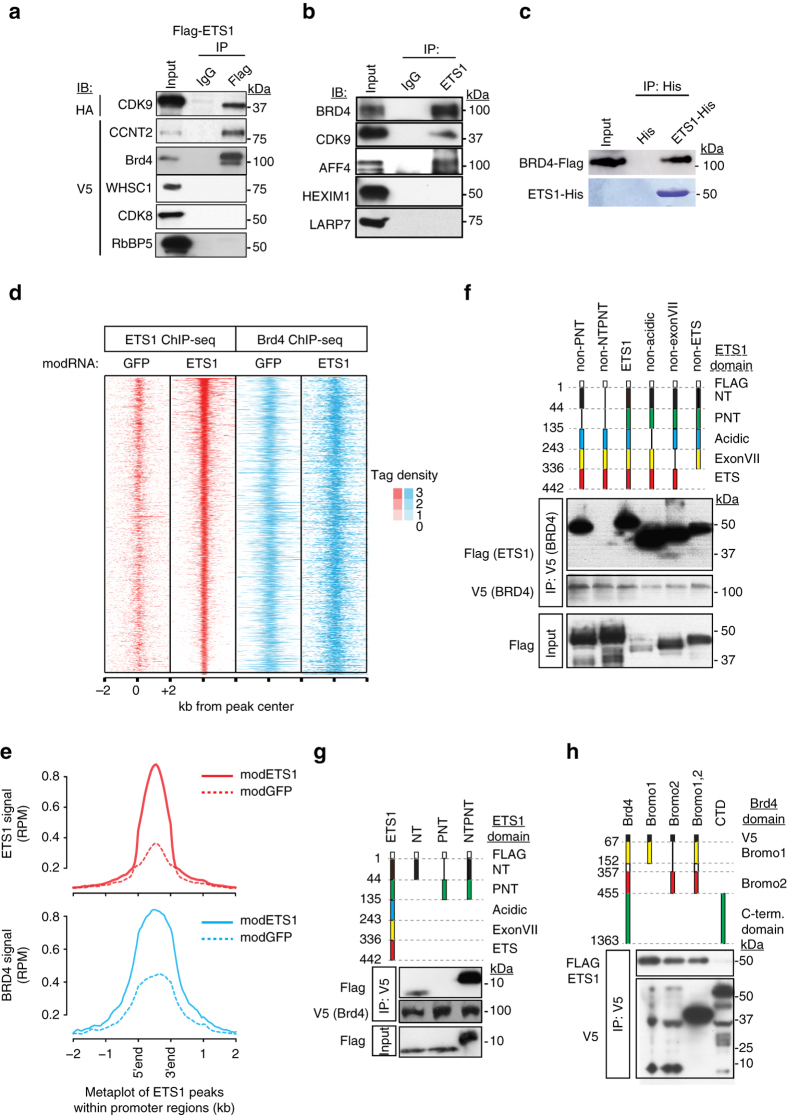
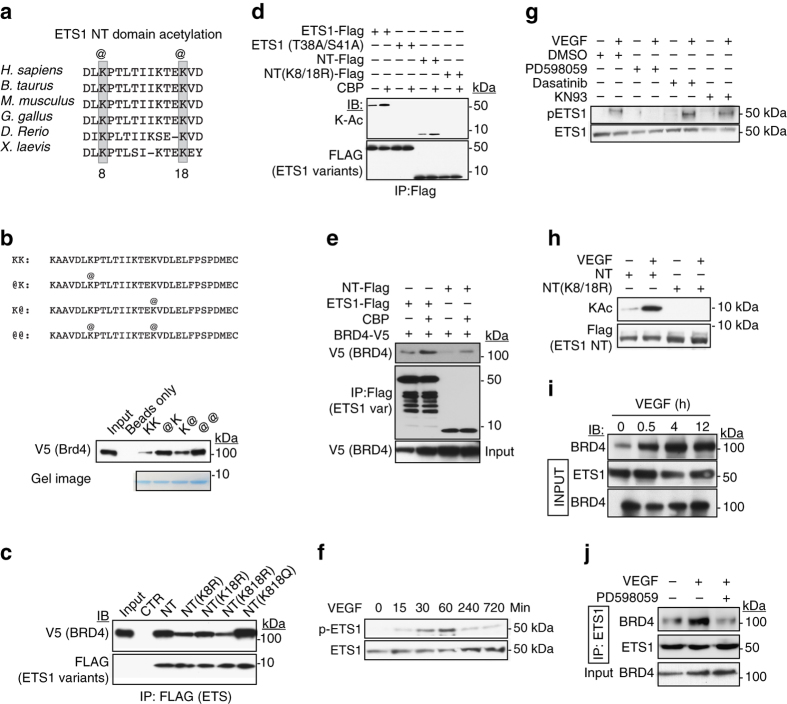
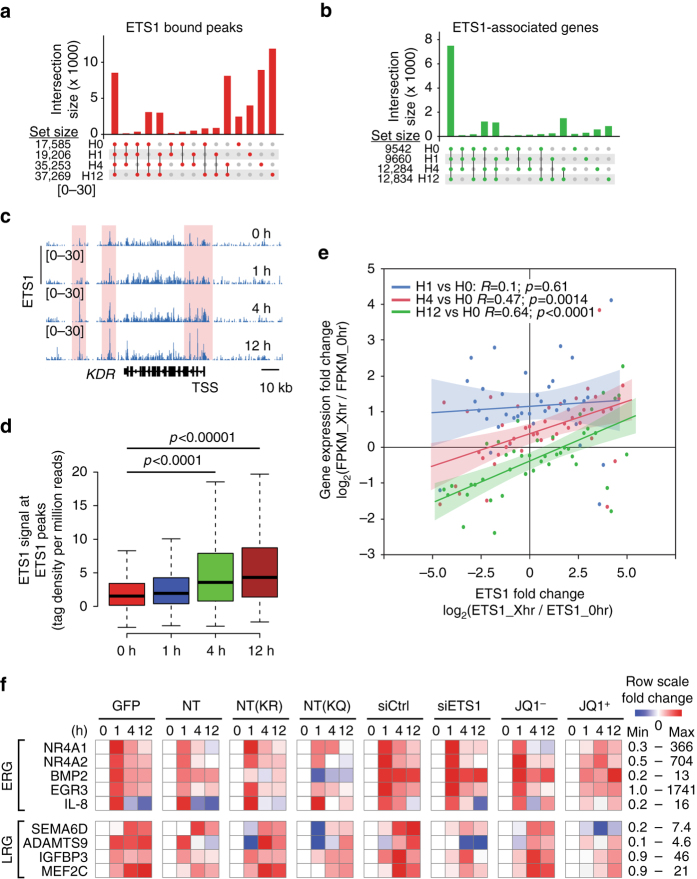
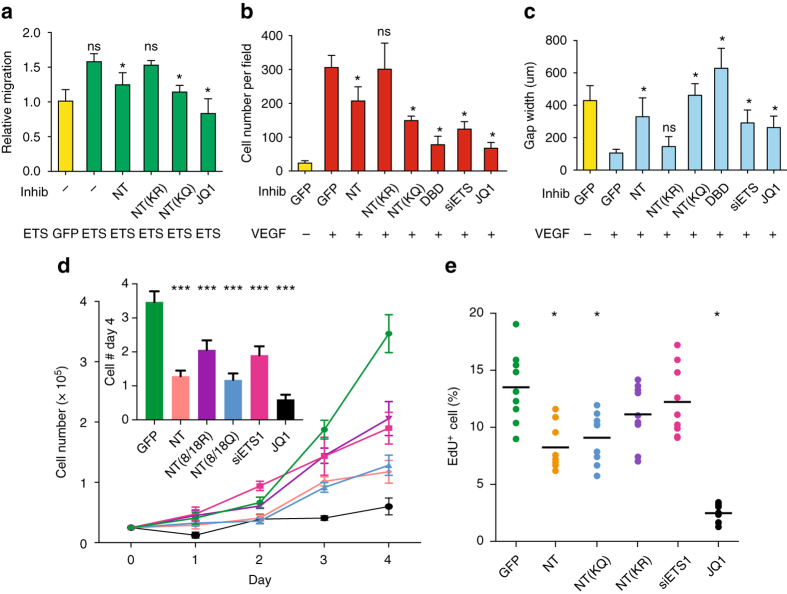
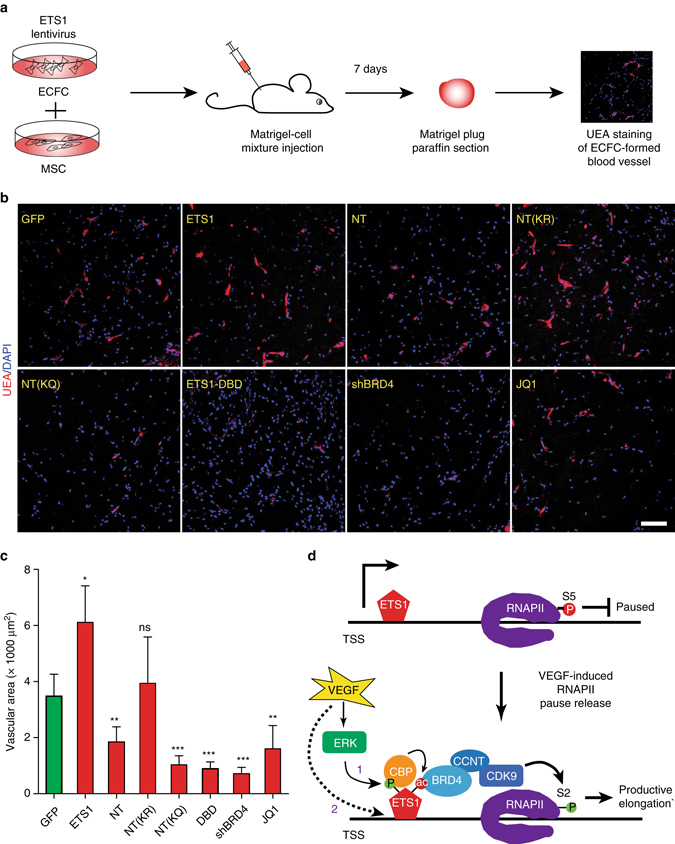
Release of promoter-proximally paused RNA polymerase II (RNAPII) is a recently recognized transcriptional regulatory checkpoint. The biological roles of RNAPII pause release and the mechanisms by which extracellular signals control it are incompletely understood. Here we show that VEGF stimulates RNAPII pause release by stimulating acetylation of ETS1, a master endothelial cell transcriptional regulator. In endothelial cells, ETS1 binds transcribed gene promoters and stimulates their expression by broadly increasing RNAPII pause release. 34 VEGF enhances ETS1 chromatin occupancy and increases ETS1 acetylation, enhancing its binding to BRD4, which recruits the pause release machinery and increases RNAPII pause release. Endothelial cell angiogenic responses in vitro and in vivo require ETS1-mediated transduction of VEGF signaling to release paused RNAPII. Our results define an angiogenic pathway in which VEGF enhances ETS1-BRD4 interaction to broadly promote RNAPII pause release and drive angiogenesis.Promoter proximal RNAPII pausing is a rate-limiting transcriptional mechanism. Chen et al. show that this process is essential in angiogenesis by demonstrating that the endothelial master transcription factor ETS1 promotes global RNAPII pause release, and that this process is governed by VEGF.


Conflict of interest statement

The authors declare no competing financial interests.

Figures

Fig. 1
Fig. 1
ETS1 promoter occupancy and gene expression. ETS1 occupied promoters of most expressed genes, and its promoter occupancy correlated with gene expression. a Overview of the experimental design used for in vitro studies. Samples were collected prior to stimulation (0 h) and at 1, 4, and 12 h of VEGF stimulation. b ETS1 chromatin occupancy at 0 h with respect to genome annotations. c Heatmap of indicated chromatin features at promoter regions at the 0 h time point. Regions are ordered by ETS1 binding strength at 0 h after VEGF stimulation. Features positively correlated with gene expression correlated with ETS1 binding strength. d ETS1 signal at TSS region and associated gene expression at the 0 h time point. ETS1 bound most expressed genes. Left panel (ETS1 signal): tag heatmap with high ChiP-seq signal shown in red. Right panel (mRNA): red lines indicate expressed genes, as determined by RNA-seq. e Correlation plot of promoter ETS1 and RNAPII occupancy at the 0 h time point. f Correlation plot of promoter ETS1 occupancy and RNA-seq gene expression at the 0 h time point
Fig. 2
Fig. 2
ETS1 stimulated RNAPII pause release. a Immunoblot of ETS1 expression in HUVEC cells 12 h after transfection by the indicated dose of ETS1 modRNA. b ETS1 overexpression reduced RNAPII pausing at ETS1-bound promoters. HUVEC cells were treated with ETS1 or GFP modRNA. Pausing index (PI) of ETS1-bound genes, a measure of a gene’s RNAPII paused at its promoter, was calculated from RNAPII ChIP-seq performed 12 h after transfection. ETS1 shifted the distribution of ETS1-bound genes to lower PI in treatment compared to control. c ETS1 knockdown increased RNAPII pausing at ETS1-bound promoters. Experiment as in b, except that cells were treated with control or ETS1 siRNAs. d ETS1 overexpression using modRNA increased actively elongating RNAPII (RNAPII-pS2) but not total RNAPII. HUVEC cells treated with GFP or ETS1 modRNA were analyzed by immunoblot at 12 h. e ETS1 overexpression increased actively elongating RNAPII through BRD4 and P-TEFb. ETS1 modRNA-induced increase of RNAPII-pS2 was blocked by BRD4 inhibitor JQ1 or P-TEFb inhibitor flavopiridole (FP). fi ETS1 overexpression broadly increased mRNA expression. Total RNA f or mRNA g content per cell were measured by Qubit assay. Alternatively, mRNA was converted to RNA-seq libraries, using external spike-in RNA for normalization to cell number. Relative RNA-seq library yield per cell was measured by quantitative RTPCR. Cumulative distribution plot of RNA abundance per cell. Cumulative distribution plot of gene expression i showed that that ETS1 modRNA broadly increased gene expression. P-values were calculated by Student’s t-test (fh) or by Kolmogorov–Smirnov test b, c, i. Bar graphs show mean ± s.d
Fig. 3
Fig. 3
ETS1 recruited P-TEFb to chromatin by direct interaction with BRD4. a ETS1 co-precipitated P-TEFb and BRD4. 293T cells were co-transfected with indicated expression constructs. ETS1 was immunoprecipitated (FLAG), and interacting proteins were detected with HA or V5 antibodies. b ETS1 interacted with active P-TEFb in HUVEC cells. Endogenous ETS1 was immunoprecipitated, and endogenous interacting proteins were detected using specific antibodies. c Bacterially expressed, affinity purified ETS1-His bound in vitro transcribed and translated BRD4. d ETS1 and BRD4 promoter co-occupancy. HUVEC cells were transfected with ETS1 or GFP modRNA, and ETS1 and BRD4 chromatin occupancy was measured by ChIP-seq. The tag heatmap displays ETS1 and BRD4 signals from ETS1 regions within promoters. ETS1 and BRD4 co-occupied promoters, and increased ETS1 occupancy correlated with increased BRD4 occupancy. e Aggregation plots of ETS1 and BRD4 signals shown in d. f, g BRD4 binds the ETS1 NT domain. FLAG-tagged ETS1 expression constructs containing the indicated domains were co-transfected into 293T cells with V5-tagged BRD4. ETS1 deletion mutants were detected in BRD4 (V5) immunoprecipitates by FLAG immunoblotting. The NT domain was required for BRD4 binding. h BRD4 Bromo domains bind ETS1. V5-tagged expression constructs containing the indicated BRD4 domains were co-transfected into 293T cells with FLAG-tagged ETS1. BRD4 (V5) immunoprecipitates were probed for interacting ETS1 protein by FLAG immunoblotting. Either bromodomain of BRD4 was sufficient for ETS1 interaction
Fig. 4
Fig. 4
VEGF increased ETS1 acetylation and interaction with BRD4. a ClustalW alignment of a region within the ETS1 NT domain. K8 and K18 were major sites of acetylation, as determined by mass spectrometry. b ETS1 NT acetylation enhances BRD4 binding. Peptides corresponding to the N-terminus of ETS1 were synthesized with either lysine or acetyl-lysine (@) at positions 8 and 18. Immobilized peptides were incubated with V5-BRD4-containing cell lysates. K8 or K18 acetylation enhanced BRD4 binding. c ETS1–BRD4 interaction is modulated by K8 and K18 acetylation. The ETS1 NT domain was expressed with mutations that abrogate (R) or mimic (Q) lysine acetylation. Interaction with co-transfected V5-BRD4 was assessed by co-immunoprecipitation. d CBP acetylates ETS1 at K8 and K18. ETS1 acetylation was assessed by immunoprecipitation followed by immunoblotting with acetyl-lysine specific antibody. ETS1 acetylation required K8 and K18, and ERK phosphorylation sites T38 and S41. e CBP stimulates BRD4 binding to ETS1 NT domain. Expression constructs were co-transfected into 293T cells. BRD4 co-precipitated by ETS1 was detected by immunoblotting. CBP stimulated ETS1–BRD4 interaction. f VEGF stimulates ETS1 phosphorylation. HUVEC cells were treated with 50 ng ml−1 VEGF for the indicated time. ETS1 T38 phosphorylation (p-ETS1) was detected using specific antibody. g ERK is required to phosphorylate ETS1 downstream of VEGF. ERK pathway inhibitor PD598059 blocked ETS1 phosphorylation in HUVECs stimulated by VEGF, but inhibitors of other ETS1 kinases (KN93 or Dasatinib) did not. h VEGF induced ETS1 NT acetylation at K8 and K18. In HUVEC cells, VEGF treatment induced robust acetylation of the ETS1 NT domain, but this was abolished by K8;18R mutation. i VEGF-induced ETS1–BRD4 interaction. ETS1 was immunoprecipitated from HUVEC cells treated with VEGF for the indicated time. Co-precipitated BRD4 was measured by immunoblotting. j VEGF-induced ETS1–BRD4 interaction requires ERK activity. Co-immunoprecipitation assay as in i was performed with or without ERK inhibitor PD598059
Fig. 5
Fig. 5
ETS1 amplified VEGF downstream transcription. a, b UpSet plots showing the overlap of ETS1-bound peaks (a) or ETS1-associated genes (b) between the four time points (0, 1, 4, 12 h). The bar represents the number of peaks shared by the time points indicated by the colored dots and not by the time points indicated by the gray dots. Most ETS1 peaks were not shared between time points, but most ETS1-associated genes were shared. c VEGF stimulated ETS1 chromatin occupancy. Genome browser view of ETS1 occupancy at the KDR locus at the indicated times of VEGF stimulation. Pink highlights regions with greater VEGF occupancy over the time course. d Genome-wide gain of ETS1 signal at ETS1-bound regions during VEGF stimulation time course. ETS1 binding increased genome-wide at 4 and 12 h. Mann–Whitney U-test. Dark line and boxes represent the median and 25th and 75th percentiles. The whiskers represent median ± 1.5 times the interquartile range. e. VEGF-induced changes in gene expression correlated to changes in ETS1 promoter occupancy. Analysis was limited to expressed genes with ETS1 promoter occupancy. Expression and ETS1 signal at the indicated time point of VEGF treatment are expressed as fold change compared to hour 0. Each point was calculated by grouping genes with similar ETS1 occupancy change. Correlation and p-values were plotted using a linear regression model. f VEGF-induced gene activation requires ETS1–BRD4 interaction. HUVEC cells were transduced with lentivirus expressing the indicated proteins, transfected with siRNA, or treated with small molecule JQ1. Gene expression after the indicated number of hours of VEGF stimulation was measured by qRT-PCR and displayed as a heat map. Log10 fold-change compared to time 0 was row scaled. Linear minimum and maximum fold-change values for each row are listed on the right
Fig. 6
Fig. 6
ETS1–BRD4 interaction is required for VEGF-driven angiogenic responses in vitro. a ETS1-driven EC migration was inhibited by interfering with BRD4-mediated RNAPII pause release or ETS1–BRD4 interaction. HUVEC cells were transduced with the indicated lentivirus, or treated with JQ1, and migration was measured using a trans-well assay. ETS1 stimulated migration, and this was attenuated by peptides that block ETS1–BRD4 interaction or by JQ1 inhibition of BRD4. b VEGF-driven EC migration was inhibited by interfering with BRD4-mediated RNAPII pause release or ETS-BRD4 interaction. Trans well assay was performed as in a. VEGF was used at 30 ng ml−1. Student’s t test vs. VEGF-stimulated cells without inhibitor: *p < 0.05. ns: not significant, n = 4. Bar = 250 µm. c VEGF-driven wound healing of HUVEC monolayer was inhibited by interfering with BRD4-mediated RNAPII pause release or ETS1–BRD4 interaction. The width of the scratch at the end of the culture period is inversely related to EC migration capacity. Student’s t-test vs. VEGF-treated cells without inhibitor: *p < 0.05. n = 3. ns, not significant. d, e HUVEC proliferation requires ETS1–BRD4 interaction and BRD4 activity. HUVECs were transduced with lentivirus expressing the indicated proteins, transfected with siRNA, or treated with JQ1. Cells were cultured in EGM2 growth medium. Cell number was counted daily c, or traversal of S phase was measured by culturing cells in the nucleotide analog EdU (e). Cell counts at day 4 are plotted in the inset in c. Bar graphs show mean ± s.d. Intergroup comparisons were made with Student’s t-test vs. baseline (yellow, ac; green, d, e): *p < 0.05; ***p < 0.001; ns, not significant. For each experiment, n = 4
Fig. 7
Fig. 7
ETS1–P-TEFb modulated in vitro angiogenesis. a Experimental design for the matrigel plug assay. ECFCs were transduced with lentivirus expressing indicated proteins or shRNA. Alternatively, ECFCs were cultured in JQ1 overnight, prior to matrigel implantation. Cells were then mixed with MSCs in matrigel, and injected subcutaneously into mice. b Matrigel plugs were sectioned and stained with fluorescently labeled UEA, which binds human ECs. Representative confocal images are shown. Bar = 100 µm. c Inhibition of ETS1 activity, BRD4 activity, or ETS1–BRD4 interaction impaired vessel formation in the matrigel plug assay. UEA-stained vascular area in matrigel plugs was quantified. Student’s t-test compared to GFP control: *p < 0.05; **p < 0.01; ***p < 0.001. n = 3–5. Bar plots show mean ± s.d. d Working model of ETS1-mediated transcriptional response to VEGF. VEGF activates ERK, which phosphorylates ETS1 (1). This recruits CBP to ETS1. CBP acetylates ETS1 at K8,18 in the NT domain, stimulating BRD4 binding and activation of P-TEFb. P-TEFb phosphorylates serine 2 within the C-terminal domain of RNAPII and releases RNAPII pausing, resulting in productive elongation. VEGF also stimulates ETS1 chromatin occupancy (2), enhancing its effect on both RNAPII initiation and pause release

Similar articles

Cited by

References

    1. Yang S. Vascular endothelial growth factor-induced genes in human umbilical vein endothelial cells: relative roles of KDR and Flt-1 receptors. Arterioscler. Thromb. Vasc. Biol. 2002;22:1797–1803. doi: 10.1161/01.ATV.0000038995.31179.24. - DOI - PubMed
    1. Liu D, Jia H, Holmes DI, Stannard A, Zachary I. Vascular endothelial growth factor-regulated gene expression in endothelial cells: KDR-mediated induction of Egr3 and the related nuclear receptors Nur77, Nurr1, and Nor1. Arterioscler. Thromb. Vasc. Biol. 2003;23:2002–2007. doi: 10.1161/01.ATV.0000098644.03153.6F. - DOI - PubMed
    1. Zhang B, Day DS, Ho JW, Song L, et al. A dynamic H3K27ac signature identifies VEGFA-stimulated endothelial enhancers and requires EP300 activity. Genome Res. 2013;23:917–927. doi: 10.1101/gr.149674.112. - DOI - PMC - PubMed
    1. Oda N, Abe M, Sato Y. ETS-1 converts endothelial cells to the angiogenic phenotype by inducing the expression of matrix metalloproteinases and integrin beta3. J. Cell. Physiol. 1999;178:121–132. doi: 10.1002/(SICI)1097-4652(199902)178:2<121::AID-JCP1>3.0.CO;2-F. - DOI - PubMed
    1. Wei G, Srinivasan R, Cantemir-Stone CZ, Sharma SM, et al. Ets1 and Ets2 are required for endothelial cell survival during embryonic angiogenesis. Blood. 2009;114:1123–1130. doi: 10.1182/blood-2009-03-211391. - DOI - PMC - PubMed

Publication types

MeSH terms