. 2017 Aug 29;7(1):9600.
doi: 10.1038/s41598-017-08821-1.

Prion protein facilitates retinal iron uptake and is cleaved at the β-site: Implications for retinal iron homeostasis in prion disorders

Affiliations

Prion protein facilitates retinal iron uptake and is cleaved at the β-site: Implications for retinal iron homeostasis in prion disorders

Abhishek Asthana et al. Sci Rep. .

Abstract

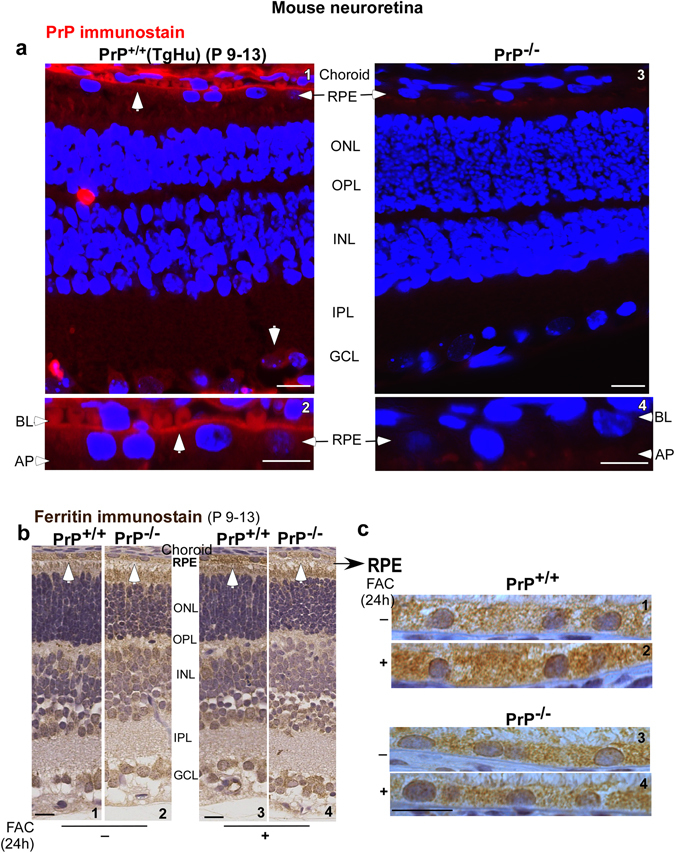
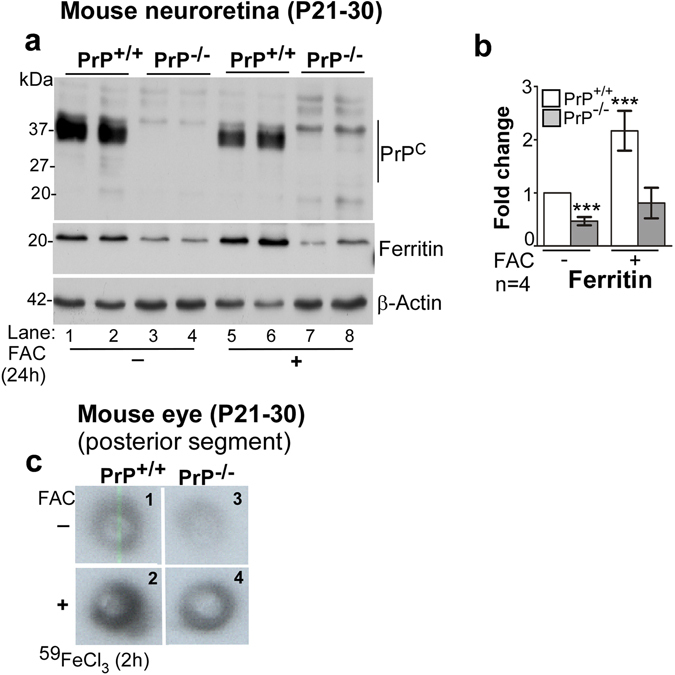
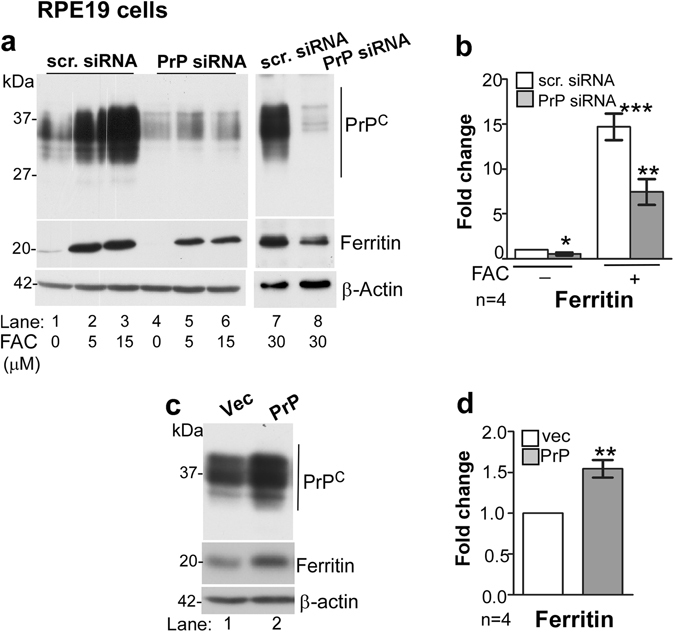
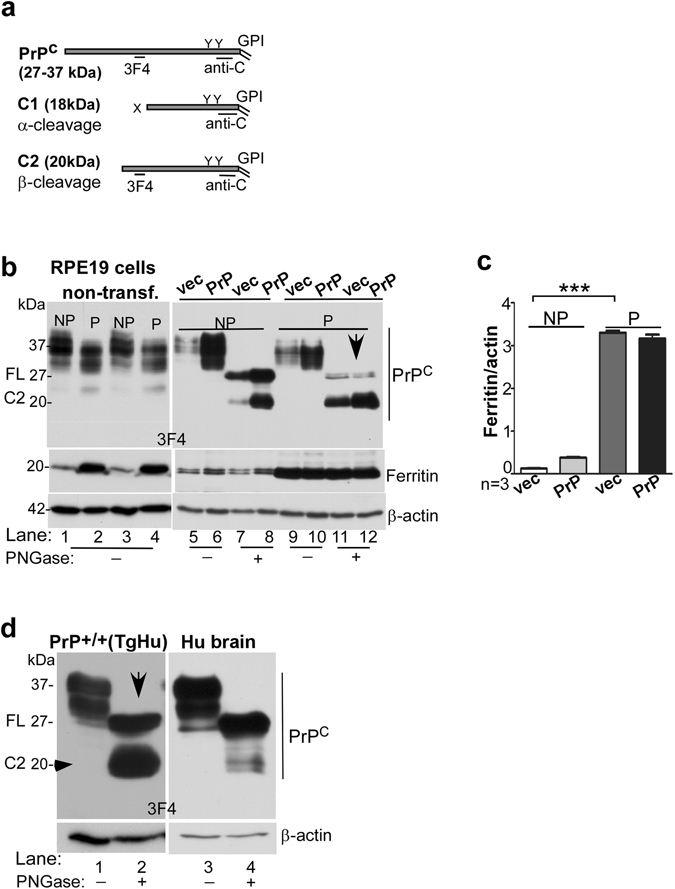
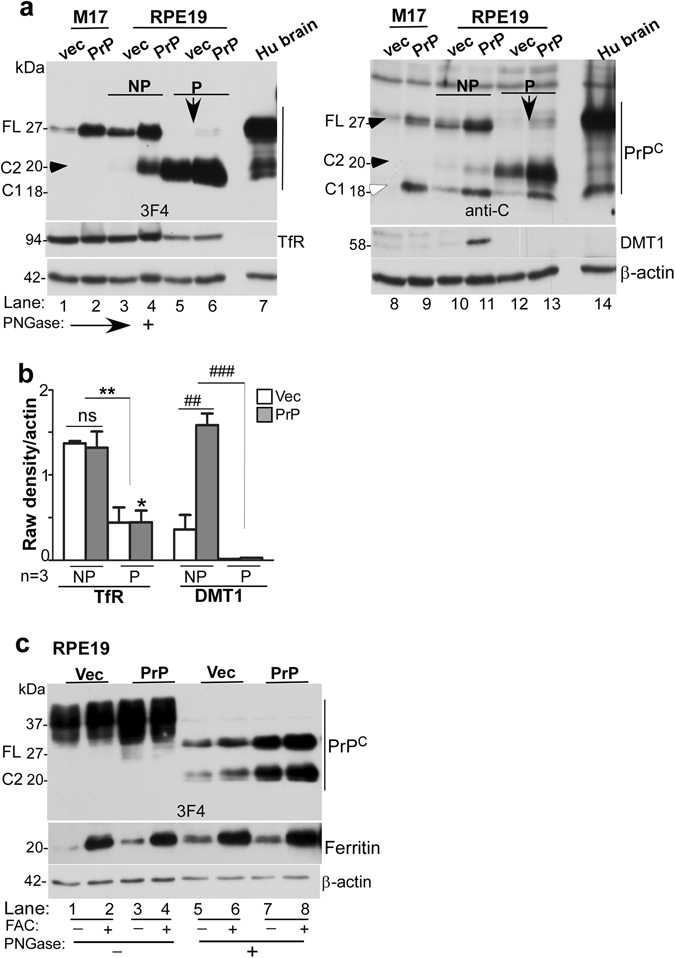
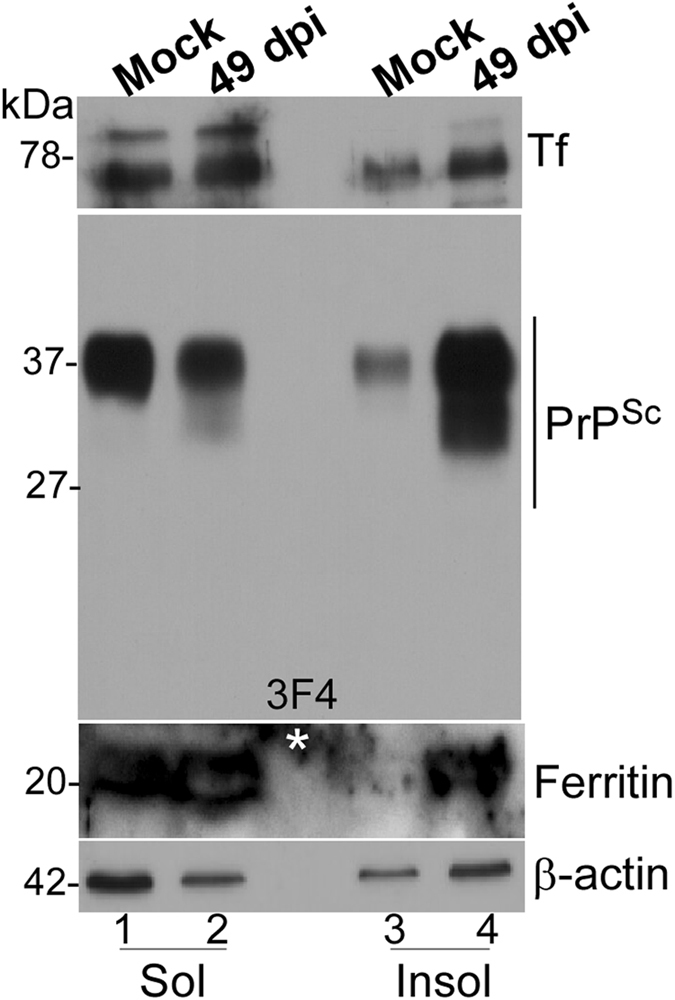
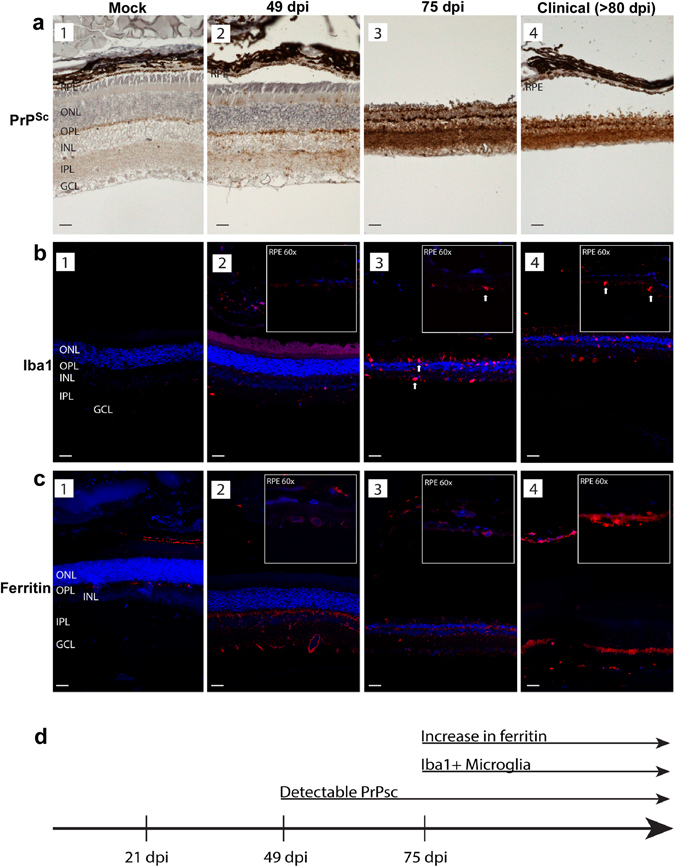
Prion disease-associated retinal degeneration is attributed to PrP-scrapie (PrPSc), a misfolded isoform of prion protein (PrPC) that accumulates in the neuroretina. However, a lack of temporal and spatial correlation between PrPSc and cytotoxicity suggests the contribution of host factors. We report retinal iron dyshomeostasis as one such factor. PrPC is expressed on the basolateral membrane of retinal-pigment-epithelial (RPE) cells, where it mediates uptake of iron by the neuroretina. Accordingly, the neuroretina of PrP-knock-out mice is iron-deficient. In RPE19 cells, silencing of PrPC decreases ferritin while over-expression upregulates ferritin and divalent-metal-transporter-1 (DMT-1), indicating PrPC-mediated iron uptake through DMT-1. Polarization of RPE19 cells results in upregulation of ferritin by ~10-fold and β-cleavage of PrPC, the latter likely to block further uptake of iron due to cleavage of the ferrireductase domain. A similar β-cleavage of PrPC is observed in mouse retinal lysates. Scrapie infection causes PrPSc accumulation and microglial activation, and surprisingly, upregulation of transferrin despite increased levels of ferritin. Notably, detergent-insoluble ferritin accumulates in RPE cells and correlates temporally with microglial activation, not PrPSc accumulation, suggesting that impaired uptake of iron by PrPSc combined with inflammation results in retinal iron-dyshomeostasis, a potentially toxic host response contributing to prion disease-associated pathology.


Conflict of interest statement

The authors declare that they have no competing interests.

Figures

Figure 1
Figure 1
Distribution of PrPC and ferritin in the neuroretina of PrP+/+ and PrP−/− mice. (a) Immunoreaction of retinal sections from 9–13 day old PrP+/+ (TgHu) mice with 3F4 revealed a strong reaction for PrPC on the BL membrane of RPE cells in addition to its reported expression on ganglion cells (panels 1 & 2). No reaction was detected in PrP−/− samples processed in parallel (panels 3 & 4). (b) Immunoreaction for ferritin shows stronger reactivity in the RPE cell layer of PrP+/+ relative to PrP−/− sample (panel 1 vs. 2). Systemic iron overload upregulates ferritin mainly in the RPE cell layer of PrP+/+ samples, not in PrP−/− samples (panel 3 vs. 4 & 2 vs.4). (c) Higher magnification images of the RPE cell layer show a prominent increase in intracellular ferritin in PrP+/+ samples following systemic iron overload (panel 1 vs. 2). PrP−/− samples show minimal change (panel 3 vs. 4). RPE: retinal pigment epithelium; ONL: outer nuclear layer; OPL: outer plexiform layer; INL: inner nuclear layer; IPL: inner plexiform layer; GCL: ganglion cell layer: BL: basolateral; AP: apical. Scale bar 20 μm.
Figure 2
Figure 2
The neuroretina of PrP−/− mice is iron deficient. (a) Probing of pooled retinal lysates for PrPC with anti-C (8H4) shows the expected full-length glycoforms of PrPC in PrP+/+ samples (lanes 1 & 2), and no signal in PrP−/− samples as expected (lanes 3 & 4). Re-probing for ferritin shows significantly more signal in PrP+/+ relative to PrP−/− samples (lanes 1 & 2 vs. 3 & 4; b). A similar analysis of neuroretinal samples from iron-overloaded mice shows significant upregulation of ferritin in PrP+/+ samples (lanes 1 & 2 vs. 5 & 6; b), and minimal change in PrP−/− samples (lanes 3 & 4 vs. 7 & 8; b). (b) Densitometric analysis of protein bands after normalization with β-actin shows 0.5 fold less ferritin in PrP−/− relative to PrP+/+ samples. Systemic iron overload causes 2-fold upregulation of ferritin in PrP+/+ samples, but minimal change in PrP−/− samples. Values are mean ± SEM of the indicated n. ***p < 0.001. (c) Fluorograph of the posterior segment of eye shows less uptake of 59Fe in PrP−/− relative to PrP+/+ samples (panel 1 vs. 3). Systemic iron overload increases 59Fe uptake in both PrP+/+ and PrP−/− samples (panels 1 & 3 vs. 2 & 4), but the increase is less in PrP−/− relative to PrP+/+ controls (panel 2 vs. 4).
Figure 3
Figure 3
PrPC influences ferritin levels in RPE19 cells. (a) Down-regulation of PrPC with siRNA reduces ferritin expression in untreated (lanes 1 vs. 4) and FAC treated cells (lanes 2 & 3 vs. 5 & 6; lane 7 vs. 8) (b) Densitometric analysis of protein bands after normalization with β-actin shows 0.5-fold reduction in ferritin after down-regulation of PrPC. Exposure to FAC upregulates ferritin by ~14-fold in controls, but only 6–7 fold in cells where PrPC is downregulated. (c and d) Over-expression of PrPC results in upregulation of ferritin by 1.5 fold (lane 1 vs. 2; d). β-actin served as a loading control. Values are mean ± SEM of the indicated n. *p < 0.05, **p < 0.01, ***p < 0.001.
Figure 4
Figure 4
Polarization of RPE cells results in upregulation of ferritin and β-cleavage of PrPC. (a) Schematic representation of full length (FL), α-cleaved (C1), and β-cleaved (C2) forms of PrPC and antibody reactivity against 3F4 and anti-C (8H4) epitopes. (b) Probing of lysates from non-transfected and PrPC expressing RPE19 cells with 3F4 shows cleavage of PrPC at the β-site following polarization, resulting in the generation of C2 (lanes 1 & 3 vs. 2 & 4). The change in the ratio of full-length (FL) vs. β-cleaved (C2) form of PrPC is more obvious in deglycosylated samples (lanes 5–8 vs. 9–12). Re-probing for ferritin shows upregulation in PrPC-expressing cells relative to vector controls (lanes 5 & 7 vs. 6 & 8), and a dramatic increase in both cell lines following polarization (lanes 1 & 3 vs. 2 & 4, lanes 5–8 vs. 9–12). NP: non-polarized; P: polarized. (c) Densitometric analysis of protein bands following normalization with β-actin shows ~10 fold increase in ferritin following polarization in both vector and PrPC-expressing cells. Values are mean ± SEM of the indicated n. ***p < 0.001. (d) Probing of neuroretinal lysates from PrP+/+ (TgHu) mice and human brain for PrPC shows β-cleavage of ~70% of PrPC in the neuroretina relative to ~10% in brain samples.
Figure 5
Figure 5
β-cleavage of PrPC modulates intracellular iron and is unique to polarized RPE cells. (a) Deglycosylated lysates from vector and PrPC-expressing M17 and RPE cells and human brain were probed with PrP-specific antibodies 3F4 and anti-C to estimate the relative abundance of full-length (FL), α-cleaved (C1), and β-cleaved (C2) forms in each sample. Probing with 3F4 that reacts with FL and C2 (Fig. 4a) reveals undetectable levels of C2 in M17 cells even after over-expressing PrPC (lanes 1 & 2). RPE cells, on the other hand, show significantly more C2 in non-polarized cells (lanes 3 & 4), and almost complete cleavage of FL to the C2 form following polarization (lanes 5 & 6). The brain sample shows minimal levels of C2 as in M17 cells (lane 7). Probing with anti-C antibody that reacts with FL, C1, and C2 (Fig. 4a) shows FL and C1 in M17 and brain lysates (lanes 8, 9, 14), and mainly C2 in RPE samples (lanes 10–13). Re-probing for TfR shows down-regulation following polarization of RPE cells (lanes 3 & 4 vs. 5 & 6). Re-probing for DMT-1, on the other hand, shows up-regulation in PrPC-expressing non-polarized RPE cells (lanes 10 & 11), and down-regulation following polarization (lanes 10 & 11 vs. 12 & 13). (b) Densitometric analysis of protein bands after normalization with β-actin shows downregulation of TfR following polarization of RPE cells to less than half, and upregulation of DMT-1 in PrPC-expressing non-polarized cells by ~3-fold. DMT-1 expression is minimal in polarized RPE cells. Values are mean ± SEM of the indicated n. ns, not significant, *p < 0.05, **p < 0.01, ##p < 0.01, ###p < 0.001. (c) Exposure of non-polarized RPE cells to FAC increases the ratio of C2 vs. FL that is more evident following deglycosylation (lanes 5 & 7 vs. 6 & 8; d). Re-probing for ferritin shows a significant increase following FAC treatment as expected (lanes 2, 4, 6, 8).
Figure 6
Figure 6
Scrapie infected hamsters show retinal iron imbalance. Neuroretinal lysates from mock and scrapie-infected hamsters were subjected to differential centrifugation to separate detergent-soluble and insoluble proteins, and processed for Western blotting. Probing for PrP reveals partitioning of most of the PrPC from mock infected samples in the detergent-soluble phase (lanes 1 & 3), while the majority of PrPSc from infected samples partitions in the detergent-insoluble phase (lanes 2 & 4). Re-probing for Tf shows up-regulation in scrapie-infected samples, most of which partitions in the detergent-soluble phase (lanes 1–4). Re-probing for ferritin shows significant up-regulation in scrapie-infected samples, and partitioning of a significant amount in the detergent-insoluble phase (lanes 1–4; *non-specific reaction).
Figure 7
Figure 7
Distribution of PrPSc, Iba1, and ferritin in hamster retinas. (a) Immunoreaction for PrPSc shows no reactivity in mock-treated control retinas (panel 1). PrPSc deposits are first evident at 49 dpi, and are localized to outer segments of photoreceptor cells, OPL, INL, IPL, and GCL (panel 2). Robust PrPSc deposits are seen throughout the retina at 75 dpi and in clinical samples (panels 3 & 4). (b) Immunoreaction for Iba1 shows minimal reactivity in RPE, OPL, and IPL in mock treated samples (panel 1). Prominent reactivity for Iba1 is first seen at 49 dpi (panel 2). Amoeboid microglia are evident throughout the retina, including the RPE cell layer in scrapie-infected samples (panels 3 & 4). Arrows indicating large cell bodies of activated, Iba1 + microglia at later time points (panels 3 & 4). (c) Immunoreaction for ferritin shows minimal reaction in mock-treated samples (panel 1). Increased perinuclear and cytoplasmic immunoreactivity for ferritin is first evident at 49dpi, and is localized to RPE, OPL, INL, IPL, and GCL (panels 2–4). High magnification (60X) inserts in the upper right hand corner show Iba1 and ferritin immunoreactivity in the RPE cell layer in scrapie-infected samples. Abbreviations: GCL: ganglion cell layer; IPL: inner plexiform layer; INL: inner nuclear layer; OPL: outer plexiform layer; ONL: outer nuclear layer; RPE: Retinal pigment epithelium. Scale bars: 10 μm. (d) The increase in ferritin reactivity occurs subsequent to PrPSc accumulation, and coincides with Iba1 reactivity.

Similar articles

Cited by

References

    1. Aguzzi A, Sigurdson C, Heikenwaelder M. Molecular mechanisms of prion pathogenesis. Annu Rev Pathol. 2008;3:11–40. doi: 10.1146/annurev.pathmechdis.3.121806.154326. - DOI - PubMed
    1. Aguzzi A, Nuvolone M, Zhu C. The immunobiology of prion diseases. Nat Rev Immunol. 2013;13:888–902. doi: 10.1038/nri3553. - DOI - PubMed
    1. West Greenlee MH, et al. Temporal Resolution of Misfolded Prion Protein Transport, Accumulation, Glial Activation, and Neuronal Death in the Retinas of Mice Inoculated with Scrapie. Am J Pathol. 2016;186:2302–2309. doi: 10.1016/j.ajpath.2016.05.018. - DOI - PMC - PubMed
    1. Alibhai J, et al. Distribution of Misfolded Prion Protein Seeding Activity Alone Does Not Predict Regions of Neurodegeneration. PLoS Biol. 2016;14 doi: 10.1371/journal.pbio.1002579. - DOI - PMC - PubMed
    1. Glass CK, Saijo K, Winner B, Marchetto MC, Gage FH. Mechanisms underlying inflammation in neurodegeneration. Cell. 2010;140:918–934. doi: 10.1016/j.cell.2010.02.016. - DOI - PMC - PubMed

Publication types

MeSH terms