

Association of monoamine oxidase-A genetic variants and amygdala morphology in violent offenders with antisocial personality disorder and high psychopathic traits
- PMID: 28851912
- PMCID: PMC5575239
- DOI: 10.1038/s41598-017-08351-w
Association of monoamine oxidase-A genetic variants and amygdala morphology in violent offenders with antisocial personality disorder and high psychopathic traits
Abstract
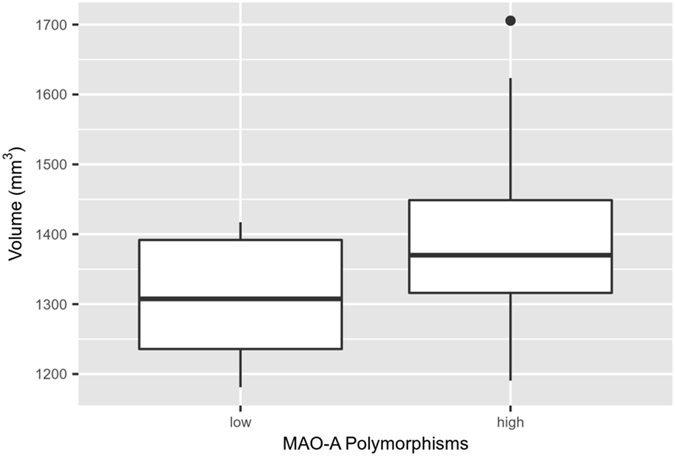
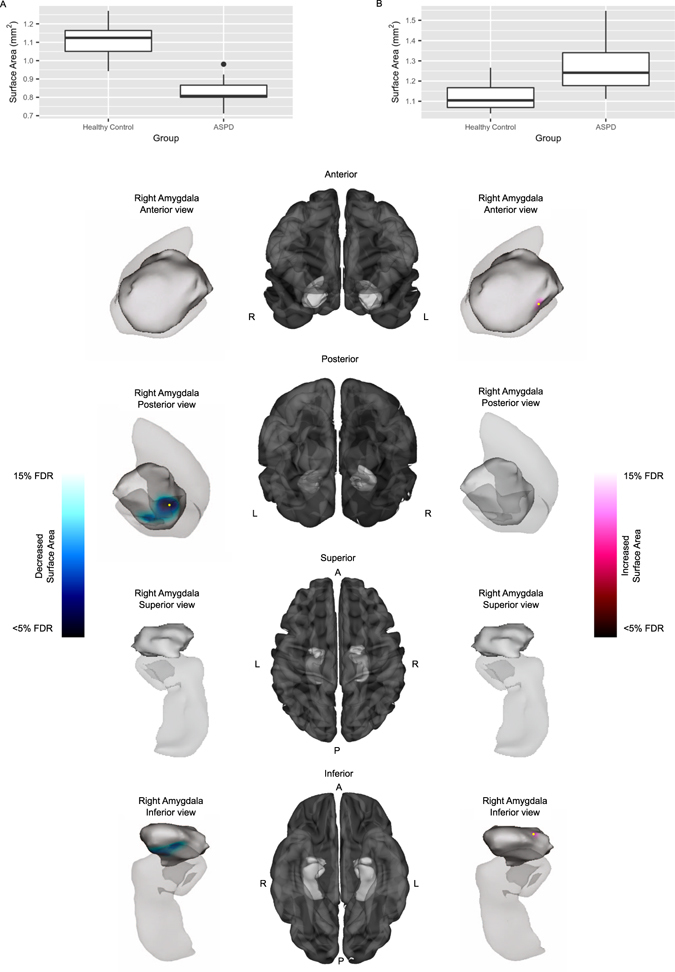
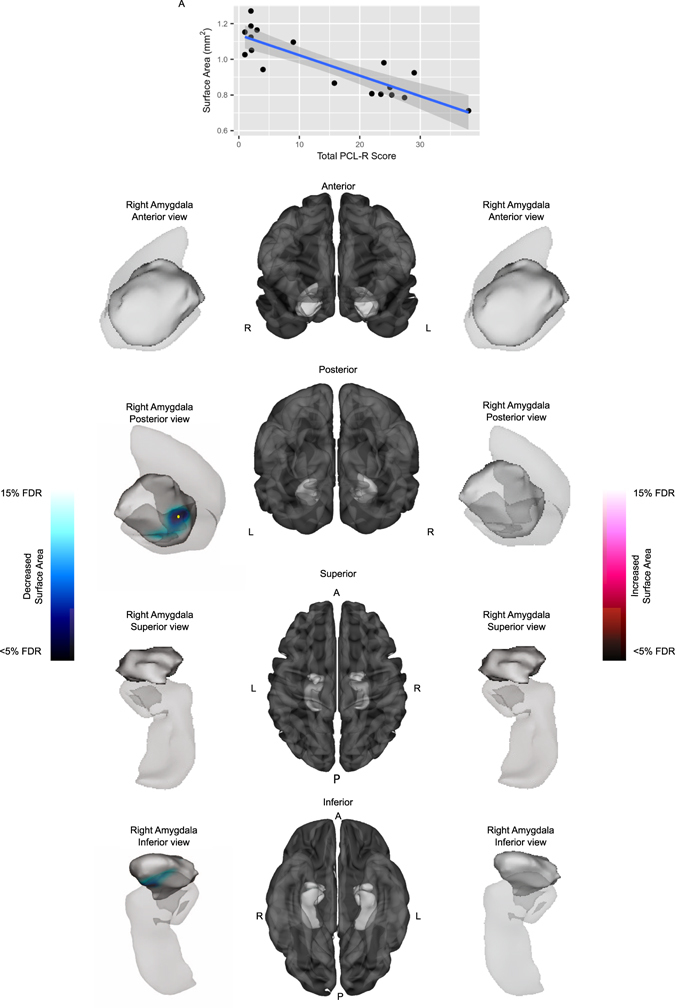
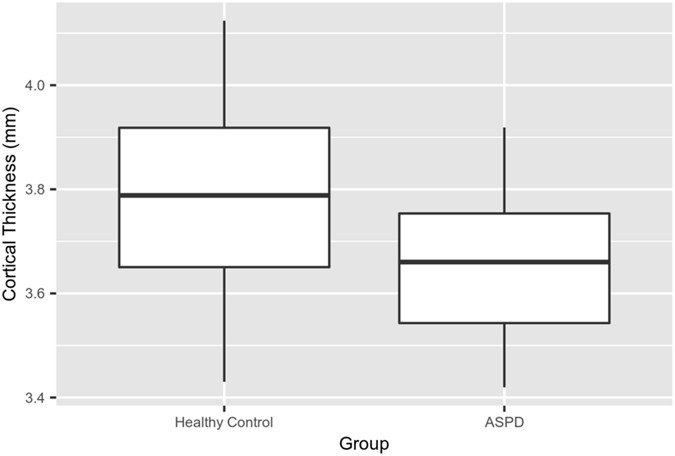
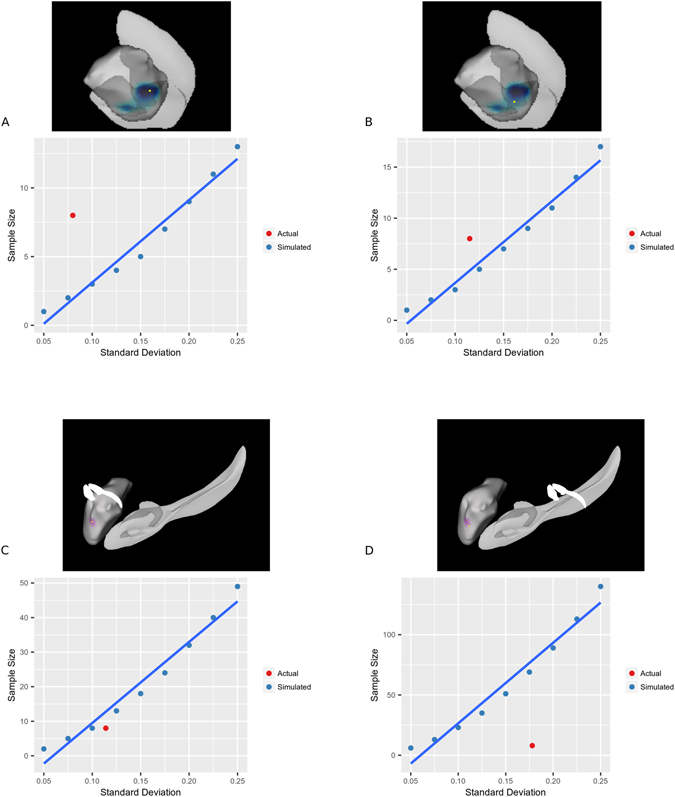
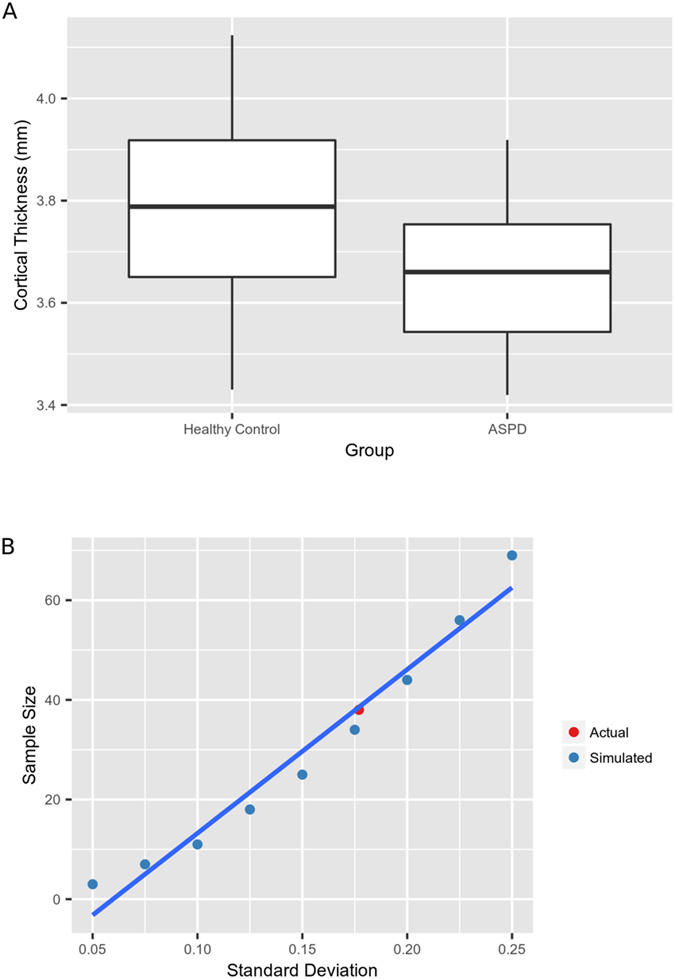
Violent offending is elevated among individuals with antisocial personality disorder (ASPD) and high psychopathic traits (PP). Morphological abnormalities of the amygdala and orbitofrontal cortex (OFC) are present in violent offenders, which may relate to the violence enacted by ASPD + PP. Among healthy males, monoamine oxidase-A (MAO-A) genetic variants linked to low in vitro transcription (MAOA-L) are associated with structural abnormalities of the amygdala and OFC. However, it is currently unknown whether amygdala and OFC morphology in ASPD relate to MAO-A genetic polymorphisms. We studied 18 ASPD males with a history of violent offending and 20 healthy male controls. Genomic DNA was extracted from peripheral leukocytes to determine MAO-A genetic polymorphisms. Subjects underwent a T1-weighted MRI anatomical brain scan that provided vertex-wise measures of amygdala shape and surface area and OFC cortical thickness. We found that ASPD + PP subjects with MAOA-L exhibited decreased surface area in the right basolateral amygdala nucleus and increased surface area in the right anterior cortical amygdaloid nucleus versus healthy MAOA-L carriers. This study is the first to describe genotype-related morphological differences of the amygdala in a population marked by high aggression. Deficits in emotional regulation that contribute to the violence of ASPD + PP may relate to morphological changes of the amygdala under genetic control.
Conflict of interest statement
J.H.M. has received operating grant funds for other studies from Eli-Lilly, GlaxoSmithKline, Bristol Myers Squibb, Lundbeck, Janssen, and SK Life Sciences in the past 5 years. J.H.M. has consulted to several of these companies as well as Takeda, Sepracor, Trius, Mylan, and Teva. These organizations had no further role in the study design; in the collection, analysis, and interpretation of data; in the writing of the report; and in the decision to submit the paper for publication. All other authors report no financial disclosures.
Figures
Similar articles
-
Lower Monoamine Oxidase-A Total Distribution Volume in Impulsive and Violent Male Offenders with Antisocial Personality Disorder and High Psychopathic Traits: An [(11)C] Harmine Positron Emission Tomography Study.Neuropsychopharmacology. 2015 Oct;40(11):2596-603. doi: 10.1038/npp.2015.106. Epub 2015 Jun 17. Neuropsychopharmacology. 2015. PMID: 26081301 Free PMC article.
-
Single-Photon Emission Computed Tomography and Positron Emission Tomography Studies of Antisocial Personality Disorder and Aggression: a Targeted Review.Curr Psychiatry Rep. 2019 Mar 9;21(4):24. doi: 10.1007/s11920-019-1011-6. Curr Psychiatry Rep. 2019. PMID: 30852703 Free PMC article. Review.
-
Monoamine oxidase A gene promoter methylation and transcriptional downregulation in an offender population with antisocial personality disorder.Br J Psychiatry. 2015 Mar;206(3):216-22. doi: 10.1192/bjp.bp.114.144964. Epub 2014 Dec 11. Br J Psychiatry. 2015. PMID: 25497297
-
Interaction between a functional MAOA locus and childhood sexual abuse predicts alcoholism and antisocial personality disorder in adult women.Mol Psychiatry. 2008 Mar;13(3):334-47. doi: 10.1038/sj.mp.4002034. Epub 2007 Jun 26. Mol Psychiatry. 2008. PMID: 17592478
-
Monoamine Oxidase A in Antisocial Personality Disorder and Borderline Personality Disorder.Curr Behav Neurosci Rep. 2017;4(1):41-48. doi: 10.1007/s40473-017-0102-0. Epub 2017 Feb 3. Curr Behav Neurosci Rep. 2017. PMID: 29568721 Free PMC article. Review.
Cited by
-
Deficits in emotion recognition and processing in children with high callous-unemotional traits: the role of the MAOA gene.Eur Child Adolesc Psychiatry. 2024 Oct;33(10):3529-3540. doi: 10.1007/s00787-024-02397-8. Epub 2024 Mar 20. Eur Child Adolesc Psychiatry. 2024. PMID: 38507052 Free PMC article.
-
Neurobiology of Aggression-Review of Recent Findings and Relationship with Alcohol and Trauma.Biology (Basel). 2023 Mar 20;12(3):469. doi: 10.3390/biology12030469. Biology (Basel). 2023. PMID: 36979161 Free PMC article. Review.
-
Type A monoamine oxidase; its unique role in mood, behavior and neurodegeneration.J Neural Transm (Vienna). 2025 Mar;132(3):387-406. doi: 10.1007/s00702-024-02866-z. Epub 2024 Dec 2. J Neural Transm (Vienna). 2025. PMID: 39621110 Review.
-
Corticostriatal Connectivity in Antisocial Personality Disorder by MAO-A Genotype and Its Relationship to Aggressive Behavior.Int J Neuropsychopharmacol. 2018 Aug 1;21(8):725-733. doi: 10.1093/ijnp/pyy035. Int J Neuropsychopharmacol. 2018. PMID: 29746646 Free PMC article.
-
Is the Psychopathic Brain an Artifact of Coding Bias? A Systematic Review.Front Psychol. 2021 Apr 12;12:654336. doi: 10.3389/fpsyg.2021.654336. eCollection 2021. Front Psychol. 2021. PMID: 33912115 Free PMC article.
References
-
- Esbec E, Echeburua E. Violence and personality disorders: clinical and forensic implications. Actas Esp Psiquiatri. 2010;38:249–261. - PubMed
MeSH terms
Substances
LinkOut - more resources
Full Text Sources
Other Literature Sources
Miscellaneous
