. 2017 Aug 29;7(1):9716.
doi: 10.1038/s41598-017-09289-9.

Calorie restriction effects on circadian rhythms in gene expression are sex dependent

Affiliations

Calorie restriction effects on circadian rhythms in gene expression are sex dependent

Artem A Astafev et al. Sci Rep. .

Abstract

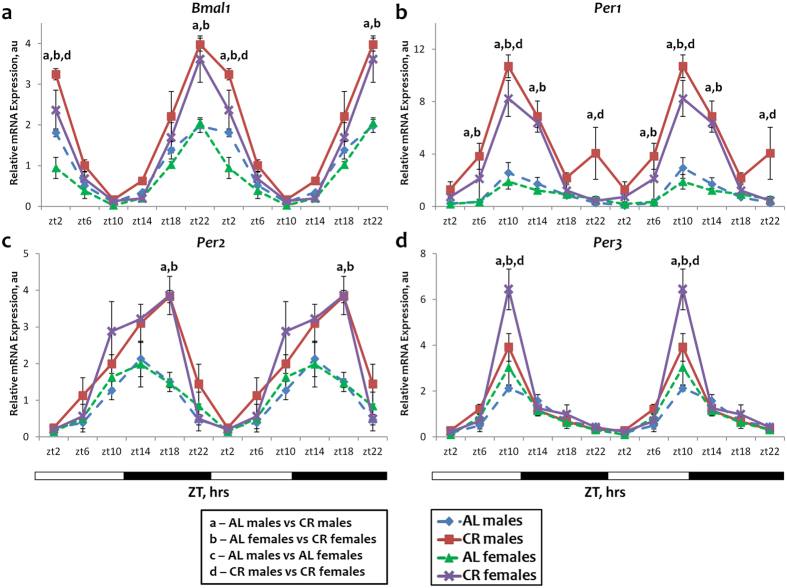
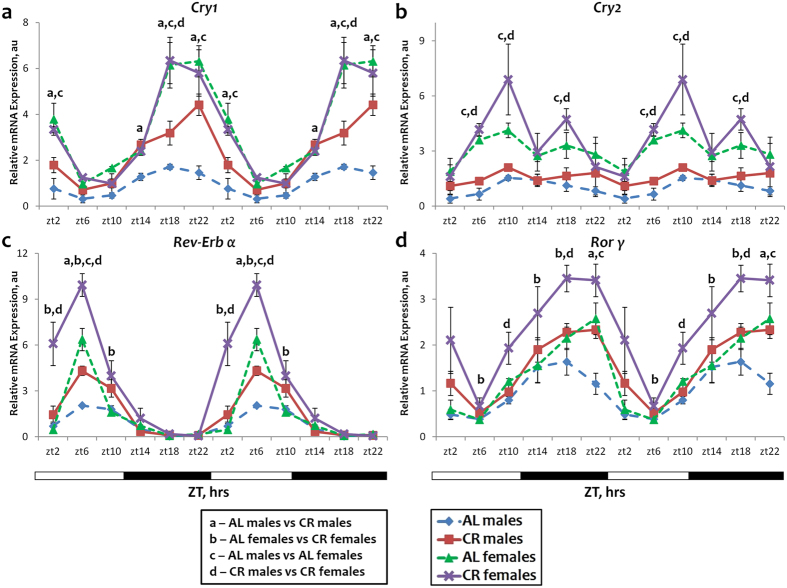
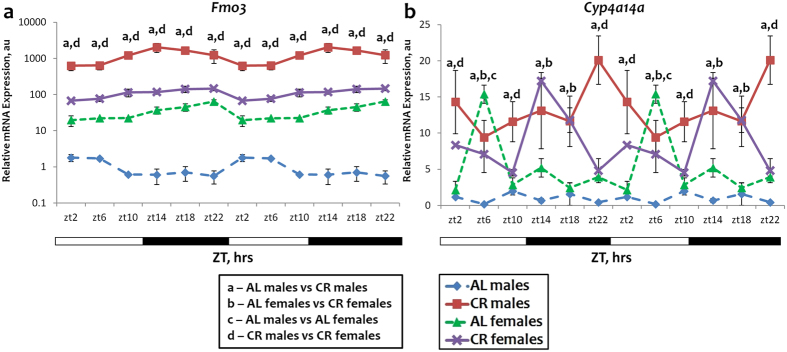
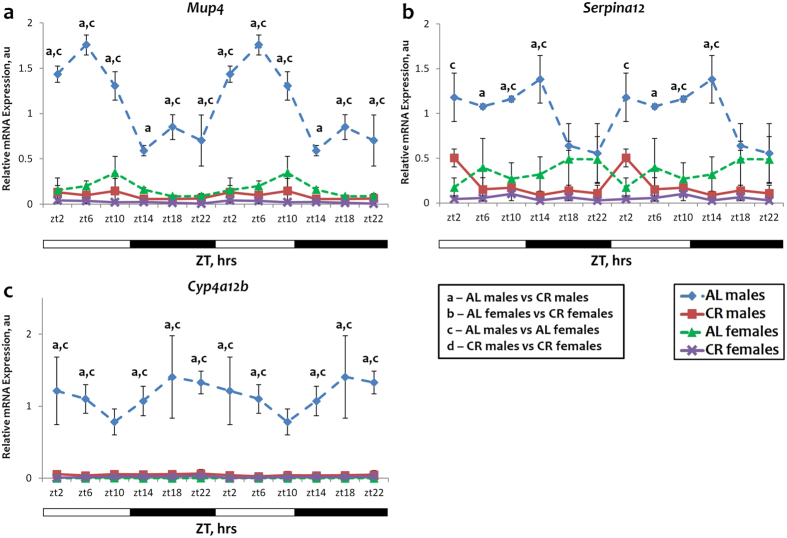
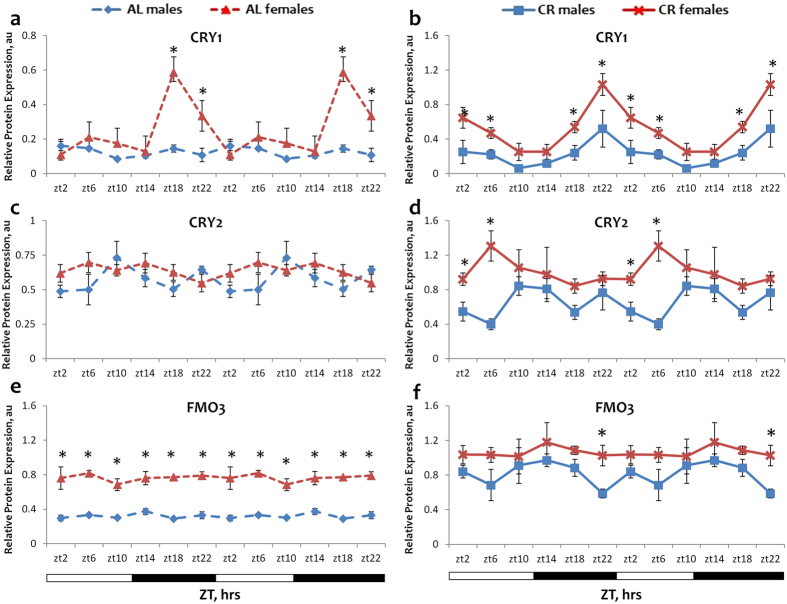
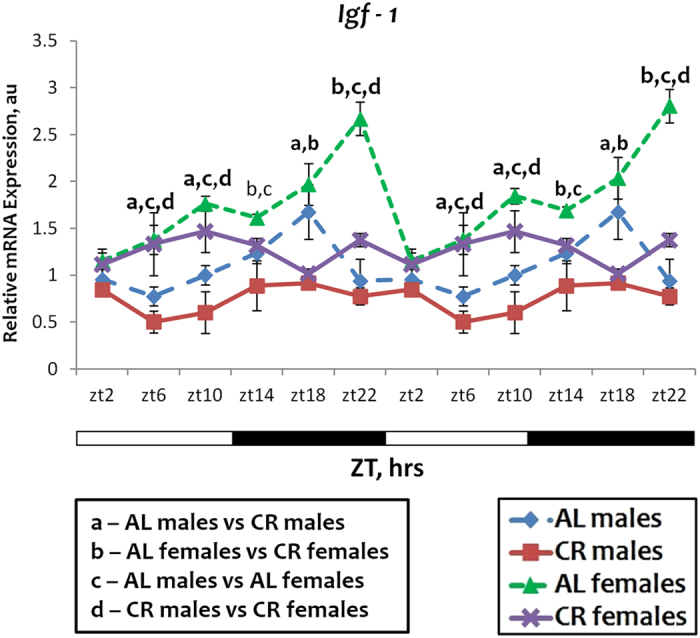
The rhythms in the expression of circadian clock genes are affected by calorie restriction (CR), a dietary paradigm known to increase lifespan. Many physiological effects of CR differ between males and females; here we investigated if the sex of animals affects the CR induced changes in the circadian rhythms. The liver expression of some circadian clock genes such as Bmal1 and three Periods (Per1, Per2 and Per3) and the effect of CR on the expression of these genes were sex independent, while the expression of Rev-Erb alpha, Ror gamma and both Cryptochome (Cry1 and Cry2) genes was different between males and females. The effect of CR on Rev-Erb alpha, Ror gamma and Cry1 gene expression was sex dependent. The expression and the effects of CR were sex-specific for several genes previously reported to be regulated by CR: Fmo3, Mup4, Serpina12 and Cyp4a12, while the expression of Cyp4a14a was sex independent. IGF signaling plays an important role in aging and CR effects. Igf-1 expression is regulated by CR and by the circadian clock, we found that rhythms in Igf-1 expression have sexual dimorphism. Our data provide molecular evidence that the sex of animals is an important modulator of circadian rhythms in gene expression and their response to CR.


Conflict of interest statement

The authors declare that they have no competing interests.

Figures

Figure 1
Figure 1
Sex independent expression and response to CR for some circadian clock genes. The daily rhythms in expression of mRNA for Bmal1 (a), Per1 (b), Per2 (c) and Per3 (d) in the liver: blue diamonds and dashed lines – AL male mice; red squares and solid lines – CR male mice, green triangles and dashed lines – AL female mice; purple x and solid lines – CR female mice. For all panels graphs are double plotted. Light is on at ZT0 and off at ZT12. a, b, c, d – statistically significant difference (p < 0.05) between indicated groups at particular time point. Open bars represent light and black bars represent dark phase of the day. Food for CR group was provided at ZT14. At every time of the day 3 mice of each sex were used for each diet.
Figure 2
Figure 2
Sexual dimorphism in the expression and response to CR for some circadian clock genes. The daily rhythms in expression of mRNA for Cry1 (a), Cry2 (b), Rev-Erb α (c) and Ror γ (d) in the liver: blue diamonds and dashed lines – AL male mice; red squares and solid lines – CR male mice, green triangles and dashed lines – AL female mice; purple x and solid lines – CR female mice. For all panels graphs are double plotted. Light is on at ZT0 and off at ZT12. a, b, c, d – statistically significant difference (p < 0.05) between indicated groups at time point. Open bars represent light and black bars represent dark phase of the day. Food for CR group was provided at ZT14. At every time of the day 3 mice of each sex were used for each diet.
Figure 3
Figure 3
Sexual dimorphism and sex independent expression and response to CR for genes upregulated by CR. The daily rhythms in expression of mRNA for Fmo3 (a) and Cyp4a14a (b) in the liver: blue diamonds and dashed lines – AL male mice; red squares and solid lines – CR male mice, green triangles and dashed lines – AL female mice; purple x and solid lines – CR female mice. For all panels graphs are double plotted. Light is on at ZT0 and off at ZT12. a, b, c, d – statistically significant difference (p < 0.05) between indicated groups at time point. Open bars represent light and black bars represent dark phase of the day. Food for CR group was provided at ZT14. At every time of the day 3 mice of each sex were used for each diet.
Figure 4
Figure 4
Sexual dimorphism and sex independent expression and response to CR for genes downregulated by CR. The daily rhythms in expression of mRNA for Mup4 (a), Serpina12 (b) and Cyp4a12b (c) and in the liver: blue diamonds and dashed lines – AL male mice; red squares and solid lines – CR male mice, green triangles and dashed lines – AL female mice; purple x and solid lines – CR female mice. For all panels graphs are double plotted. Light is on at ZT0 and off at ZT12. a, b, c, d – statistically significant difference (p < 0.05) between indicated groups at time point. Open bars represent light and black bars represent dark phase of the day. Food for CR group was provided at ZT14. At every time of the day 3 mice of each sex were used for each diet.
Figure 5
Figure 5
Sexual dimorphism in the expression for CRY1, CRY2 and FMO3 proteins. The daily rhythms in expression of proteins for CRY1 (a and b), CRY2 (c and d), FMO3 (e and f) in the liver: blue diamonds and dashed lines – AL male mice; blue squares and solid lines – CR male mice, red triangles and dashed lines – AL female mice; red x and solid lines – CR female mice. For all panels graphs are double plotted. Light is on at ZT0 and off at ZT12. Asterisk (*) indicates statistically significant difference (p < 0.05) in protein levels between the sexes. Open bars represent light and black bars represent dark phase of the day. Food for CR group was provided at ZT14. At every time of the day 3 mice of each sex were used for each diet. The respective images from Western blot analysis are shown in Supplementary Figs S1 and S2.
Figure 6
Figure 6
Sexual dimorphism in Igf-1 mRNA expression. The daily rhythms in expression of mRNA for Igf-1 in the liver: blue diamonds and dashed lines – AL male mice; red squares and solid lines – CR male mice, green triangles and dashed lines – AL female mice; purple x and solid lines – CR female mice. For all panels graphs are double plotted. Light is on at ZT0 and off at ZT12. a, b, c, d – statistically significant difference (p < 0.05) between indicated groups. Open bars represent light and black bars represent dark phase of the day. Food for CR group was provided at ZT14. At every time of the day 3 mice of each sex were used for each diet.

References

    1. Froy O, Miskin R. Effect of feeding regimens on circadian rhythms: Implications for aging and longevity. Aging (Albany. NY). 2010;2:7–27. doi: 10.18632/aging.100116. - DOI - PMC - PubMed
    1. Mitchell S, et al. Effects of Sex, Strain, and Energy Intake on Hallmarks of Aging in Mice. Cell Metab. 2016;23:1093–112. doi: 10.1016/j.cmet.2016.05.027. - DOI - PMC - PubMed
    1. Patel SA, Chaudhari A, Gupta R, Velingkaar N, Kondratov RV. Circadian clocks govern calorie restriction-mediated life span extension through BMAL1- and IGF-1-dependent mechanisms. FASEB J. 2016;30:1634–1642. doi: 10.1096/fj.15-282475. - DOI - PMC - PubMed
    1. Nakahata Y, et al. The NAD + -Dependent Deacetylase SIRT1 Modulates CLOCK-Mediated Chromatin Remodeling and Circadian Control. Cell. 2008;134:329–340. doi: 10.1016/j.cell.2008.07.002. - DOI - PMC - PubMed
    1. Khapre RV, et al. BMAL1-dependent regulation of the mTOR signaling pathway delays aging. Aging (Albany. NY). 2014;6:48–57. doi: 10.18632/aging.100633. - DOI - PMC - PubMed

Publication types

LinkOut - more resources