. 2017 Aug 29;7(1):9736.
doi: 10.1038/s41598-017-09567-6.

Putrescine independent wound response phenotype is produced by ODC-like RNAi in planarians

Affiliations

Putrescine independent wound response phenotype is produced by ODC-like RNAi in planarians

Lucia Cassella et al. Sci Rep. .

Abstract

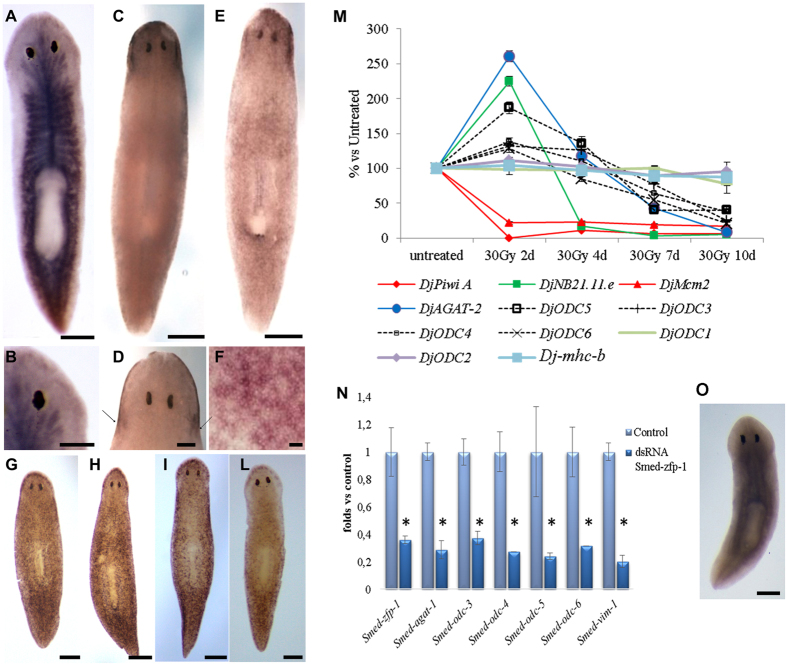
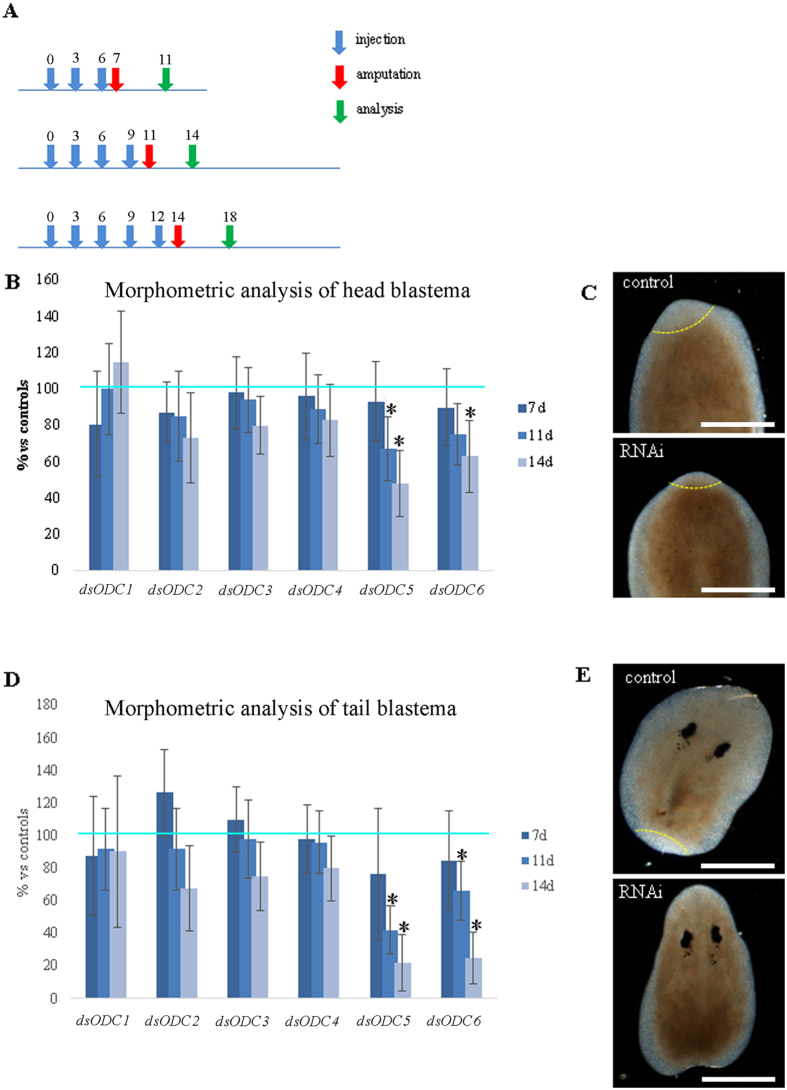
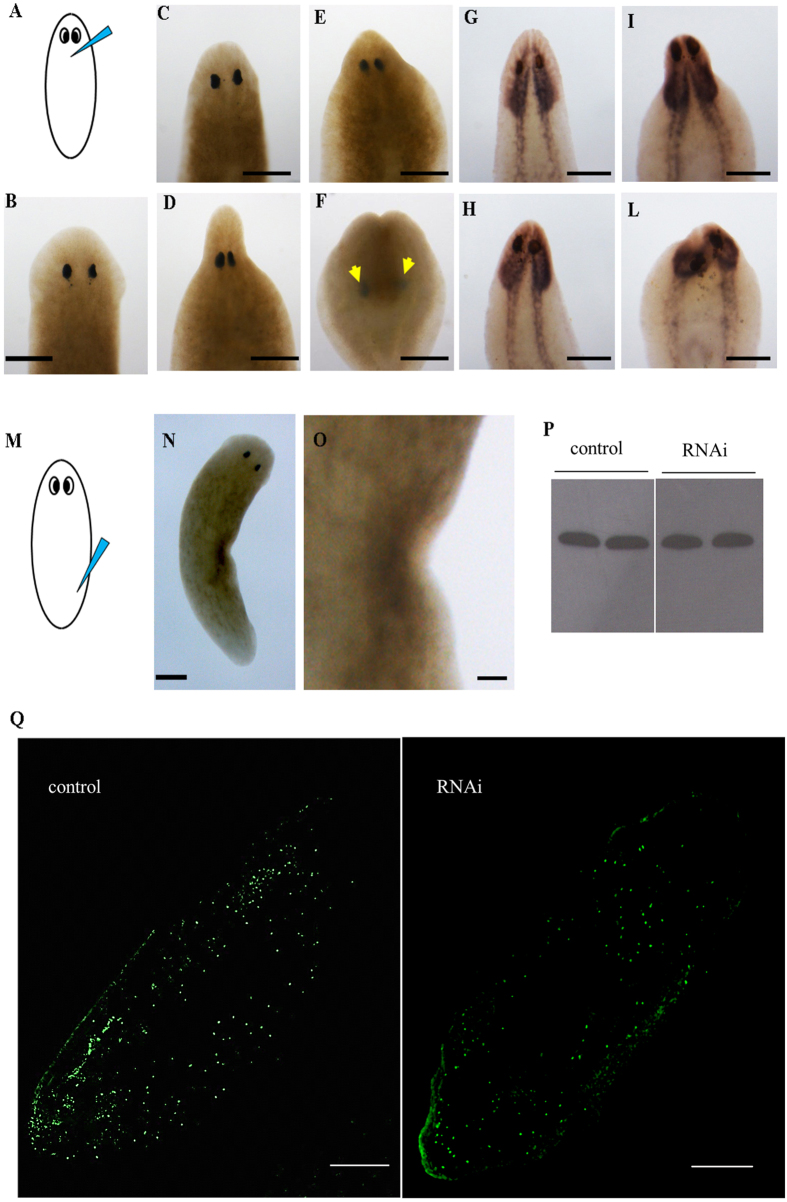
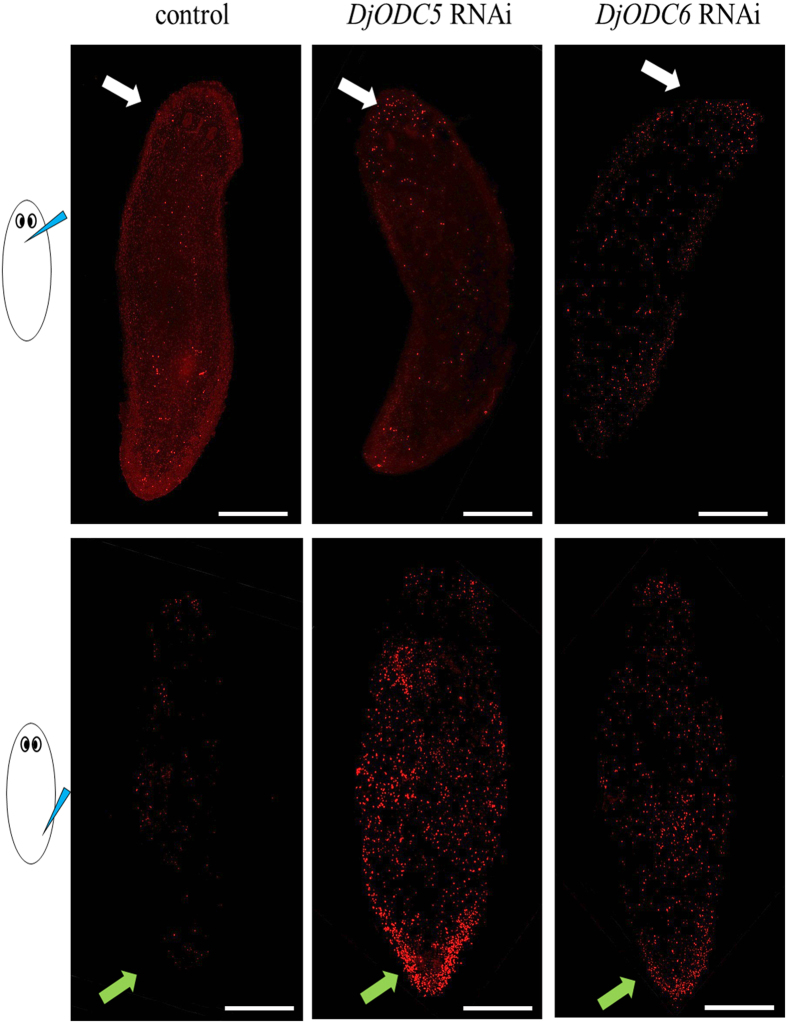
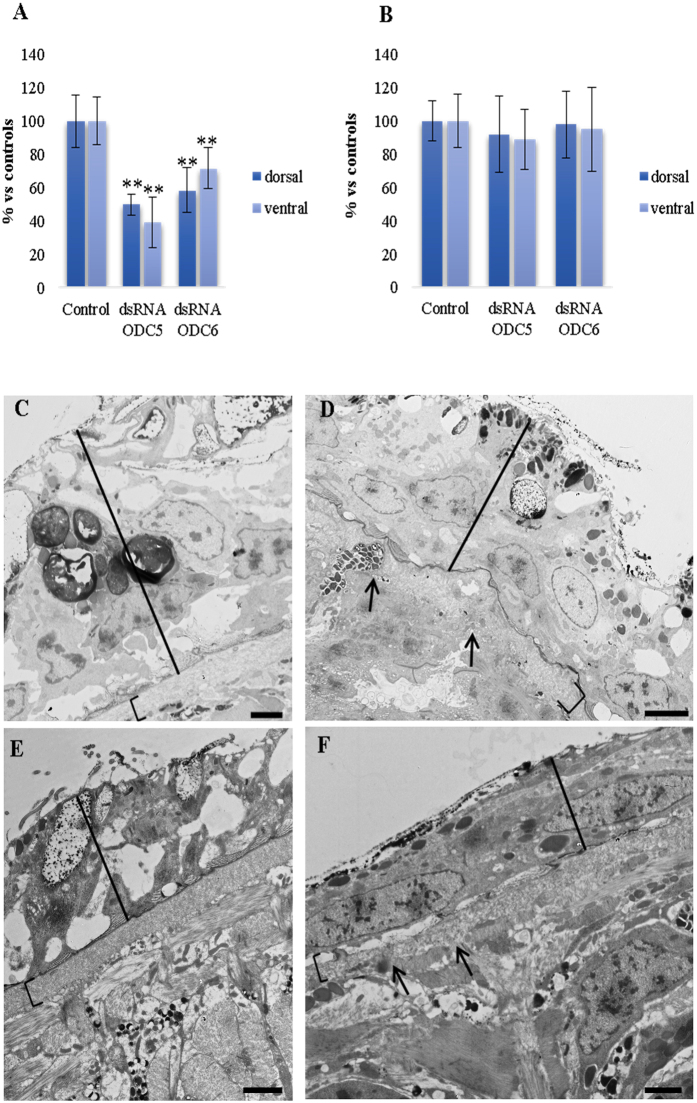
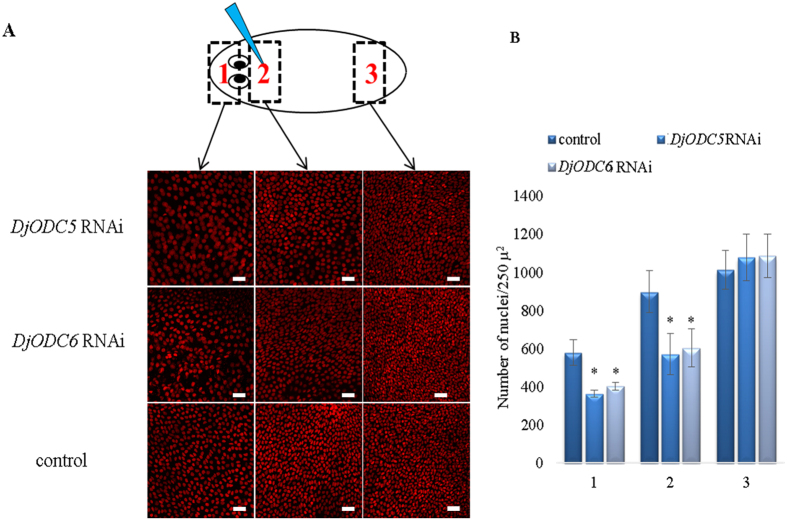
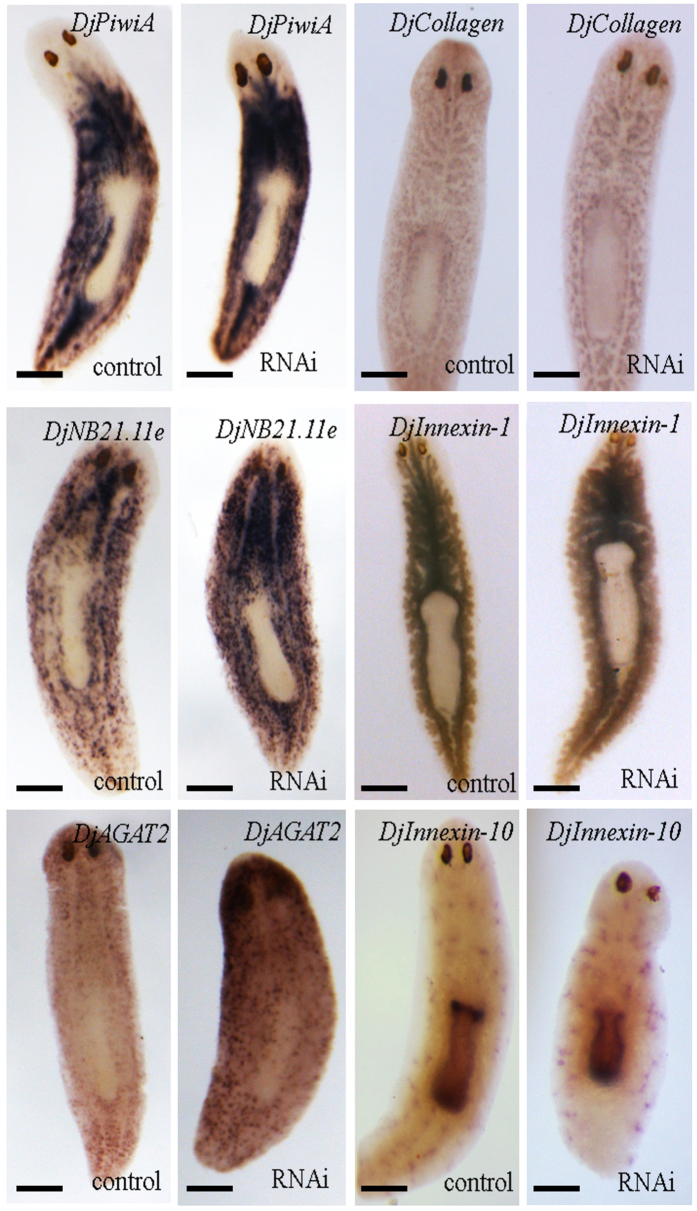
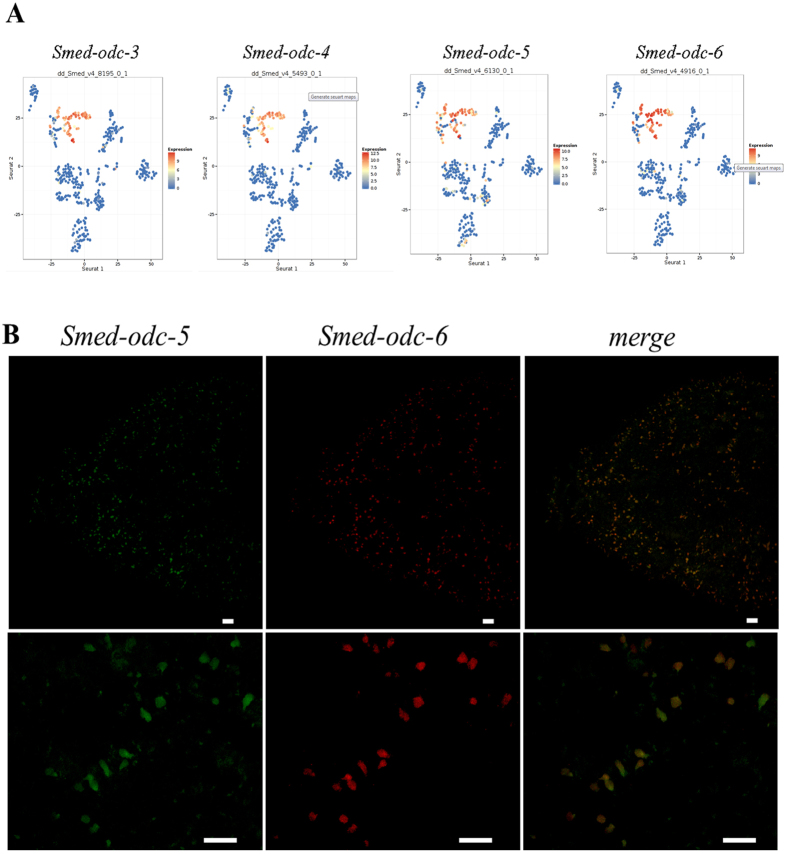
Despite increasing evidence indicates polyamines as a convergence point for signaling pathways, including cell growth and differentiation, a unifying concept to interpret their role is still missing. The activity of ornithine decarboxylase (ODC), the rate-limiting enzyme in polyamine biosynthesis, is tightly regulated by a complex molecular machinery, and the demonstration of the existence of multiple ODC paralogs, lacking decarboxylation activity, suggests additional layers of complexity to the intricate ODC regulatory pathway. Because of their extraordinary regenerative abilities and abundance of stem cells, planarians have potential to contribute to our understanding of polyamine function in an in vivo context. We undertook a study on ODC function in planarians and we found six planarian ODCs (ODC1-6). Five out of six ODC homologs carry substitutions of key aminoacids for enzymatic activity, which makes them theoretically unable to decarboxylate ornithine. Silencing of ODC5 and 6 produced a complex phenotype, by prompting animals to an aberrant response, following chronic injury without tissue removal. Phenotype is neither rescued by putrescine, nor mimicked by difluoromethylornithine treatment. Moreover, the co-silencing of other genes of the ODC regulatory pathway did not modulate phenotype outcome or severity, thus suggesting that the function/s of these ODC-like proteins might be unrelated to decarboxylase activity and putrescine production.


Conflict of interest statement

The authors declare that they have no competing interests.

Figures

Figure 1
Figure 1
Analysis of ODC and OAZ transcript expression in intact planarians. (A) Representative image of an intact planaria hybridized with DjODC1. (B) Magnification of the head region of an intact planaria hybridized with DjODC1 probe, dorsal view. (C) Representative image of an intact planaria hybridized with DjODC2 probe, dorsal view. (D) Magnification of the head region of an intact planaria hybridized with DjODC2 probe, dorsal view. Arrows indicate the auricles. (E) Representative image of an intact planaria hybridized with DjODC2 probe, ventral view. (F) Magnification of DjODC2-positive cells, ventral. (G–L) Representative images of intact planarians hybridized with DjODC3, 4, 5, 6 probes respectively. Scale bars correspond to: 250 µm for (A,C,E,G–L,O); 100 µm for (B and D); 50 µm for (F). (M) relative expression level of D. japonica ODC transcripts and stem cell and stem cell progeny markers in 30 Gy-treated and untreated samples. The trend of progressive decrease in expression of DjODC3-6 resembles that of DjAGAT2, the D. japonica homolog of the Smed-agat-2. As a comparison, we included in the analysis the D. japonica homolog of the S. mediterranea early neoblast progeny marker Smed-NB21.11.e whose expression starts decreasing at an earlier time point (approximately 4d after treatment), in contrast with the markers of proliferating cells DjPiwiA and DjMcm2 whose signal disappears 24 h after 30 Gy X-ray exposure. Djmhc-b, a marker of differentiated sub-epidermal muscle cells, was included as a control for differentiated cells. Each point is the mean ± s.d. of three independent samples, normalized versus the corresponding control, to which an arbitrary value of 100% was attributed. (M) Relative expression levels of S. mediterranea ODC, Smed-zfp-1, Smed-agat-1 and Smed-vim-1 (epidermal marker) transcripts, in Smed-zfp-1 RNAi animals and controls. Each bar is the mean ± s.d. of three independent samples, normalized versus the corresponding control, to which an arbitrary value of 1 was attributed. *p < 0.01. (N) representative image of an intact planaria, hybridized with DjOAZ probe, dorsal view. Scale bar corresponds to 250 µm.
Figure 2
Figure 2
Morphometric analysis of head and tail blastemas after ODC RNAi. (A) Schematic representation of the experimental set-up. Numbers indicate the day. Amputation was performed in the neck region. Regeneration rate was assessed by morphometric analysis cutting the animals in the neck region 7, 11 and 14 days after the first dsRNA injection and analyzing blastema size 4 days after the cut. (B) Morphometric analysis of head blastemas. Each bar is the mean ± s.d. of two independent experiments (each including 15 different specimens), normalized versus the corresponding control, to which an arbitrary value of 100% was attributed. Light blue line indicates the level of controls. Asterisks indicate cases in which a p value below 0.01 was obtained comparing areas measured in control and RNAi animals in both independent experiments. (C) Representative images of planarian fragments regenerating a new head 4 days after cut. Blastemal region is marked by a dotted yellow line. (D) Morphometric analysis of tail blastemas. Each bar is the mean ± s.d. of two independent experiments (each including 15 different specimens), normalized versus the corresponding control, to which an arbitrary value of 100% was attributed. Light blue line indicates the level of controls. Asterisks indicate cases in which a p value below 0.01 was obtained comparing areas measured in control and RNAi animals in both independent experiments. (E) Representative images of planarian fragments regenerating a new tail, 4 days after cut. Blastemal region is marked by a dotted yellow line. Scale bar corresponds to 250 μm.
Figure 3
Figure 3
DjODC5 and 6 (RNAi) macroscopic phenotype and analysis of mitosis. (A) Scheme depicting the injection site. (B) An intact water-injected control planaria. (C–E) DjODC5 RNAi altered phenotypes, with different degrees of severity. (F) The “blemmy” phenotype. Arrows indicate the eyes. (G–L) The dynamic movement of head retraction during different stages of phenotype severity can be followed by highlighting the central nervous system with the DjSyt marker. (G) Whole mount in situ hybridization of DjSyt in an intact control planaria. (HL) Whole mount in situ hybridization of DjSyt in DjODC5 (RNAi) phenotypes. Scale bars correspond to 250 µm. (M) Scheme depicting the injection site for the phenotype showed in (N). (N) Phenotype produced by the injection in a posterior gut branch. (O) Magnification of N. Scale bars correspond to 250 µm in N and 65 µm in (O). (P,Q) Immunostaining with anti-H3P. (P) Representative Western blot showing a single cross-reactive band for H3P in control and RNAi planarians, injected with DjODC5 dsRNA molecules in the neck region. (Q) Representative images of whole planarians, immunostained with anti-H3P. Number of mitosis/mm2 was 153 ± 58, 144 ± 52 and 147 ± 52 in control, DjODC5 and 6 (RNAi) animals respectively. Scale bars correspond to 250 µm.
Figure 4
Figure 4
Tunel assay in injected planarians. Tunel positive cells are visualized in red. White arrows indicate the anterior body region. Green arrows indicate the posterior body region. Site of injection is drawn on the left. Scale bar corresponds to 250 µm.
Figure 5
Figure 5
Analysis of epidermal thickness and ultrastructure (A) Graph depicting the epidermis thickness evaluated in the body region close to the injection site. (B) Graph depicting epidermis thickness evaluated in the body region far from injection site. Each bar is the mean ± s.d. of five independent samples in which epidermis thickness was evaluated in 5 different sections. In each section 6 measurement were taken. Values were normalized versus the corresponding control, to which an arbitrary value of 100% was attributed. **p < 0,001. (C) Dorsal epidermis of a water injected control from a body region close to the injection site. (D) Dorsal epidermis of a RNAi animal from a body region close to the injection site (E) Ventral epidermis of a water injected control from a body region close to the injection site. (F) Ventral epidermis of a RNAi animal from a body region close to the injection site. Scale bars correspond to 2 µm. Ultrastructural observations were performed in three independent experiments in which we analyzed several ultrathin sections of two animals per experimental class.
Figure 6
Figure 6
Analysis of epidermis nuclear density in injected organisms. (A) Representative images of epidermis nuclei in 3 different body regions. Scale bar corresponds to 30 μm. (B) Graph depicting numbers of nuclei counted in the different body region of DjODC5 RNAi, DjODC6 RNAi and controls. Each bar is the mean ± s.d. of 3 independent samples. *p < 0.01.
Figure 7
Figure 7
Whole mount in situ hybridization of DjPiwiA, DjNB21.11e, DjAGAT2, DjInnexin1, DjInnexin10, DjCollagen on DjODC5 RNAi animals and controls (analogous results were obtained in DjODC6 RNAi animals). Scale bar corresponds to 250 µm.
Figure 8
Figure 8
Smed-odcs co-localization analysis. (A) Seurat maps generated in Planarian SCS database (https://radiant.wi.mit.edu/). Each graph represents a t-SNE embedding of single cells based on gene expression. Each cell is represented by a dot. Dot color is attributed according to the expression level of the queried gene (red for maximal expression blue for minimal expression). (B) Double fluorescent in situ hybridization of Smed-odc-5 and Smed-odc-6 transcripts. Scale bars correspond to 25 μm.

Similar articles

Cited by

References

    1. Porter CW, Bergeron RJ. Spermidine requirement for cell proliferation in eukaryotic cells: structural specificity and quantitation. Science. 1983;219:1083–5. doi: 10.1126/science.6823570. - DOI - PubMed
    1. Cohen, S. S. A Guide to Polyamines. Oxford University Press, New York (1998).
    1. Igarashi K, Kashiwagi K. Polyamine modulon in Escherichia coli: genes involved in the stimulation of cell growth by polyamines. J. Biochem. 2006;139:11–16. doi: 10.1093/jb/mvj020. - DOI - PubMed
    1. Igarashi K, Kashiwagi K. Modulation of cellular function by polyamines. Int. J. Biochem. Cell Biol. 2010;42:39–51. doi: 10.1016/j.biocel.2009.07.009. - DOI - PubMed
    1. Pegg AE. Polyamine metabolism and its importance in neoplastic growth and as a target for chemotherapy. Cancer Res. 1988;48:759–74. - PubMed

Publication types