. 2017 Aug 29;7(1):9740.
doi: 10.1038/s41598-017-09569-4.

A Plasmodium plasma membrane reporter reveals membrane dynamics by live-cell microscopy

Affiliations

A Plasmodium plasma membrane reporter reveals membrane dynamics by live-cell microscopy

Paul-Christian Burda et al. Sci Rep. .

Abstract

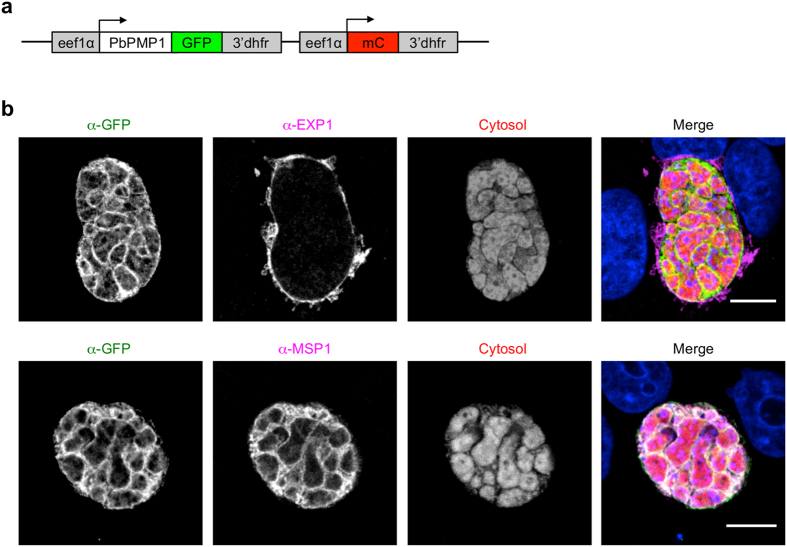
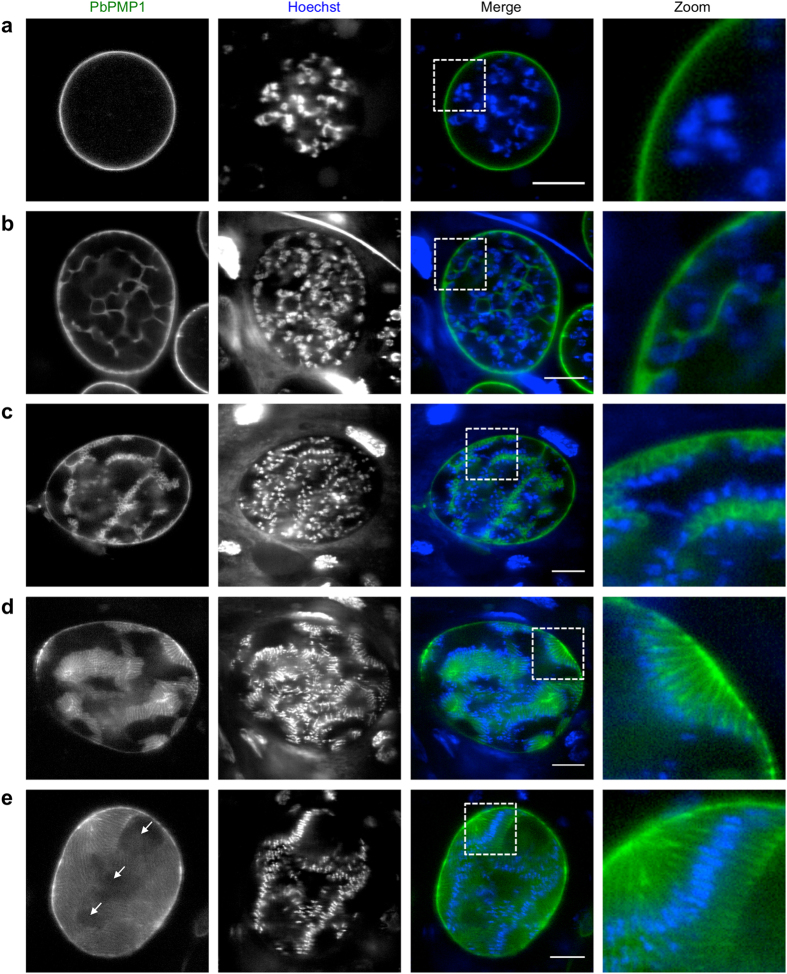
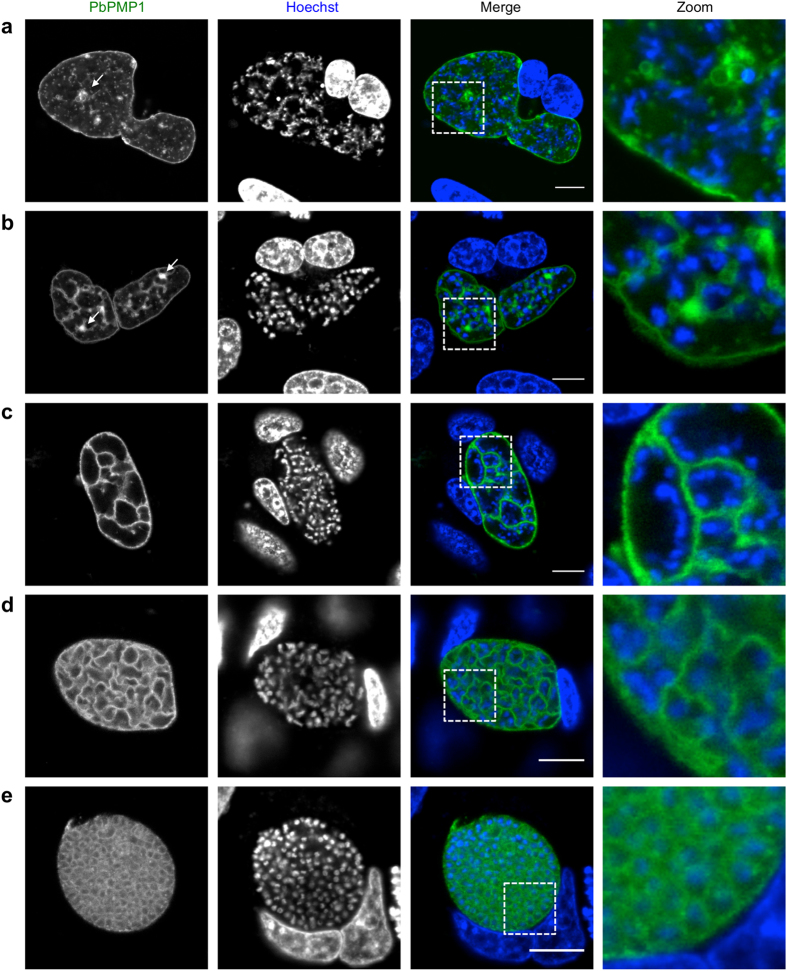
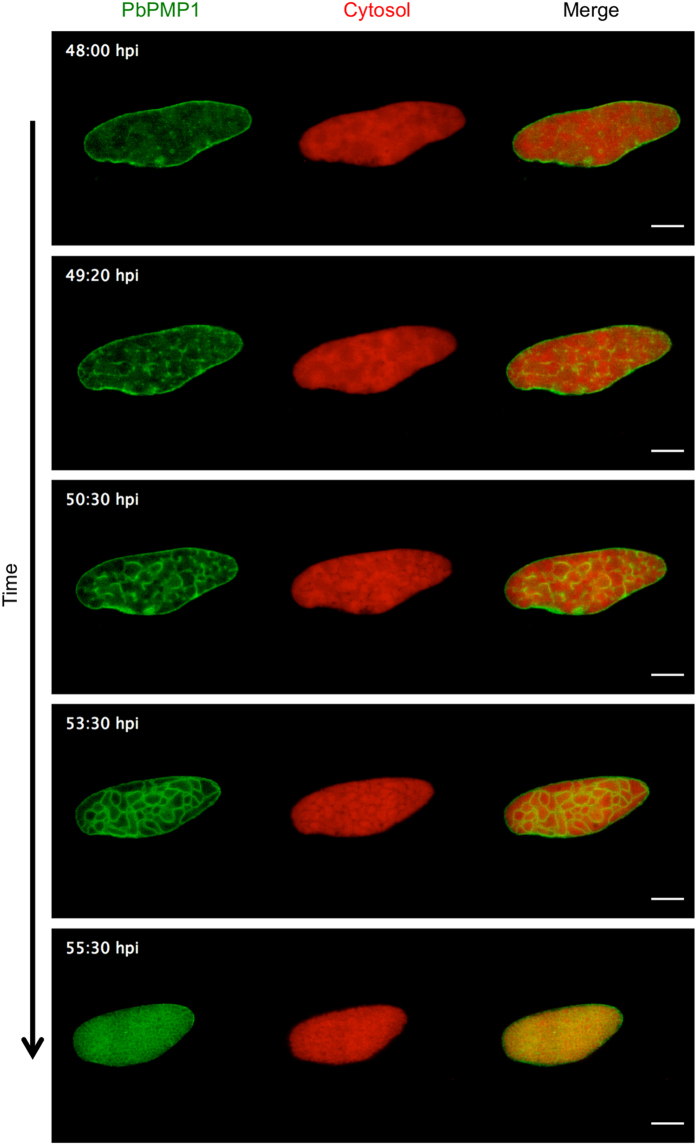
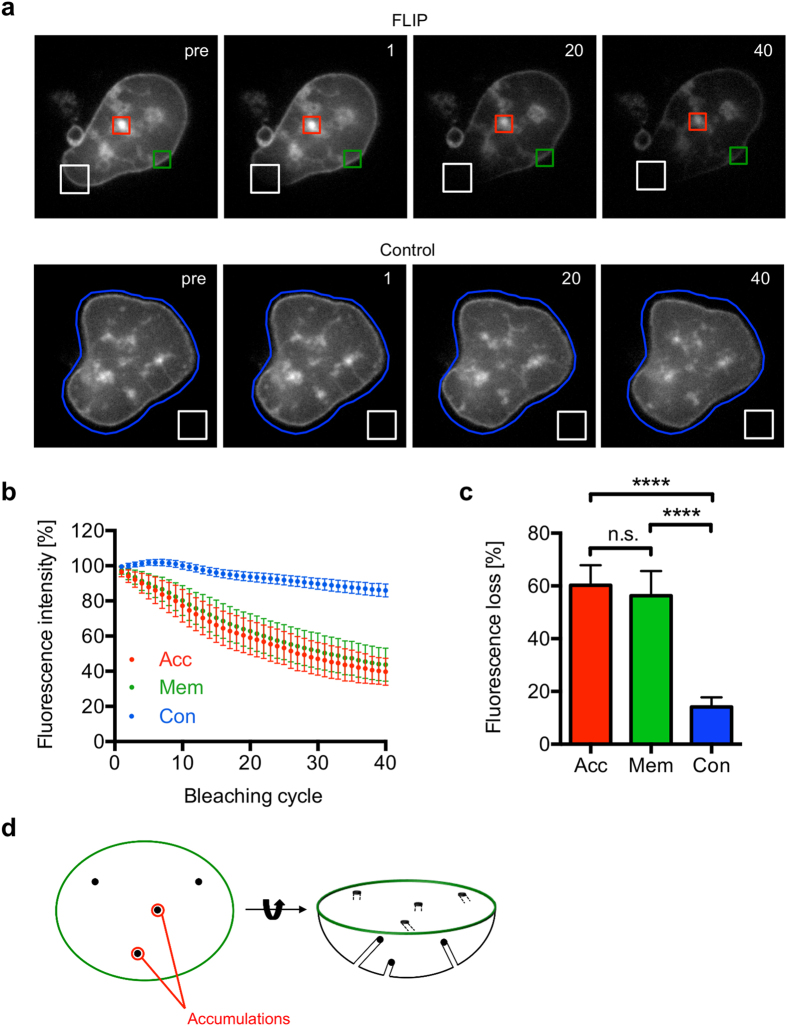
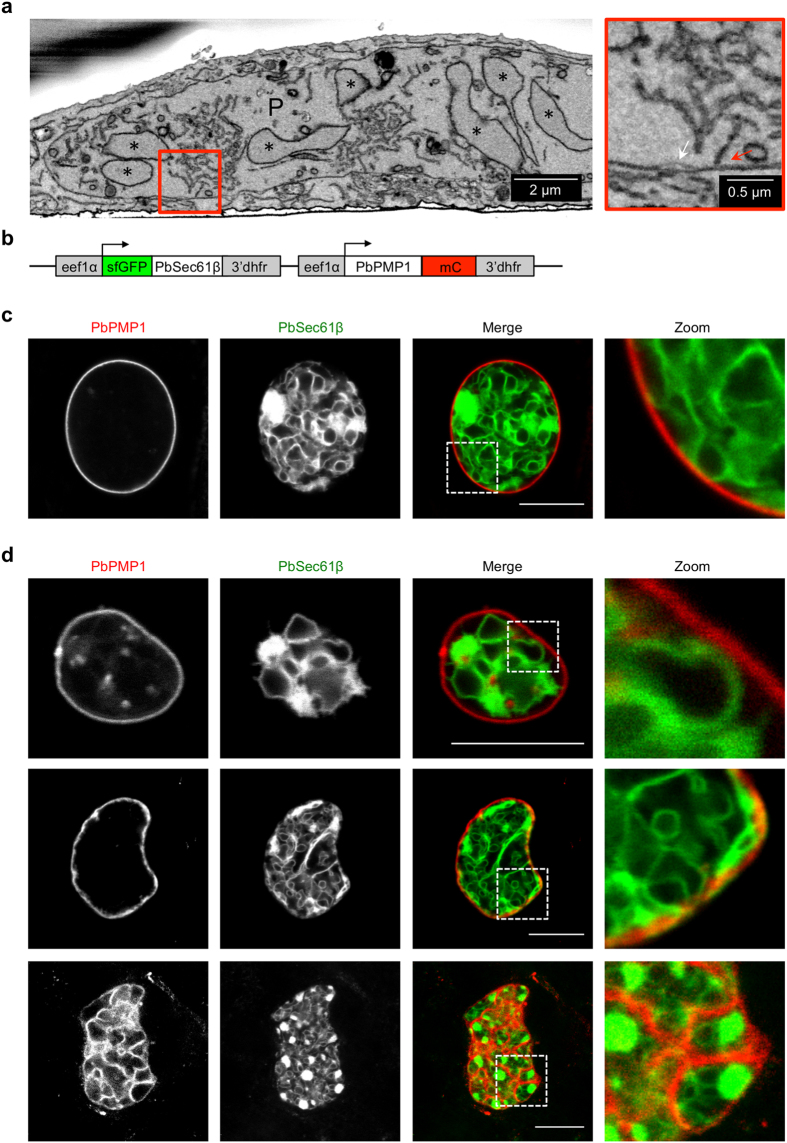
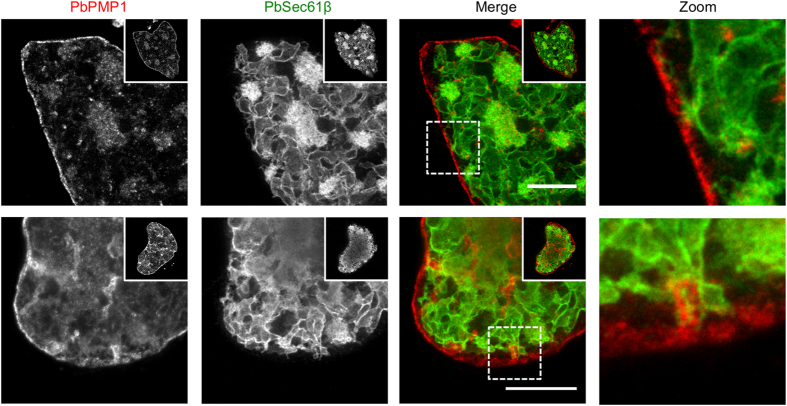
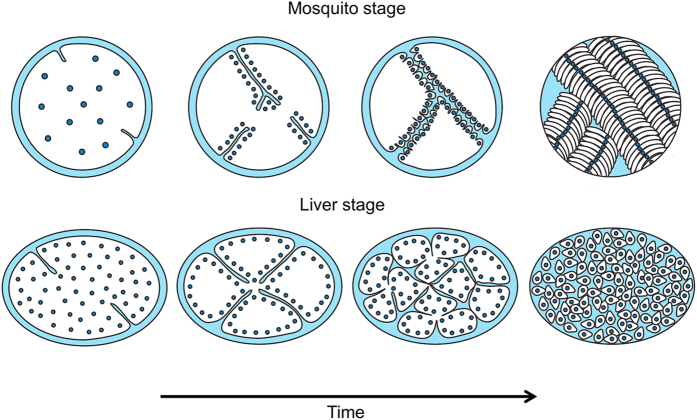
During asexual replication within the Anopheles mosquito and their vertebrate host, Plasmodium parasites depend on the generation of a massive amount of new plasma membrane to produce thousands of daughter parasites. How the parasite plasma membrane (PPM) is formed has mostly been studied by electron microscopy, which does not allow an insight into the dynamics of this process. We generated a Plasmodium berghei reporter parasite line by GFP-tagging of a non-essential PPM-localized protein, and followed plasma membrane development in living parasites through the entire Plasmodium life cycle. By generating double-fluorescent parasites in which the PPM is visualized in combination with the parasite endoplasmic reticulum, we show that membrane contact sites are formed between both membrane systems during oocyst and liver stage development that might be used to deliver lipids to the dramatically expanding PPM. In conclusion, we have established a powerful tool to follow PPM development in living parasites, which promises to greatly expand our knowledge of membrane biology in the Plasmodium parasite.


Conflict of interest statement

The authors declare that they have no competing interests.

Figures

Figure 1
Figure 1
Generation and immunofluorescence analysis of PbPMP1-GFP parasites. (a) Schematic representation of the pL0017CPbPMP1-GFP-CmCherry plasmid. The PbPMP1-GFP fusion protein and a cytosolic mCherry were both expressed under the control of the constitutive eef1α promoter. The 3′-UTR was taken from Pbdhfr/ts. (b) PbPMP1-GFP localizes to the PPM in liver stage parasites. HeLa cells were infected with PbPMP1-GFP parasites and fixed at 54 hours post-infection (hpi). IFA was performed using antisera against the PPM marker MSP1 and the PVM marker EXP1. The PbPMP1-GFP signal was enhanced by staining with an anti-GFP antiserum (green). MSP1/EXP1 (purple). Parasite cytosol (red). The merged channels additionally contain DAPI-stained nuclei (blue). Scale bars = 10 µm.
Figure 2
Figure 2
Visualization of the oocyst plasma membrane in live PbPMP1-GFP parasites. Midguts of PbPMP1-GFP parasite-infected mosquitoes were isolated at day 7, 9 and 11 after the infectious blood meal and were analyzed by confocal microscopy. (a) Oocyst at day 7 without PPM invaginations. (b) and (c) Oocysts at day 9 and 11, in which the PPM has started to form invaginations. Note that the previously randomly localized nuclei start to align along the newly formed membranes and that the PPM undergoes further invaginations close to these nuclei in (c). (d) and (e) Sporozoite formation in oocysts at day 11. Note the residual bodies; regions of cytoplasm not incorporated into forming sporozoites (indicated with arrows). PbPMP1-GFP (green). DNA was stained with Hoechst 33342 (blue). Scale bars = 10 µm. For confocal z-stacks see also Supplementary Movies S1 and S2.
Figure 3
Figure 3
Plasma membrane morphology in live PbPMP1-GFP late liver stage parasites. HeLa cells were infected with PbPMP1-GFP parasites and analyzed by confocal microscopy at 48 hpi (a,b) and 54 hpi (c,d,e). PbPMP1-GFP (green). DNA was stained with Hoechst 33342 (blue). Note the appearance of membrane accumulations (indicated with arrows), from which new membranes frequently appeared to originate and connect to the surrounding PPM. Scale bars = 10 µm. For earlier liver stage parasites see also Supplementary Fig. S5.
Figure 4
Figure 4
Visualization of PPM dynamics during late liver stage development by live-cell time-lapse microscopy. Stills from a representative movie of PbPMP1-GFP late liver stage development. HeLa cells were infected with PbPMP1-GFP parasites and confocal live-cell imaging was started at 48 hpi. PbPMP1-GFP (green). Parasite cytosol (red). Time points of imaging are indicated. Scale bars = 10 µm. See also Supplementary Movie S3.
Figure 5
Figure 5
FLIP experiments show that early membrane accumulations are connected to the surrounding PPM. HeLa cells were infected with PbPMP1-GFP parasites and a possible connection of membrane accumulations to the surrounding PPM was analyzed by FLIP experiments at 48 hpi. In each FLIP experiment, a single region of the surrounding PPM (white square) was repeatedly bleached and the fluorescence intensity of a membrane accumulation (Acc, red square) and another region on the surrounding plasma membrane (Mem, green square) was determined. As a control (Con), bleaching was performed outside of the parasite (white square) and the fluorescence intensity of the whole parasite was measured (blue circle). For all experiments, an image was acquired before bleaching and the corresponding fluorescence intensity was set to 100%. (a) Representative stills from a FLIP and a control parasite, with bleaching cycles indicated in the upper right. Pre = prebleaching. (b) Fluorescence intensity over time. (c) Statistical evaluation of the loss of fluorescence after 40 bleaching cycles. Shown are means with SD of 21 FLIP and 21 control parasites, which were obtained in two independent experiments. For statistical analysis, a one-way ANOVA followed by a Holm-Sidak multiple comparison test was performed (**** p < 0.0001, n.s. = not significant). (d) Schematic drawing of first membrane invaginations that presumably appear as membrane accumulations in a two-dimensional representation.
Figure 6
Figure 6
Double-fluorescent parasites reveal interactions of the PPM with the parasite ER during oocyst and liver stage development. (a) SBFSEM of the P. berghei ER. HeLa cells infected with mCherry-expressing parasites were fixed at 48 hpi and osmium-stained for EM. Cells were vertically cut and images were taken by SBFSEM. The boxed area is shown at a higher magnification on the right side and shows an ER extension (red arrow) to the parasite PM and or PVM (white arrow). P, parasite; asterisks, parasite nuclei. (b) Schematic representation of the pL0017CsfGFP-PbSec61β-CPbPMP1-mCherry plasmid. The sfGFP and mCherry fusion proteins were both expressed under the control of the constitutive eef1α promoter. The 3′-UTR was taken from Pbdhfr/ts. (c) and (d) Interactions of the parasite ER and the PPM in oocysts and liver stage parasites. (c) Midguts of sfGFP-PbSec61β/PbPMP1-mCherry parasite-infected mosquitoes were isolated at day 7 after the infectious blood meal and were analyzed live by confocal microscopy. (d) HeLa cells were infected with sfGFP-PbSec61β/PbPMP1-mCherry parasites and analyzed live by confocal microscopy at 24 hpi (upper row) and 48 hpi (two lower rows). SfGFP-PbSec61β (green), PbPMP1-mCherry (red). Extensions of the ER in contact with the surrounding PPM were found in all oocysts and liver stages examined (a total of 20 oocysts analyzed at day 7 and 9 post-feed, a total of 60 liver stages at 24 hpi and a total of 60 liver stages at 48 hpi assessed). For confocal z-stacks see also Supplementary Movies S4 and S5. For a time-lapse movie of sfGFP-PbSec 61β/PbPMP1-mCherry parasite liver stage development see also Supplementary Movie S6. Scale bars correspond to 10 µm, if not labelled differently.
Figure 7
Figure 7
Super-resolution STED microscopy of double-fluorescent sfGFP-PbSec61β/PbPMP1-mCherry liver stage parasites. HeLa cells were infected with sfGFP-PbSec61β/PbPMP1-mCherry parasites and fixed at 48 hpi. The sfGFP-PbSec61β (green) and the PbPMP1-mCherry (red) signals were enhanced by staining with specific antisera and parasites were analyzed by STED super-resolution microscopy. Scale bars = 10 µm.
Figure 8
Figure 8
Model of PPM development during formation of sporozoites and hepatic merozoites. The PPM is shown in black and the nuclei in blue. When nuclear division is about to complete, the PPM starts to form invaginations, which further expand into the cytoplasm. The newly formed membranes fuse to each other and undergo additional branching and nuclei align along these membranes. In a synchronous manner, membranes subsequently form around the individual nuclei to generate daughter parasites, involving further repeated invagination events in the case of hepatic merozoites.

Similar articles

Cited by

References

    1. World Health Organization. World Malaria Report (2016).
    1. De Niz, M. et al. Progress in imaging methods: insights gained into Plasmodium biology. Nat. Rev. Microbiol. 15, 37–54. (2016). - PubMed
    1. Ward GE, Miller LH, Dvorak JA. The origin of parasitophorous vacuole membrane lipids in malaria-infected erythrocytes. J. Cell Sci. 1993;106:237–248. - PubMed
    1. Stanway, R. R., Witt, T., Zobiak, B., Aepfelbacher, M. & Heussler, V. T. GFP-targeting allows visualization of the apicoplast throughout the life cycle of live malaria parasites. Biol. Cell101, 415–430, 5 p following 430 (2009). - PubMed
    1. Stanway, R. R. et al. Organelle segregation into Plasmodium liver stage merozoites. Cell. Microbiol.13, 1768–1782 (2011). - PubMed

Publication types

MeSH terms

Substances