. 2017 Aug 29;7(1):9702.
doi: 10.1038/s41598-017-09813-x.

Hypoxic Stress Decreases c-Myc Protein Stability in Cardiac Progenitor Cells Inducing Quiescence and Compromising Their Proliferative and Vasculogenic Potential

Affiliations

Hypoxic Stress Decreases c-Myc Protein Stability in Cardiac Progenitor Cells Inducing Quiescence and Compromising Their Proliferative and Vasculogenic Potential

Michael A Bellio et al. Sci Rep. .

Abstract

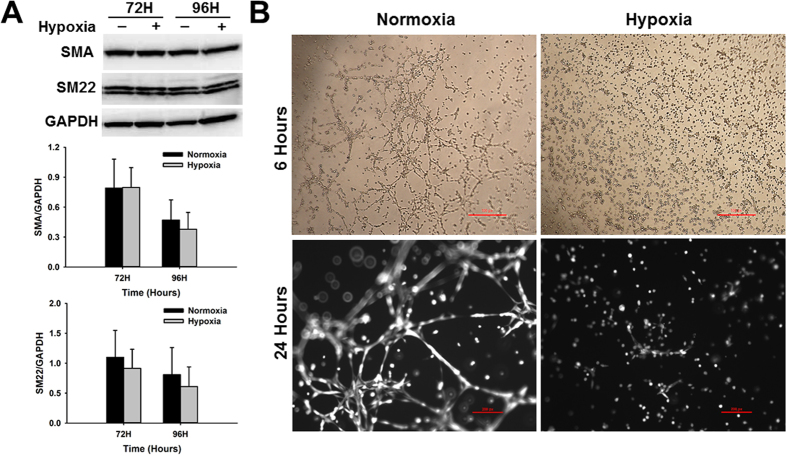
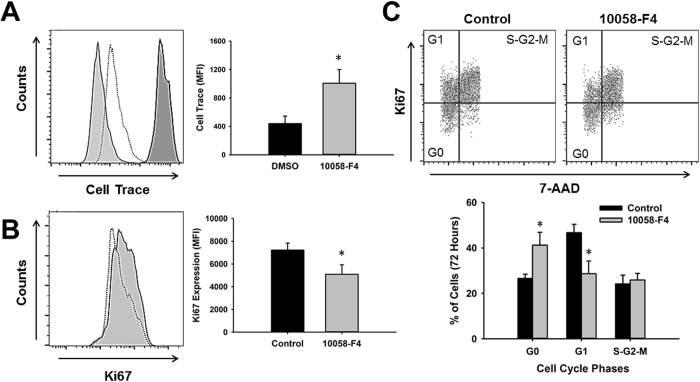
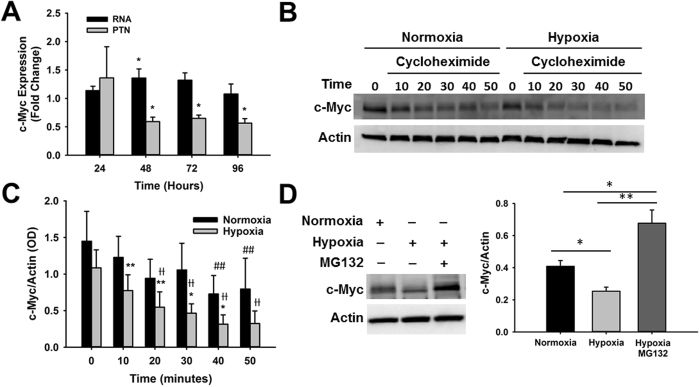
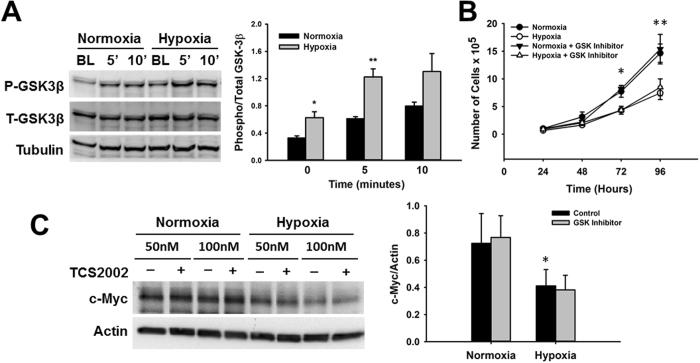
Cardiac progenitor cells (CPCs) have been shown to promote cardiac regeneration and improve heart function. However, evidence suggests that their regenerative capacity may be limited in conditions of severe hypoxia. Elucidating the mechanisms involved in CPC protection against hypoxic stress is essential to maximize their cardioprotective and therapeutic potential. We investigated the effects of hypoxic stress on CPCs and found significant reduction in proliferation and impairment of vasculogenesis, which were associated with induction of quiescence, as indicated by accumulation of cells in the G0-phase of the cell cycle and growth recovery when cells were returned to normoxia. Induction of quiescence was associated with a decrease in the expression of c-Myc through mechanisms involving protein degradation and upregulation of p21. Inhibition of c-Myc mimicked the effects of severe hypoxia on CPC proliferation, also triggering quiescence. Surprisingly, these effects did not involve changes in p21 expression, indicating that other hypoxia-activated factors may induce p21 in CPCs. Our results suggest that hypoxic stress compromises CPC function by inducing quiescence in part through downregulation of c-Myc. In addition, we found that c-Myc is required to preserve CPC growth, suggesting that modulation of pathways downstream of it may re-activate CPC regenerative potential under ischemic conditions.


Conflict of interest statement

Dr. Hare has a patent for cardiac cell-based therapy; he holds equity in Vestion Inc.; maintains a professional relationship with Vestion as a consultant and member of the Board of Directors and Scientific Advisory Board; and is a shareholder in Longeveron LLC. The other authors declare that they have no competing interests.

Figures

Figure 1
Figure 1
Hypoxic stress reduces cardiac progenitor cell proliferation. (A) Time-course analysis of CPC growth represented by number of cells (top panel) and population doubling (lower panel) under normoxia (closed circles) and hypoxia (open circles) over a total period of 96 hours (n = 7, *p < 0.05). (B) Quantitative analysis of Ki67 positive cells after exposure of CPCs to hypoxia by fluorescence activated cell sorting. Representative images under normoxia and hypoxia from 48–96 hours are shown. Graph indicates the average percentage of Ki67 positive cells under normoxia (black bars) and hypoxia (gray bars) at different time points (n = 3, *p < 0.05, ** < 0.005).
Figure 2
Figure 2
Hypoxia exposure does not induce cardiac progenitor cell death or senescence. (A) Representative images of CPCs stained with the live/dead dyes calcein AM (green) and ethidium homodimer-1 (red) under normoxia and hypoxia at 24 and 72 hours (n = 3, 10X magnification). A positive control was generated by treatment of CPCs with 200 µM hydrogen peroxide (H2O2) during the same time-frame and bright field images are shown for analysis of morphological changes after hypoxia and hydrogen peroxide treatments relative to control. (B) Detection of lactate dehydrogenase activity in supernatants of CPCs cultured under normoxia (black bars) and hypoxia (gray bars) at 24 and 72 hours (n = 6, *p < 0.05, **p < 0.005). (C) Detection of senescence associated-β-galactosidase activity in cell lysates of CPCs cultured under normoxia (black bars) and hypoxia (gray bars) for 72 hours (n = 5).
Figure 3
Figure 3
Hypoxic stress does not induce cardiac progenitor cell differentiation but impairs vasculogenic potential. (A) Representative western blot images showing the expression of smooth muscle markers in CPCs at 72 and 96 hours under normoxia (black bars) and hypoxia (gray bars). Graphs represent the expression of differentiation markers determined by densitometry analysis of all blots normalized to Gapdh endogenous control (n = 5). (B) Representative images of normoxia and hypoxia-treated CPCs at 6 hours (top panels, 4X magnification) and 24 hours (lower panel, 10X magnification) after culturing on Matrigel (n = 5). Cells in 24 hour-time point images were stained with calcein-AM to indicate that they were alive by the end of the study.
Figure 4
Figure 4
Hypoxic stress leads to cardiac progenitor cell quiescence and a decrease in the expression of c-Myc. (A) Time-course analysis of CPCs cell cycle progression under normoxia and hypoxia. Dot Plots show representative images of cells stained with 7-AAD and Ki67 and analyzed at 48 (top panel), 72 (middle panel) and 96 (lower panel)-hours. Graphs indicate the average percentage of cells in each phase of the cell cycle per time point under normoxia (black bars) and hypoxia (gray bars) (n = 3, *p < 0.05, **p < 0.005). (B) Time-course analysis of CPC growth represented by population doublings under normoxia (closed circle), hypoxia (open circles) and hypoxia followed by normoxia (reoxygenation, closed triangles) (n = 7, **p < 0.005 Hypoxia vs Normoxia, *p < 0.05 Reoxygenation vs Normoxia, #p < 0.05 Reoxygenation vs Hypoxia). (C) Representative western blot image showing decrease in c-Myc protein expression at 48 hours. Graph represents c-Myc expression determined by densitometry analysis of all blots normalized to Actin endogenous control (n = 4, *p < 0.05).
Figure 5
Figure 5
Inhibition of c-Myc decreases cardiac progenitor cell proliferation and induces quiescence. (A) Representative histogram showing CPC proliferation analysis by CellTrace dye dilution 72 hours after treatment with the c-Myc inhibitor 10058-F4 (dotted line) and DMSO control (solid line, light gray) compared to baseline (solid line, dark gray). Graph indicates the CellTrace mean fluorescence intensity showing less dye dilution in samples treated with the c-Myc inhibitor relative to DMSO control, an indication of delayed growth (n = 4, *p < 0.03). (B) Quantification of Ki67 expression 72 hours after treatment of CPCs with c-Myc inhibitor and DMSO control by fluorescence activated cell sorting. Graph indicates the average of Ki67 mean fluorescence intensity (MFI) in control (black bars) and c-Myc inhibitor-treated CPCs (gray bars) (n = 4, *p < 0.03). (C) Cell cycle analysis of CPCs after c-Myc inhibition. Dot Plots show representative images of cells stained with 7-AAD and Ki67 and analyzed 72 hours later. Graph indicates the average percentage of cells in each phase of the cell cycle in DMSO control (black bars) and c-Myc inhibitor treated CPCs (gray bars) (n = 4, *p < 0.05).
Figure 6
Figure 6
Hypoxic stress and c-Myc inhibition differentially affect the expression of the cell cycle inhibitor p21. (A) Representative western blot image showing induction of p21 in CPCs exposed to hypoxia relative to normoxia. Graph represents p21 expression determined by densitometry analysis of all blots normalized to Actin endogenous control (n = 5, **p < 0.006). (B) Real-time PCR analysis of p21 expression in CPCs treated with c-Myc inhibitor 10058-F4 for 24 hours relative to DMSO control (n = 5, *p < 0.03). (C) Representative western blot image showing the effect of c-Myc inhibition on c-Myc and p21 expression. Graph represents c-Myc and p21 expression determined by densitometry analysis of all blots normalized to Actin endogenous control (n = 4, *p < 0.03).
Figure 7
Figure 7
Hypoxic stress accelerates c-Myc protein degradation in cardiac progenitor cells. (A) Time-course analysis of c-Myc RNA (black bars) and protein (gray bars) expression under hypoxia relative to normoxia (n = 4–7, *p < 0.05). (B) Representative western blot image showing c-Myc protein degradation after translation blockage in CPCs cultured under normoxia and hypoxia for 48 hours. (C) Time-course analysis of c-Myc expression after protein synthesis blockage under normoxia (black bars) and hypoxia (gray bars) (n = 4–12, *p < 0.05, **p < 0.006, #p < 0.005, Ɨp < 0.001). (D) Representative western blot image showing the effect of the proteasome inhibitor MG132 on c-Myc expression under hypoxia (n = 4, *p < 0.05, **p < 0.005). Graphs in C and D represent c-Myc expression determined by densitometry analysis of all blots normalized to Actin endogenous control. For statistical purposes, c-Myc expression was compared between groups for each time point (*) and between time points for each experimental group, normoxia control (#) and hypoxia (Ɨ).
Figure 8
Figure 8
Expression of GSK-3β under hypoxia and effect on c-Myc expression. (A) Representative western blot image showing increased expression of inhibited GSK-3β (Ser9) under hypoxia (gray bars) relative to normoxia (black bars), after short stimulation with culture media. Graph represents Phospho/Total GSK-3β expression determined by densitometry analysis of all blots (n = 4, *p < 0.05, **p < 0.007). (B) Effect of GSK-3β inhibition by TCS2002 on CPCs proliferation under normoxia and hypoxia (n = 4, *p < 0.05, **p < 0.001). (C) Effect of GSK-3β inhibition by TCS2002 (gray bars) on c-Myc expression in CPCs cultured under normoxia and hypoxia relative to vehicle control (black bars). Inhibitor was tested at 50 and 100 nM. Graph represents c-Myc expression determined by densitometry analysis of all blots normalized to Actin endogenous control (n = 4, *p < 0.05).

Similar articles

Cited by

References

    1. Felker GM, et al. Risk stratification after hospitalization for decompensated heart failure. J Card Fail. 2004;10:460–466. doi: 10.1016/j.cardfail.2004.02.011. - DOI - PubMed
    1. Lloyd-Jones, D. et al. and the American Heart Association Statistics Committee and Stroke Statistics Subcommittee. Heart Disease and Stroke Statistics 2009 Update: A Report From the American Heart Association Statistics Committee and Stroke Statistics Subcommittee. Circulation119, e21–e181 (2009). - PubMed
    1. Hare JM. Translational development of mesenchymal stem cell therapy for cardiovascular diseases. Texas Heart Inst. J. 2009;36:145–147. - PMC - PubMed
    1. Hare JMaCSV. Cardiac regeneration and stem cell therapy. Curr. Opin. Organ Transplant. 2008;13:536–542. doi: 10.1097/MOT.0b013e32830fdfc4. - DOI - PMC - PubMed
    1. Guntheroth WG. Improved outcomes of pediatric dilated cardiomyopathy and heart transplantation. J Am Coll Cardiol. 2005;45:1733–1734. doi: 10.1016/j.jacc.2005.02.045. - DOI - PubMed

Publication types

Substances

LinkOut - more resources