. 2017 Aug 29;7(1):9605.
doi: 10.1038/s41598-017-09867-x.

Tcf7l2 plays pleiotropic roles in the control of glucose homeostasis, pancreas morphology, vascularization and regeneration

Affiliations

Tcf7l2 plays pleiotropic roles in the control of glucose homeostasis, pancreas morphology, vascularization and regeneration

Nicola Facchinello et al. Sci Rep. .

Abstract

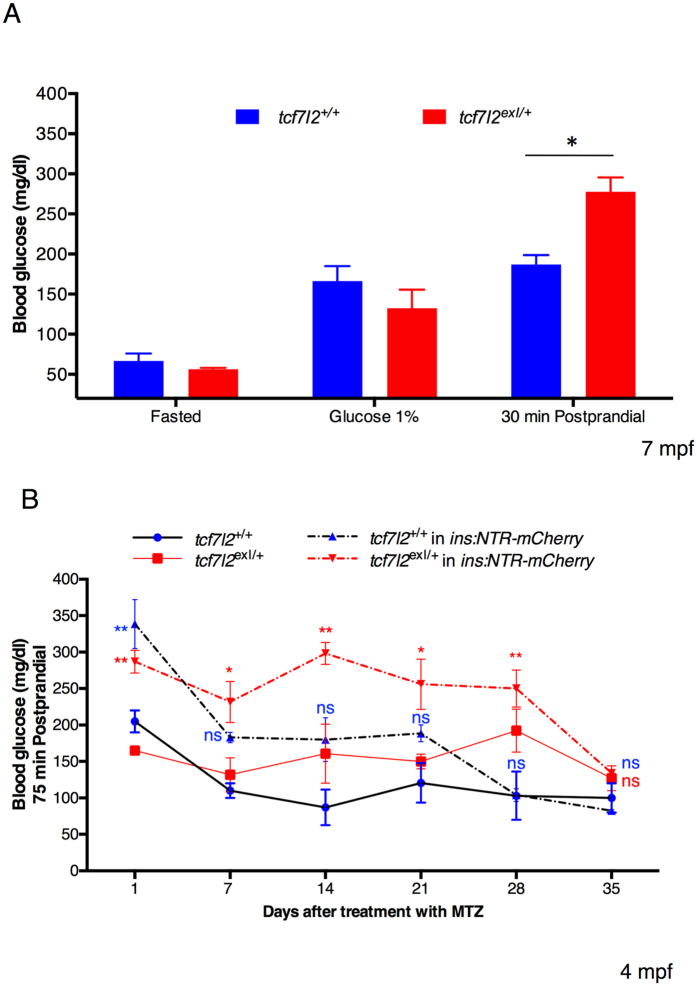
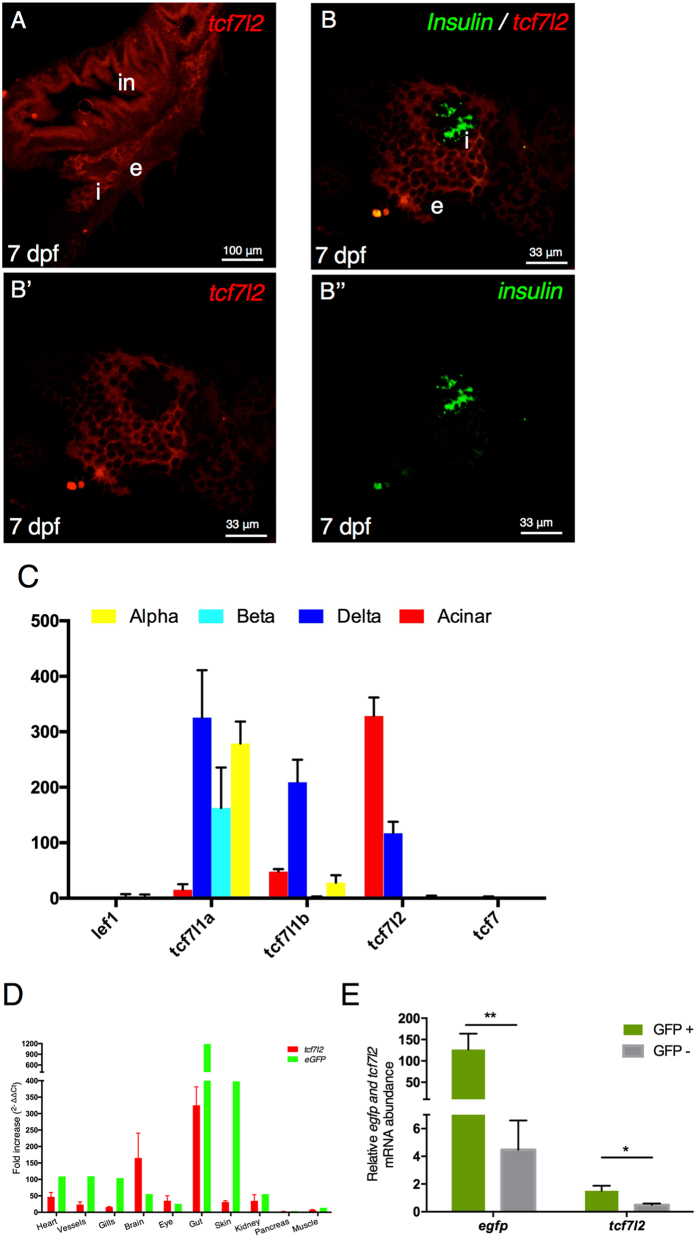
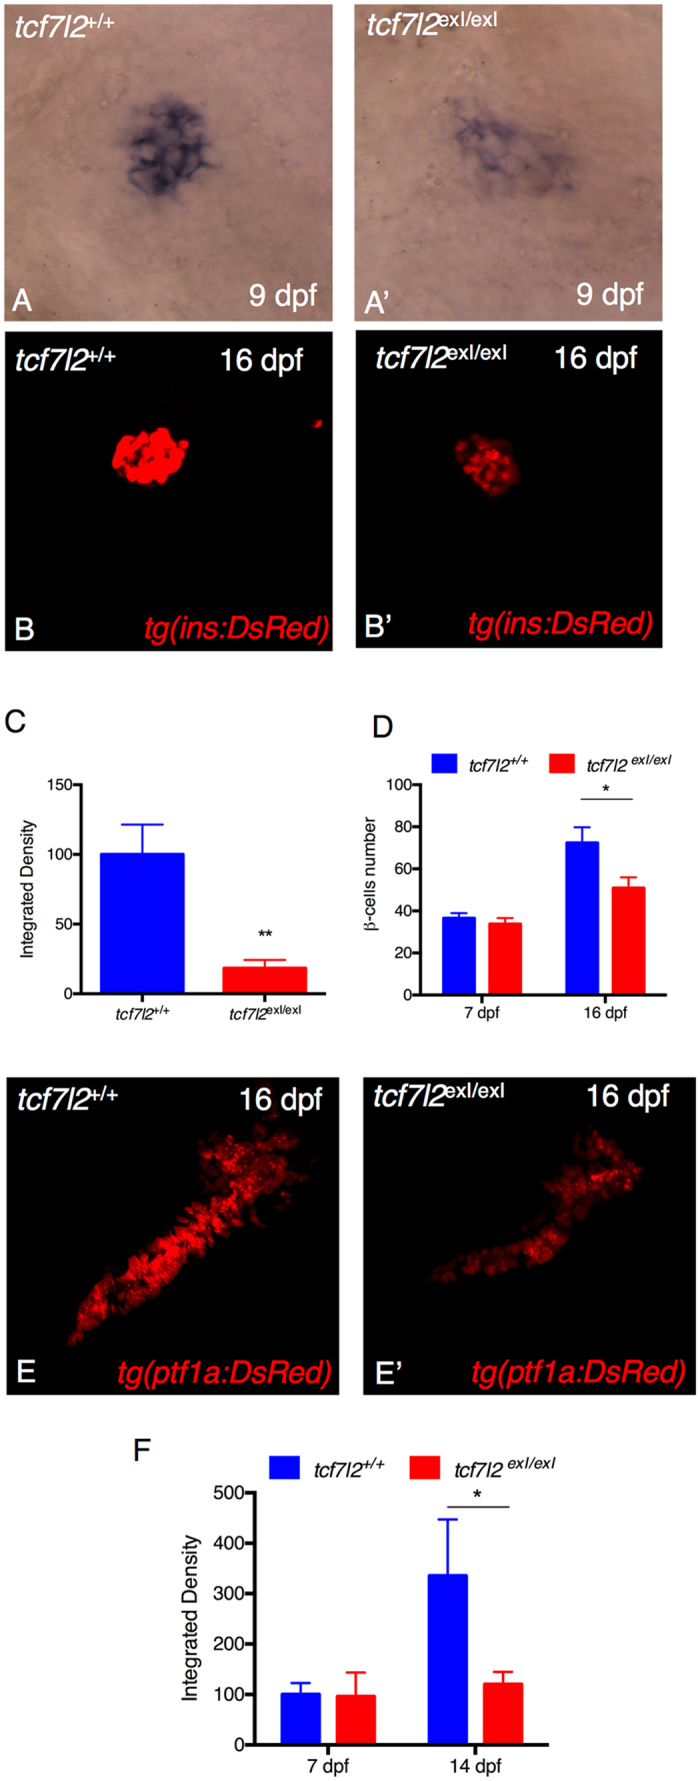
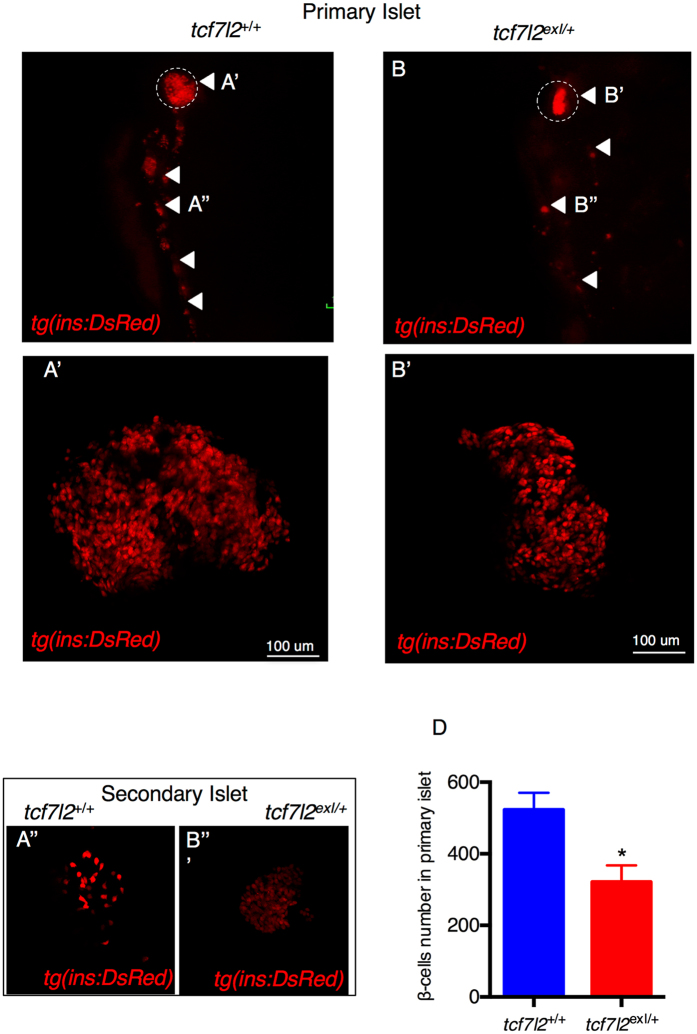
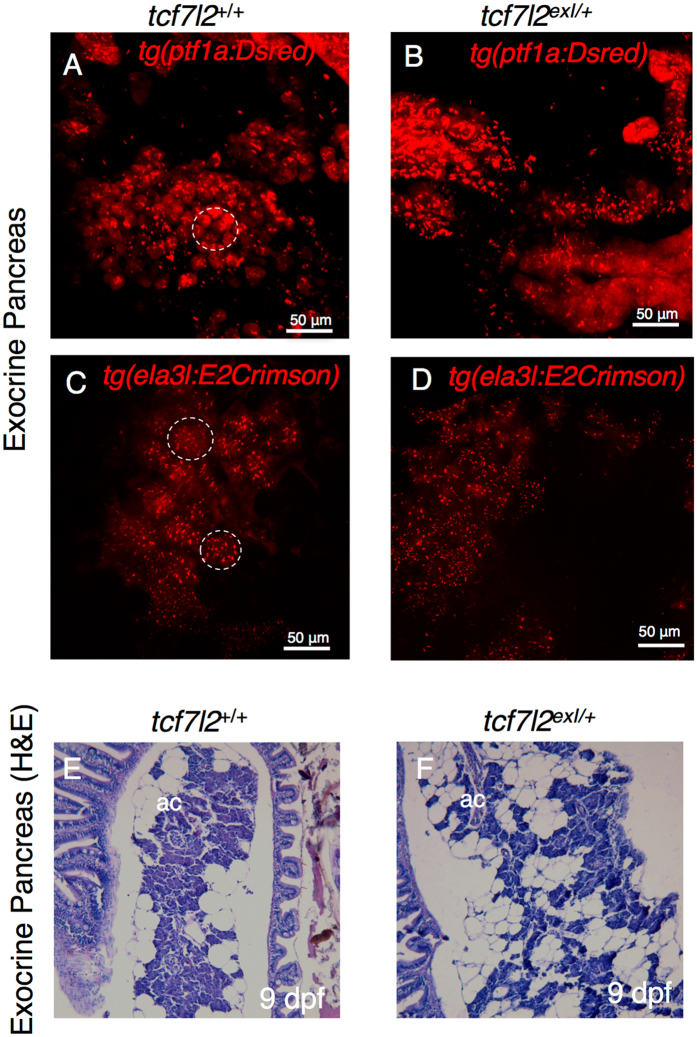
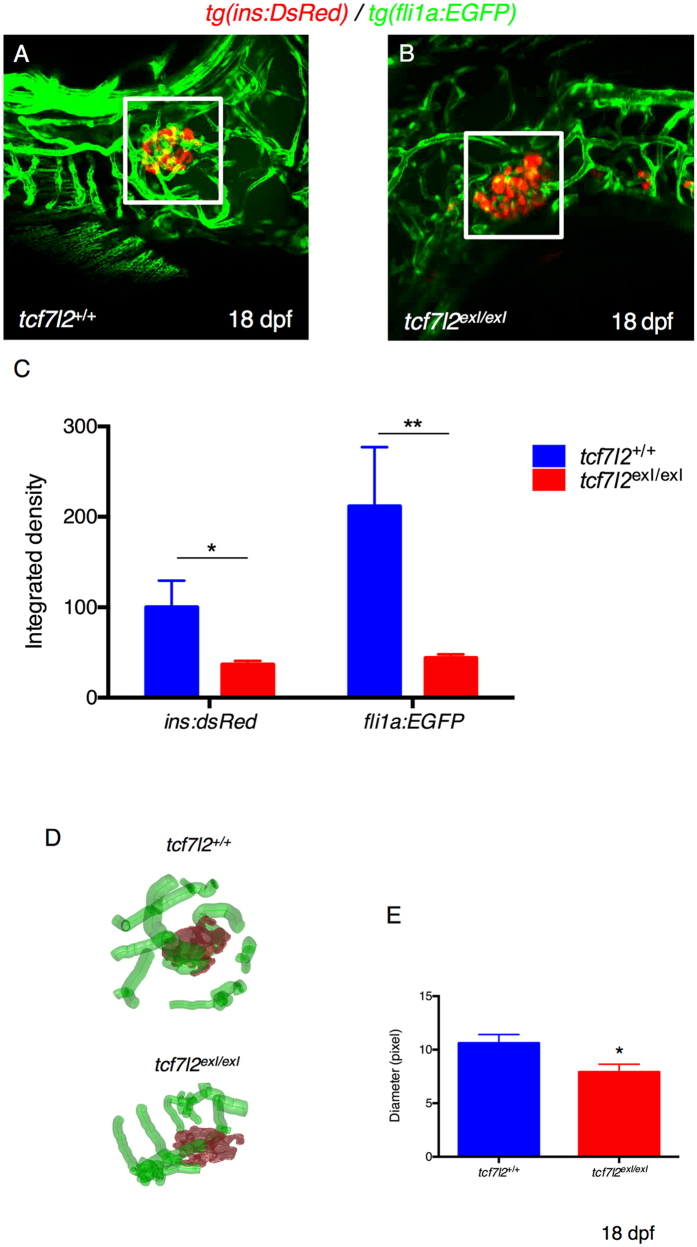
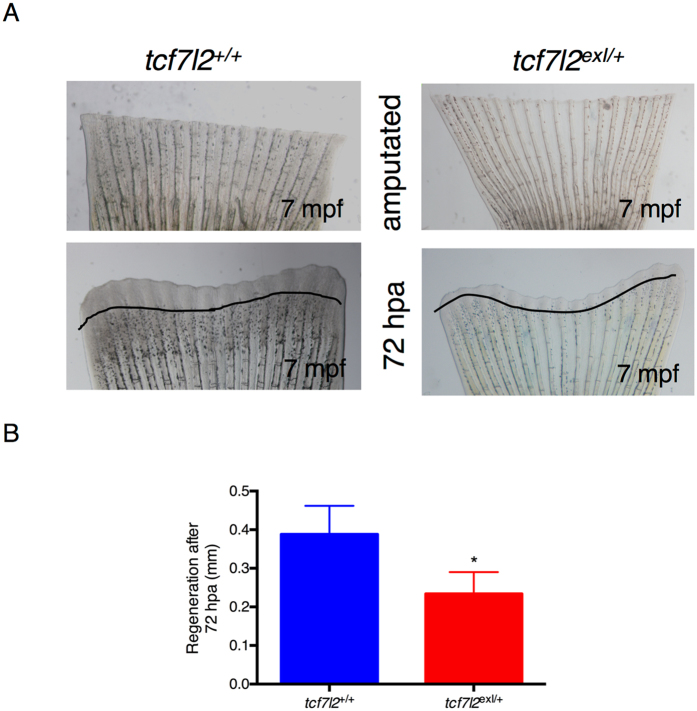
Type 2 diabetes (T2D) is a disease characterized by impaired insulin secretion. The Wnt signaling transcription factor Tcf7l2 is to date the T2D-associated gene with the largest effect on disease susceptibility. However, the mechanisms by which TCF7L2 variants affect insulin release from β-cells are not yet fully understood. By taking advantage of a tcf7l2 zebrafish mutant line, we first show that these animals are characterized by hyperglycemia and impaired islet development. Moreover, we demonstrate that the zebrafish tcf7l2 gene is highly expressed in the exocrine pancreas, suggesting potential bystander effects on β-cell growth, differentiation and regeneration. Finally, we describe a peculiar vascular phenotype in tcf7l2 mutant larvae, characterized by significant reduction in the average number and diameter of pancreatic islet capillaries. Overall, the zebrafish Tcf7l2 mutant, characterized by hyperglycemia, pancreatic and vascular defects, and reduced regeneration proves to be a suitable model to study the mechanism of action and the pleiotropic effects of Tcf7l2, the most relevant T2D GWAS hit in human populations.


Conflict of interest statement

The authors declare that they have no competing interests.

Figures

Figure 1
Figure 1
Postprandial increase of blood glucose in heterozygous tcf7l2 exI/+ adults. Blood glucose levels in wild type and tcf7l2 exI/+ adult fish (7 mpf) under different dietary conditions (Fasted, 1% Glucose and 1 h Postprandial). Data were obtained from five fishes per genotype, repeated in 2 different experiments. Average values are given for each sample and standard errors of the mean are indicated; *p < 0.05. (B) Blood glucose levels after 75 minute postprandial in wild type and tcf7l2 exI/+ adult fish (4 mpf), monitored during recovery after MTZ treatment. Values represent the mean ± SEM. Red asterisks indicate that blood glucose levels of tcf7l2 exI/+ mutants in ins:NTR-mCherry transgenic background are significantly different from tcf7l2 +/+ controls; **p < 0.01 and *p < 0.05; n = 5 individuals per genotype. Blue “ns” (not significant) indicates no statistical difference between tcf7l2 +/+ in ins:NTR-mCherry transgenic background and tcf7l2 +/+ controls at 7, 14, 21, 28 and 35 days after treatment with MTZ.
Figure 2
Figure 2
Canonical Wnt signalling and tcf7l2 expression in the pancreas. (A,B) Single and double fluorescent WISH comparing the expression of tcf7l2 and insulin at 7 dpf. Images show confocal single planes at 7 dpf at different magnification of (A) (20x) and (B,B’,B”) (60x). Merging the green and red channels identifies regions with distinct gene expression of the two genes (B’,B”). in: intestine, e: exocrine tissues, i: principal islet. Scale bar = 100 μm. (C) Expression level (count normalized by library size) obtained by RNAseq of different Tcf/Lef genes in α, β, δ and acinar cells from adult zebrafish. (D) tcf7l2 and egfp expression values from 10 different tissues derived from transgenic Tg(fli1a:EGFP)y1 adult fish. Brain (Br), Eye (Ey), Gills (Gi), Gut (Gu), Heart (He), Kidney (Ki), Muscle (Mu), Pancreas (Pa), Vessels (Ve). (E) Enrichment of GFP+ cells from Tg(fli1a:EGFP)y1 zebrafish embryos. Relative expression of indicated genes, in GFP+ (green bars) and GFP (grey bars) cells, determined by quantitative RT-PCR. Relative expression levels were determined by normalization to arp. Values represent the mean ± SEM. Asterisk above column indicate statistical differences among groups.
Figure 3
Figure 3
tcf7l2 is required for regulation of insulin expression and exocrine pancreas development. Analysis of insulin in control embryos (A) and in tcf7l2 exI/exI mutants (A’) by in situ hybridization. Lateral views of the pancreatic area are shown with the anterior side to the right. The expression of insulin is significantly reduced in the mutants. (B–B”) Analysis of pancreatic islet in tcf7l2 exI/exI mutant in Tg(ins:dsRed) background. 2D projections of confocal Z-series images of DsRed expression in living Tg(ins:DsRed) embryos at 16 dpf. (B) wt; (B’) homozygous mutant. (C) Graphic presentation of the integrated density of fluorescence in the red channel in tcf7l2 exI/exI mutant and wild-type sib controls in Tg(ins:dsRed) at 16 dpf. (D) Quantification of the number of β cells during juvenile growth of tcf7l2 exI/exI and control siblings. (E–E’) Analysis of exocrine pancreas in tcf7l2 exI/exI mutant in Tg(ptf1a:dsRed), (E) wt and (E’) mutant at 16 dpf. (F) Graphic presentation of the integrated density of fluorescence in the red channel in tcf7l2 exI/exI mutant and wild-type sib controls in Tg(ela3l:Crimson) at 7 and 14 dpf. Data were obtained from 6 individuals per genotype, repeated in 2 different experiments. All reference to phenotypes was confirmed by genotyping. The integrated density was obtained using the Fiji software. Values represent the mean ± SEM. Asterisk above column indicate statistical differences among groups *p < 0.05.
Figure 4
Figure 4
Morphology of β cells in wt and tcf7l2 exI/+ heterozygous adults. (A,B) Whole gut tissue extracted from 9 month-old wt and tcf7l2 exI/+ fish in Tg(ins:dsRed) background. Dashed circle: primary islet. Arrowheads: secondary islets and individual β cells extending caudally along the intestine. Examples of projection of a confocal stack image (A’,B’) of primary islets and secondary islet (A”,B”). (C) Quantification of β cells in 9 months old fish. Data were obtained from 3 individuals per genotype, repeated in 2 different experiments.
Figure 5
Figure 5
Morphology of exocrine pancreas in wt and tcf7l2 exI/+ heterozygous adults. (A,B) Projection of a confocal stack image of exocrine pancreas extracted from 9-month-old wt and tcf7l2 exI/+ fish in Tg(ptf1a:DsRed) background. (C,D) Projection of a confocal stack image of exocrine pancreas extracted from 6-month-old wt and tcf7l2 exI/+ fish in Tg(ela3l:Crimson) background. Dashed circles indicate typical acinar structures. Scale bar = 50 μm. (E,F) H&E staining of acinar cells (ac) of wt (E) and tcf7l2 exI/+ (F) at 9 mpf.
Figure 6
Figure 6
Defects in vascular endothelium and pancreas development of tcf7l2 exI/exI homozygous larvae. (A,B) Analysis of pancreatic islet and blood vessels inside and around the pancreas of tcf7l2 mutants and wild-type sib controls in Tg(fli1a:EGFP/ins:DsRed) background. Representative images were taken at 18 dpf by confocal microscopy at 20x magnification. (C) Graphic presentation of the integrated density of fluorescence in the red and green channel in tcf7l2 exI/exI mutant and wild-type sib controls at 18 dpf. The regions for the analysis of integrated density of fluorescence are indicated by white boxes. Data were obtained using Fiji software. (D) Analysis and graphic presentation of vessels diameter; the mutant is characterized by decreased vessel diameter. Data were obtained from five individuals per genotype. All reference to phenotypes was confirmed by genotyping; *p < 0.05.
Figure 7
Figure 7
Heterozygous tcf7l2 exI/+ adults have a reduced rate of caudal fin regeneration. (A) Bright field live images of unamputated and regenerating fins in wild type and tcf7l2 exI/+ after 72 hours post-amputation. The area of regeneration was determined and the original cut line was used to normalize fin size differences. (B) Graphic presentation of the regeneration rate in controls and tcf7l2 exI/+ mutant fish. Data were obtained from six fishes per genotype, repeated in 3 different experiments.

Similar articles

Cited by

References

    1. Grant SF, et al. Variant of transcription factor 7-like 2 (TCF7L2) gene confers risk of type 2 diabetes. Nat Genet. 2006;38:320–323. doi: 10.1038/ng1732. - DOI - PubMed
    1. Rulifson IC, et al. Wnt signaling regulates pancreatic beta cell proliferation. Proc Natl Acad Sci USA. 2007;104:6247–6252. doi: 10.1073/pnas.0701509104. - DOI - PMC - PubMed
    1. Columbus J, et al. Insulin treatment and high-fat diet feeding reduces the expression of three Tcf genes in rodent pancreas. J Endocrinol. 2010;207:77–86. doi: 10.1677/JOE-10-0044. - DOI - PubMed
    1. Florez JC, et al. TCF7L2 polymorphisms and progression to diabetes in the Diabetes Prevention Program. N Engl J Med. 2006;355:241–250. doi: 10.1056/NEJMoa062418. - DOI - PMC - PubMed
    1. Lyssenko V, et al. Mechanisms by which common variants in the TCF7L2 gene increase risk of type 2 diabetes. J Clin Invest. 2007;117:2155–2163. doi: 10.1172/JCI30706. - DOI - PMC - PubMed

Publication types