. 2017 Aug 29;7(1):9674.
doi: 10.1038/s41598-017-10013-w.

Ape1 guides DNA repair pathway choice that is associated with drug tolerance in glioblastoma

Affiliations

Ape1 guides DNA repair pathway choice that is associated with drug tolerance in glioblastoma

Thomas Ströbel et al. Sci Rep. .

Abstract

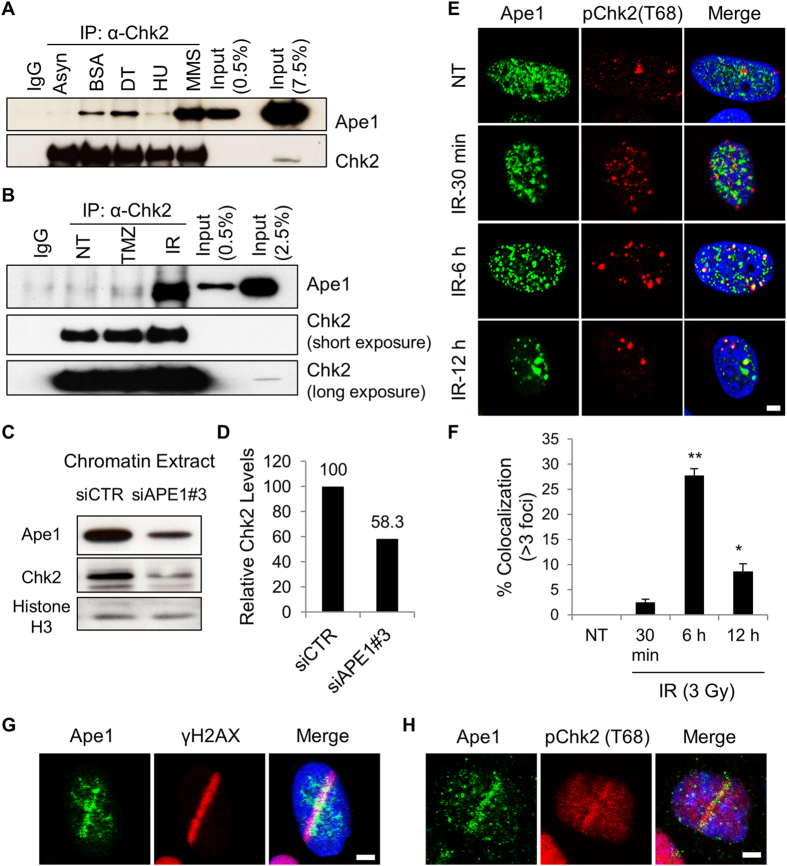
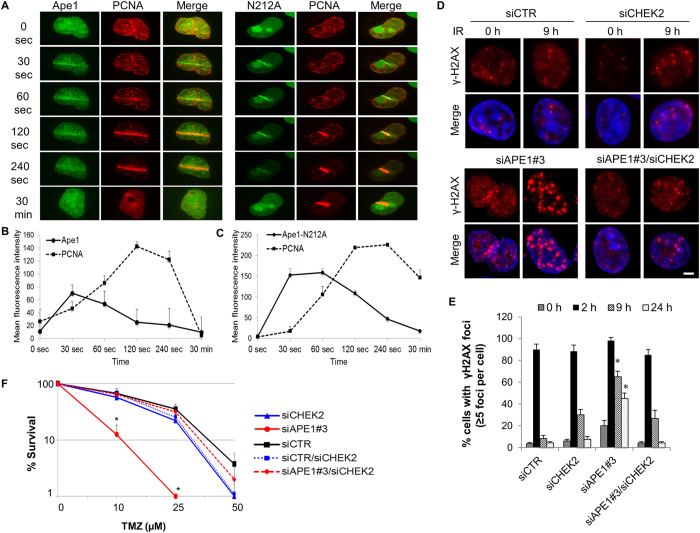
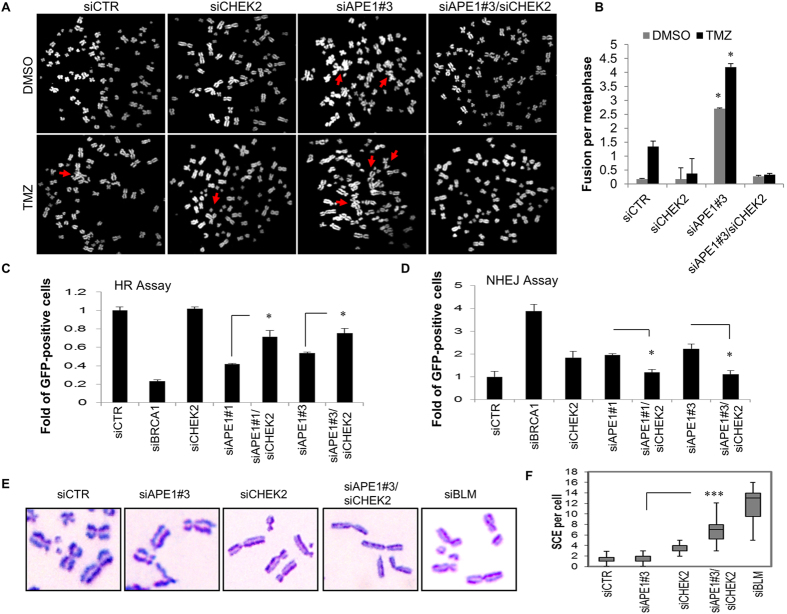
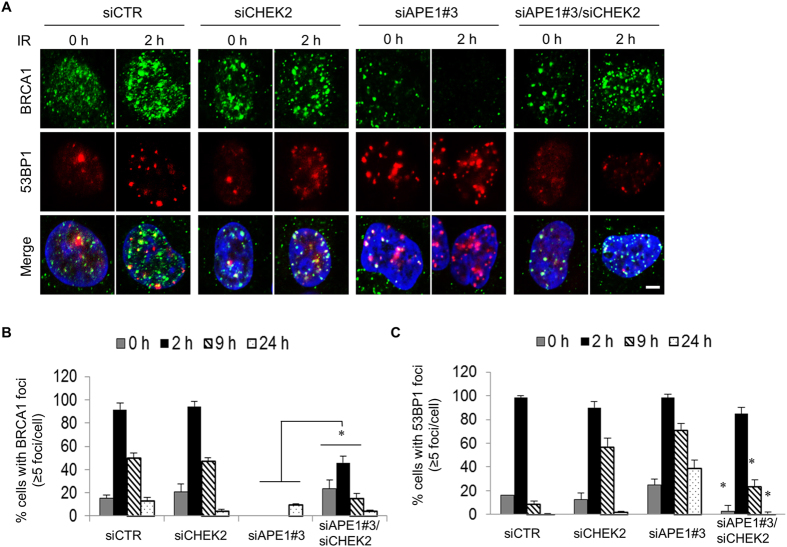
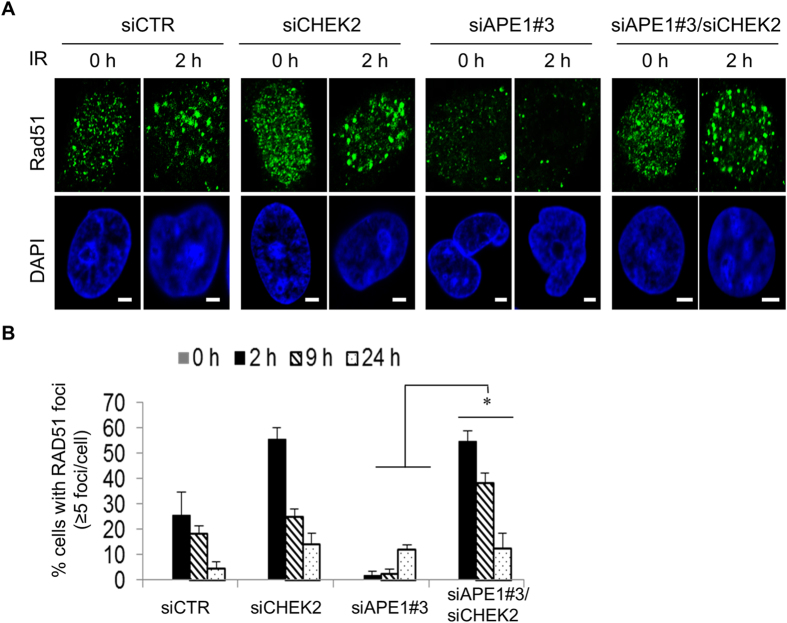
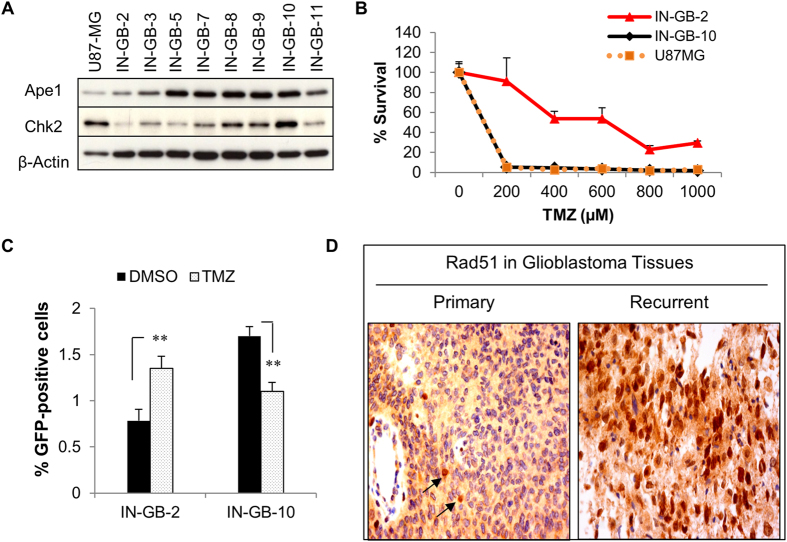
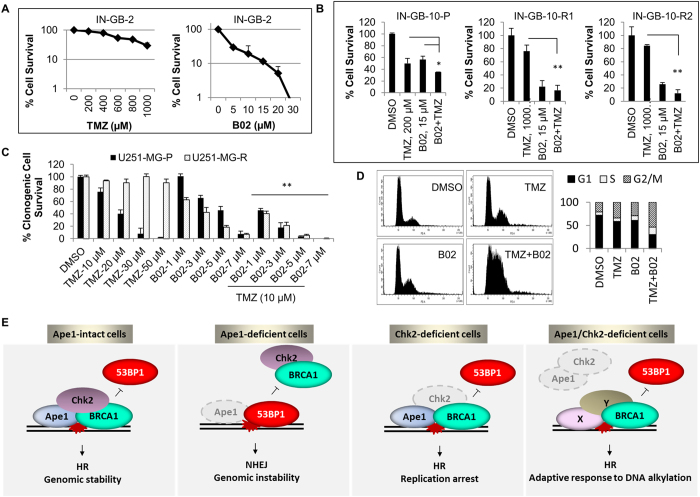
Ape1 is the major apurinic/apyrimidinic (AP) endonuclease activity in mammalian cells, and a key factor in base-excision repair of DNA. High expression or aberrant subcellular distribution of Ape1 has been detected in many cancer types, correlated with drug response, tumor prognosis, or patient survival. Here we present evidence that Ape1 facilitates BRCA1-mediated homologous recombination repair (HR), while counteracting error-prone non-homologous end joining of DNA double-strand breaks. Furthermore, Ape1, coordinated with checkpoint kinase Chk2, regulates drug response of glioblastoma cells. Suppression of Ape1/Chk2 signaling in glioblastoma cells facilitates alternative means of damage site recruitment of HR proteins as part of a genomic defense system. Through targeting "HR-addicted" temozolomide-resistant glioblastoma cells via a chemical inhibitor of Rad51, we demonstrated that targeting HR is a promising strategy for glioblastoma therapy. Our study uncovers a critical role for Ape1 in DNA repair pathway choice, and provides a mechanistic understanding of DNA repair-supported chemoresistance in glioblastoma cells.


Conflict of interest statement

The authors declare that they have no competing interests.

Figures

Figure 1
Figure 1
Ape1 is recruited to sites of double-strand breaks of DNA, and cooperates with Chk2. (A) HEK293 cells were treated with BSA (0.5%; 24 h), double thymidine (DT, 2 mM), hydroxyurea (HU, 2 mM; 16 h), or methyl methane sulphonate (MMS, 250 µM; 4 h). MMS treated cells were washed and incubated for another 16 h. Asynchronized cells were left untreated. Cells were then harvested, and subjected to IP. (B) HEK293 cells were either left non-treated (NT), exposed to temozolomide (TMZ, 250 µM, 4 h) or ionizing radiation (IR, 3 Gy). TMZ-treated cells were washed and incubated for another 4 h prior to the harvest. IR-treated cells were harvested 6 h after the IR exposure. Cells were then subjected to IP, followed by immunoblotting for Ape1 and Chk2 proteins. (C) Chromatin fractions were isolated after 72 h of siRNA transfections, and subjected to Western blot. (D) Quantification of relative Chk2 signal at chromatin is shown. (E) U2OS cells were exposed to IR (3 Gy), fixed and stained with the indicated antibodies. Representative images are shown. Scale bar, 5 µm. (F) At least 100 cells per experiment were counted, and cells with at least three colocalizing foci were quantified. Standard deviations were calculated from three independent experiments. **p < 0.001 (IR, 30 min vs. IR, 6 h), *p < 0.02 (IR, 30 min vs. IR, 12 h); Student’s t test (G) U2OS cells were micro-irradiated, fixed after 2 min of laser incision, and stained with Ape1 and γH2AX antibodies. A representative image is presented from at least three independent micro-irradiation experiments. Scale bar, 5 µm. (H) U2OS cells were micro-irradiated, fixed, and stained with Ape1 and phospho-Chk2 (Thr 68). A representative image is presented from at least three independent micro-irradiation experiments. Scale bar, 5 µm.
Figure 2
Figure 2
Ape1 depletion results in DNA damage accumulation, and that is counteracted by concomitant depletion of Chk2 in glioblastoma cells. (A) U251-MG cells were exposed to laser micro-irradiation, and green (Ape1) and red (PCNA) fluorescence were live-imaged for 30 min. At least three independent irradiations were performed for each cell type. Representative images are shown. (B) Time-dependent damage site recruitments of Ape1, (C) Ape1-N212 A, and PCNA were determined as described in Methods. (D) U251-MG cells were exposed to IR (3 Gy) at 48 h of siRNA transfection. Cells were fixed at the indicated time points, and immunostained for γH2AX. Representative images are shown. Scale bar, 5 µm. (E) At least 100 cells per sample were counted from each experiment, and cells showing more than five γH2AX foci were quantified. Error bars indicate standard deviations obtained from three independent experiments. *p < 0.01 (siAPE1#3 vs. siAPE1#3/siCHEK2); Student’s t test. (F) U251-MG cells were transfected with the indicated siRNAs, and colony formation assay was performed after TMZ exposure. Data were obtained from three independent experiments. Error bars indicate standard deviation. *p < 0.05 (siAPE1#3 vs. siAPE1#3/siCHEK2); Student’s t test.
Figure 3
Figure 3
Dual suppression of Ape1 and Chk2 facilitates HR. (A) U251-MG cells were transfected with the indicated siRNAs, and treated with TMZ (1000 µM, 1 h) at 48 h of transfection. Metaphase chromosomes were prepared 24 h after exposure to TMZ, and labelled with DAPI. Representative metaphases are shown. Red arrows indicate chromosome fusions. (B) At least 50 metaphases per sample were counted, and standard deviations were calculated from three independent experiments. *p < 0.001 (siAPE1#3 vs. siAPE1#3/siCHEK2); Student’s t test. (C) U2OS-DR cells were transfected with the indicated siRNAs and a plasmid expressing I-Sce I. Percentage of GFP-positive cells was quantified by flow cytometry. Percentage of values scored in the control cells (siCTR) was normalized to 1. Data were obtained from three independent experiments. *p < 0.05; Student’s t test. (D) H1299dA3-1 cells were transfected with the indicated siRNAs and an I-Sce I vector. Percentage of GFP-positive cells was calculated as described in (C). Data from three independent experiments are shown. *p < 0.05; Student’s t test. (E) U2OS cells were transfected with the indicated siRNAs, and incubated with BrdU (10 µM) for 24 h. After the treatment with MMS (350 µM) for 3 h, metaphase chromosomes were stained with Giemsa. Representative images are shown. (F) At least thirty metaphase cells per sample were analyzed, and medians of the number of chromosomes with SCE were presented in a box plot chart. ***p < 0.0001; (siAPE1#3 vs. siAPE1#3/siCHEK2); Student’s t test.
Figure 4
Figure 4
Impaired recruitment of BRCA1 to damage sites in Ape1-depleted cells, and its restoration by simultaneous depletion of Chk2. (A) U251-MG cells treated with the indicated siRNAs were exposed to IR (3 Gy), fixed at the indicated time points, and immunostained for BRCA1 and 53BP1. Scale bar, 5 µm. Cells with more than five BRCA1 (B) or 53BP1 foci (C) were quantified by counting at least 100 cells per sample. Error bars indicate standard deviations obtained from at least three independent experiments. *p < 0.01;Student’s t test.
Figure 5
Figure 5
Impaired recruitment of Rad51 to damage sites in Ape1-depleted cells, and its restoration by simultaneous depletion of Chk2. (A) siRNA-treated U251-MG cells were exposed to IR (3 Gy), fixed at the indicated time points, and immunostained for Rad51. Scale bars, 5 µm. (B) Rad51 foci were quantified as described in Fig. 4. *p < 0.05; (siAPE1#3 vs. siAPE1#3/siCHEK2); Student’s t test.
Figure 6
Figure 6
Glioblastoma resistance to TMZ is associated with HR activity that is regulated by cooperation of Ape1 and Chk2. (A) Western blot analyses of patient-derived early passage glioblastoma cells for Ape1, Chk2, and β-Actin. U87-MG served as internal control. (B) Patient-derived cells were treated with the indicated concentrations of TMZ for 1 h, and incubated for 10 days following extensive washing. Cells were counted, and percentage of survivals was calculated. (C) IN-GB-2 and IN-GB-10 cells were transfected with DR-GFP reporter gene and an I-Sce I plasmid. After 48 h, cells were treated with TMZ (1000 µM) for 1 h, and incubated for 24 h. GFP-positive cells were quantified by flow cytometry. Percentage of GFP-positive cells is shown. **p < 0.001; Student’s t test. (D) Primary and recurrent tissue samples of a glioblastoma patient were stained with Rad51 antibody. Arrows indicate Rad51-positive nuclei (brown).
Figure 7
Figure 7
Interference of HR through a chemical inhibitor of Rad51 causes substantial toxicity in TMZ-resistant glioblastoma cells. (A) Intrinsically TMZ-resistant patient-derived IN-GB-2 cells were exposed to the indicated concentrations of TMZ or B02. After six days of incubation, cells were counted and cell survival was assessed by cell counting. Percentages of surviving cells were calculated in proportion to the cells treated with the vehicle (DMSO). (B) Parental TMZ-sensitive IN-GB-10 cells were exposed to increasing concentration of TMZ (10–320 µM) for three months. Two different clones (IN-GB-10-R1 and IN-GB-10-R2) growing in the presence of 320 µM of TMZ were isolated. Cells were treated with the indicated concentrations of TMZ and/or B02, and percentages of survival were calculated as described in A. *p < 0.1; **p < 0.001; Student’s t test. (C) U251-MG cells were exposed to increasing concentration of TMZ (10–320 µM) in a period of three months. One clone propagating in 320 µM of TMZ was isolated and cultured in the presence of TMZ for at least a month prior to the study. The parental (U251-MG-P) and resistant cells (U251-MG-R) were exposed to TMZ, B02, or combinations of TMZ and B02 at the indicated concentrations, and clonogenic cell survival assays were performed. Colonies were counted after seven days, and the percentage of survival was calculated in proportion to the control cells. **p < 0.05; Student’s t test (combination versus single treatments). (D) U251-MG cells were exposed to TMZ (200 µM), B02 (20 µM), or the combination of TMZ (200 µM) and B02 (20 µM) for 24 h. The representative histograms of the cell cycle analyses and quantification of the cell cycle stages are shown. (E) Intact Ape1/Chk2 signaling is required for recruitment of key HR proteins such as BRCA1 and Rad51 to facilitate HR, possibly through Ape1-mediated 3′ DNA-end processing of double-strand breaks. When Ape1 is deficient, simple base lesions are converted to complex clustered DNA lesions, which is further augmented after exposure to DNA DSB damages. Any possible failure in Ape1-mediated DNA-end processing results in impaired BRCA1 recruitment to damage sites, by which error-prone NHEJ becomes predominant repair pathway in Ape1-deficient cells, causing chromosome fusions and cell death. While deficiency of Chk2 causes replication defects and cell death, shortage of Ape1 and Chk2 is likely to create a new platform for alternative DNA end-processing factors that facilitate recruitment of HR proteins, increasing HR activity and thereby adaptation to constant genomic challenges.

Similar articles

Cited by

References

    1. Nakamura J, et al. Highly sensitive apurinic/apyrimidinic site assay can detect spontaneous and chemically induced depurination under physiological conditions. Cancer Res. 1998;58:222–225. - PubMed
    1. Barnes DE, Lindahl T. Repair and genetic consequences of endogenous DNA base damage in mammalian cells. Annu Rev Genet. 2004;38:445–476. doi: 10.1146/annurev.genet.38.072902.092448. - DOI - PubMed
    1. Barnes DE, Lindahl T. Repair and genetic consequences of endogenous DNA base damage in mammalian cells. Annu Rev Genet. 2004;38:445–476. doi: 10.1146/annurev.genet.38.072902.092448. - DOI - PubMed
    1. Quiros S, Roos WP, Kaina B. Processing of O6-methylguanine into DNA double-strand breaks requires two rounds of replication whereas apoptosis is also induced in subsequent cell cycles. Cell Cycle. 2010;9:168–178. doi: 10.4161/cc.9.1.10363. - DOI - PubMed
    1. Stolz A, Ertych N, Bastians H. Tumor suppressor CHK2: regulator of DNA damage response and mediator of chromosomal stability. Clin Cancer Res. 2011;17:401–405. doi: 10.1158/1078-0432.CCR-10-1215. - DOI - PubMed

Publication types

MeSH terms