

Orientation anisotropy of quantitative MRI relaxation parameters in ordered tissue
- PMID: 28852032
- PMCID: PMC5574987
- DOI: 10.1038/s41598-017-10053-2
Orientation anisotropy of quantitative MRI relaxation parameters in ordered tissue
Abstract
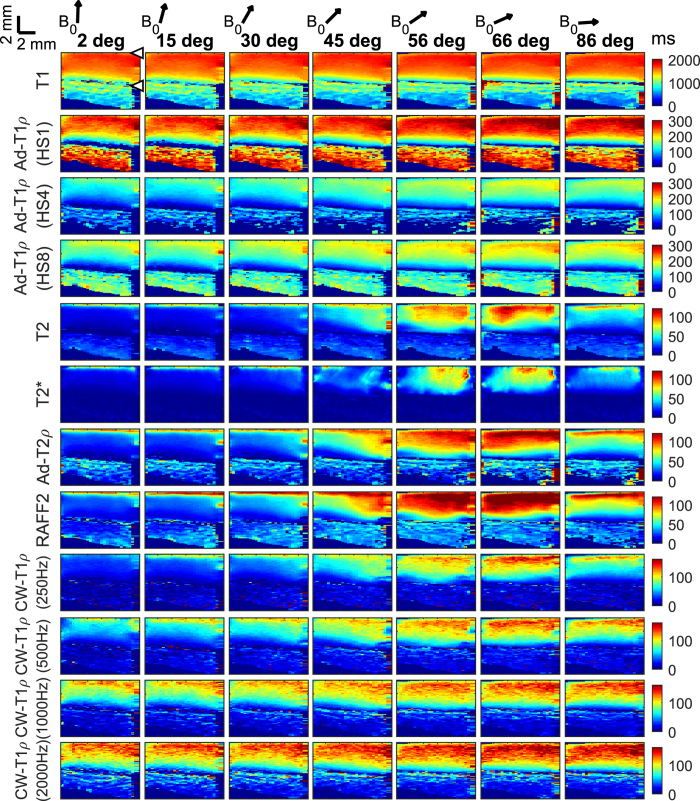
In highly organized tissues, such as cartilage, tendons and white matter, several quantitative MRI parameters exhibit dependence on the orientation of the tissue constituents with respect to the main imaging magnetic field (B0). In this study, we investigated the dependence of multiple relaxation parameters on the orientation of articular cartilage specimens in the B0. Bovine patellar cartilage-bone samples (n = 4) were investigated ex vivo at 9.4 Tesla at seven different orientations, and the MRI results were compared with polarized light microscopy findings on specimen structure. Dependences of T2 and continuous wave (CW)-T1ρ relaxation times on cartilage orientation were confirmed. T2 (and T2*) had the highest sensitivity to orientation, followed by TRAFF2 and adiabatic T2ρ. The highest dependence was seen in the highly organized deep cartilage and the smallest in the least organized transitional layer. Increasing spin-lock amplitude decreased the orientation dependence of CW-T1ρ. T1 was found practically orientation-independent and was closely followed by adiabatic T1ρ. The results suggest that T1 and adiabatic T1ρ should be preferred for orientation-independent quantitative assessment of organized tissues such as articular cartilage. On the other hand, based on the literature, parameters with higher orientation anisotropy appear to be more sensitive to degenerative changes in cartilage.
Conflict of interest statement
The authors declare that they have no competing interests.
Figures


Similar articles
-
Correlations of T1ρ With Properties of Articular Cartilage Depend on the Spin-Lock Amplitude and Orientation of the Sample.J Orthop Res. 2025 Jul;43(7):1259-1268. doi: 10.1002/jor.26094. Epub 2025 May 7. J Orthop Res. 2025. PMID: 40342181
-
Relaxation anisotropy of quantitative MRI parameters in biological tissues.Sci Rep. 2022 Jul 15;12(1):12155. doi: 10.1038/s41598-022-15773-8. Sci Rep. 2022. PMID: 35840627 Free PMC article.
-
Orientation anisotropy of quantitative MRI parameters in degenerated human articular cartilage.J Orthop Res. 2021 Apr;39(4):861-870. doi: 10.1002/jor.24778. Epub 2020 Jun 29. J Orthop Res. 2021. PMID: 32543737
-
The QIBA Profile for MRI-based Compositional Imaging of Knee Cartilage.Radiology. 2021 Nov;301(2):423-432. doi: 10.1148/radiol.2021204587. Epub 2021 Sep 7. Radiology. 2021. PMID: 34491127 Free PMC article. Review.
-
MRI-based T1rho and T2 cartilage compositional imaging in osteoarthritis: what have we learned and what is needed to apply it clinically and in a trial setting?Skeletal Radiol. 2023 Nov;52(11):2137-2147. doi: 10.1007/s00256-023-04310-x. Epub 2023 Mar 31. Skeletal Radiol. 2023. PMID: 37000230 Free PMC article. Review.
Cited by
-
An order parameter without magic angle effect (OPTIMA) derived from dispersion in ordered tissue.Magn Reson Med. 2020 May;83(5):1783-1795. doi: 10.1002/mrm.28045. Epub 2019 Nov 5. Magn Reson Med. 2020. PMID: 31691348 Free PMC article.
-
Evaluation of articular cartilage with quantitative MRI in an equine model of post-traumatic osteoarthritis.J Orthop Res. 2021 Jan;39(1):63-73. doi: 10.1002/jor.24780. Epub 2020 Jun 24. J Orthop Res. 2021. PMID: 32543748 Free PMC article.
-
Dependence of resting-state fMRI fluctuation amplitudes on cerebral cortical orientation relative to the direction of B0 and anatomical axes.Neuroimage. 2019 Aug 1;196:337-350. doi: 10.1016/j.neuroimage.2019.04.036. Epub 2019 Apr 17. Neuroimage. 2019. PMID: 31002965 Free PMC article.
-
Bi-Exponential 3D UTE-T1ρ Relaxation Mapping of Ex Vivo Human Knee Patellar Tendon at 3T.Bioengineering (Basel). 2024 Jan 9;11(1):66. doi: 10.3390/bioengineering11010066. Bioengineering (Basel). 2024. PMID: 38247943 Free PMC article.
-
Magnetic Resonance Imaging of the Musculoskeletal System at 7T: Morphological Imaging and Beyond.Top Magn Reson Imaging. 2019 Jun;28(3):125-135. doi: 10.1097/RMR.0000000000000205. Top Magn Reson Imaging. 2019. PMID: 30951006 Free PMC article. Review.
References
Publication types
MeSH terms
Grants and funding
LinkOut - more resources
Full Text Sources
Other Literature Sources
Medical
