. 2017 Aug 29;7(1):9723.
doi: 10.1038/s41598-017-10097-4.

TCA cycle rewiring fosters metabolic adaptation to oxygen restriction in skeletal muscle from rodents and humans

Affiliations

TCA cycle rewiring fosters metabolic adaptation to oxygen restriction in skeletal muscle from rodents and humans

Daniele Capitanio et al. Sci Rep. .

Abstract

In mammals, hypoxic stress management is under the control of the Hypoxia Inducible Factors, whose activity depends on the stabilization of their labile α subunit. In particular, the skeletal muscle appears to be able to react to changes in substrates and O2 delivery by tuning its metabolism. The present study provides a comprehensive overview of skeletal muscle metabolic adaptation to hypoxia in mice and in human subjects exposed for 7/9 and 19 days to high altitude levels. The investigation was carried out combining proteomics, qRT-PCR mRNA transcripts analysis, and enzyme activities assessment in rodents, and protein detection by antigen antibody reactions in humans and rodents. Results indicate that the skeletal muscle react to a decreased O2 delivery by rewiring the TCA cycle. The first TCA rewiring occurs in mice in 2-day hypoxia and is mediated by cytosolic malate whereas in 10-day hypoxia the rewiring is mediated by Idh1 and Fasn, supported by glutamine and HIF-2α increments. The combination of these specific anaplerotic steps can support energy demand despite HIFs degradation. These results were confirmed in human subjects, demonstrating that the TCA double rewiring represents an essential factor for the maintenance of muscle homeostasis during adaptation to hypoxia.


Conflict of interest statement

The authors declare that they have no competing interests.

Figures

Figure 1
Figure 1
HIF-1α (A) and HIF-2α (B) immunoblotting and quantitation (cropped images; full lenght blots are included as Supplementary Data). qRT-PCR of HIF-1α (C) and HIF-2α (D) mRNA. Data were generated from eight independent experiments and values were referred to mRNA levels of control normoxic mice and expressed as mean ± SD (N, normoxic control; 2 H, 2-day hypoxia; 10 H, 10-day hypoxia). Immunoblotting and qRT-PCR data were subjected to ANOVA and Tukey test (n = 5, p < 0.05). Differences between 2 H and 10 H versus N were indicated with the * symbol.
Figure 2
Figure 2
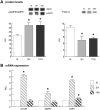
(A) pAMPK/AMPK and PGC1α immunoblotting and quantitation (cropped images; full lenght blots are included as Supplementary Data). (B) qRT-PCR of mTOR, AMPK and LKB1 mRNAs. Data were generated from eight independent experiments and values were referred to mRNA levels of control normoxic mice and expressed as mean ± SD (N, normoxic control; 2 H, 2-day hypoxia; 10 H, 10-day hypoxia). Immunoblotting and qRT-PCR data were subjected to ANOVA and Tukey test (n = 5, p < 0.05). Differences between 2 H and 10 H versus N were indicated with the * symbol.
Figure 3
Figure 3
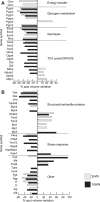
Proteomic profile of mice skeletal muscle exposed to 2-day (2 H) and 10-day (10 H) hypoxia. Histograms of skeletal muscle metabolic changes in 2 H (grey bars) and 10 H (black bars) as detected by 2D-DIGE analysis (ANOVA coupled to Tukey’s multiple-group comparison test, n = 5, p < 0.01). Protein spots statistically altered are reported with the corresponding gene name and the degree of variation is expressed as a percent of spot volume variation in hypoxic mice versus controls. (A) Metabolic proteins grouped according to their function: energy transfer enzymes (Ckm, creatine kinase),glycogen metabolism enzymes (Pygm, glycogen phosphorylase; Pgm2, phosphoglucomutase), glycolytic enzymes (Eno3, enolase; Pkm, pyruvate kinase), TCA cycle/OXPHOS enzymes (Aco2, aconitate hydratase; Idh3a, isocitrate dehydrogenase 3; Ogdh, 2-oxoglutarate dehydrogenase; Dld dihydrolipoyl dehydrogenase; Sdha, succinate dehydrogenase flavoprotein; Ndufs1, NADH dehydrogenase (ubiquinone) Fe-S protein 1; Atp5b, ATP synthase subunit beta; Mdh1, cytoplasmic malate dehydrogenase). (B) Structural/contractile (Des, desmin; Vim, vimentin; Tubb4b, tubulin beta-2C chain; Myh4, myosin-4; Mybph, myosin-binding protein H; Tnnt3, troponin T fast; Tpm2, tropomyosin beta chain; Myl1, myosin light chain 1/3, skeletal muscle isoform (MLC 1F); Myl3, myosin light chain 3 (MLC 1 sb)), stress response (P4hb, protein disulfide-isomerase; Pdia3, protein disulfide-isomerase A3; Trim72, tripartite motif-containing protein 72; Hspa8, heat shock cognate 71 kDa protein; Hsp90ab1, heat shock protein 84b; Park7, protein DJ-1) and other proteins (Ca3, Carbonic anhydrase 3; Mb, myoglobin; Pvalb, parvalbumin alpha; Tufm, elongation factor Tu, mitochondrial; Immt, Immt protein; Fgb, fibrinogen beta chain; Fgg, fibrinogen gamma chain; Tf, serotransferrin; Alb, serum albumin).
Figure 4
Figure 4
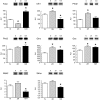
Expression levels of key metabolic enzymes in skeletal muscle of mice exposed to 2-day (2 H) and 10-day (10 H) hypoxia. Representative immunoblot images (cropped images; full lenght blots are included as Supplementary Data) and histograms of protein expression levels of fatty acid synthase (Fasn), isocitrate dehydrogenase 1 (Idh1), glutamine synthetase (Glns), glutathione synthetase (Gss), HIF prolyl hydroxylase 2 and 3 (Phd2 and Phd3), mitochondrial malate dehydrogenase (Mdh2) and succinate dehydrogenase A chain (Sdha) in 2 H and 10 H compared to normoxic controls (N). Data were normalized against the total amount of loaded proteins stained with Sypro Ruby. Statistical analysis was performed by ANOVA and Tukey test (n = 5, p < 0.05). *Significant difference between 2 H and 10 H versus N.
Figure 5
Figure 5
Enzymatic activity of respiratory chain complexes. Histograms showing NADH dehydrogenase (OXPHOS Complex I), succinate dehydrogenase (OXPHOS complex II), ubiquinol-cytochrome-c reductase (OXPHOS complex III) and citrate synthase (a marker of mitochondrial content) enzymatic activities in 2-day (2 H) and 10-day (10 H) hypoxia mice compared to normoxic controls (N). Activities were referred to the total protein content of the samples (Units = µmol/mg/min). Mean ± SD, ANOVA and Tukey test, n = 5, *p < 0.05.
Figure 6
Figure 6
Expression levels of hexosamine pathway enzymes. Representative immunoblot images (cropped images; full lenght blots are included as Supplementary Data) and histograms of protein expression levels of fructose-1,6-bisphosphatase (Fbp1), glucosamine 6-phosphate N-acetyltransferase (Gna1), UDP-N-acetylhexosamine pyrophosphorylase (Uap1), Dolichyl-diphosphooligosaccharide-protein glycosyltransferase subunit STT3B (Stt3b), UDP-N-acetylglucosamine-peptide N-acetylglucosaminyltransferase 110 kDa subunit (Ogt) and protein O-GlcNAcase (Oga) in 2-day (2 H) and 10-day (10 H) hypoxia mice compared to normoxic controls (N). Data were normalized against the total amount of loaded proteins stained with Sypro Ruby. Statistical analysis was performed by ANOVA and Tukey test (n = 5, p < 0.05). *Significant difference between 2 H and 10 H versus N.
Figure 7
Figure 7
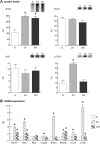
(A) BCL2/adenovirus E1B 19 kDa protein-interacting protein 3 (Bnip3), Beclin-1 (Becn1), Apoptosis regulator Bcl-2 (Bcl2) and the lipidated form of microtubule-associated protein 1 light chain 3 beta (LC3B-II) immunoblotting and quantitation (cropped images; full lenght blots are included as Supplementary Data). (B) qRT-PCR of Becn1, apoptosis regulator Bax, Bcl2, Caspase-3 (Casp3), Bnip3, BCL2/adenovirus E1B 19 kDa interacting protein 3-like (Bnip3L), microtubule-associated protein 1 light chain 3 alpha (LC3A) and LC3B. Data were generated from eight independent experiments and values were referred to mRNA levels of control normoxic mice and expressed as mean ± SD. Immunoblotting and qRT-PCR data were subjected to a ANOVA and Tukey test (n = 5, p < 0.05). Differences between 2 H and 10 H versus N were indicated with the * symbol.
Figure 8
Figure 8
Expression levels of key metabolic enzymes in human vastus lateralis muscle after 7–9 days (Mt. Rosa, MR) and 19 days (Everest expedition, EE) of hypoxia exposure. Representative immunoblot images (cropped images; full lenght blots are included as Supplementary Data) and histograms of protein expression levels of citrate synthase (CS), aconitate hydratase 2 (Aco2), succinate dehydrogenase A chain (Sdha), isocitrate dehydrogenase 1 (Idh1), mitochondrial malate dehydrogenase (Mdh2) and fatty acid synthase (Fasn), in MR and EE compared to sea level (SL). Data were normalized against the total amount of loaded proteins stained with Sypro Ruby. Statistical analysis was performed by ANOVA and Tukey test (n = 6, p < 0.05). *Significant difference between MR and EE versus SL.
Figure 9
Figure 9
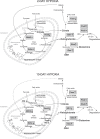
Schematic representation of the metabolic adaptation to 2-day hypoxia (2 H) and 10-day hypoxia (10 H) in skeletal muscle. Protein expression profiles derived from 2D-DIGE and immunoblotting analyses are reported in grey rectangles with the corresponding gene names and a symbol indicating their increase (↑), decrease (↓) or their similarity (=) in 2 H (upper panel) or in 10 H (lower panel) versus normoxic controls (Aco2, aconitate hydratase 2; Fasn, fatty acid synthase; Idh1, isocitrate dehydrogenase 1; Glns, glutamine synthetase; Gss, glutathione synthetase; Phd2 and Phd3, HIF prolyl hydroxylase 2 and 3, Mdh2, mitochondrial malate dehydrogenase; Sdha, succinate dehydrogenase A chain).

Similar articles

Cited by

References

    1. Semenza GL. Oxygen sensing, hypoxia-inducible factors, and disease pathophysiology. Annual review of pathology. 2014;9:47–71. doi: 10.1146/annurev-pathol-012513-104720. - DOI - PubMed
    1. Kaelin WG, Jr., Ratcliffe PJ. Oxygen sensing by metazoans: the central role of the HIF hydroxylase pathway. Molecular cell. 2008;30:393–402. doi: 10.1016/j.molcel.2008.04.009. - DOI - PubMed
    1. Appelhoff RJ, et al. Differential function of the prolyl hydroxylases PHD1, PHD2, and PHD3 in the regulation of hypoxia-inducible factor. The Journal of biological chemistry. 2004;279:38458–38465. doi: 10.1074/jbc.M406026200. - DOI - PubMed
    1. Berra E, et al. HIF prolyl-hydroxylase 2 is the key oxygen sensor setting low steady-state levels of HIF-1alpha in normoxia. The EMBO journal. 2003;22:4082–4090. doi: 10.1093/emboj/cdg392. - DOI - PMC - PubMed
    1. Epstein AC, et al. C. elegans EGL-9 and mammalian homologs define a family of dioxygenases that regulate HIF by prolyl hydroxylation. Cell. 2001;107:43–54. doi: 10.1016/S0092-8674(01)00507-4. - DOI - PubMed

Publication types

MeSH terms