. 2017 Aug 29;7(1):9809.
doi: 10.1038/s41598-017-10213-4.

Neurotransmitters and neuropeptides in gonadal steroid receptor-expressing cells in medial preoptic area subregions of the male mouse

Affiliations

Neurotransmitters and neuropeptides in gonadal steroid receptor-expressing cells in medial preoptic area subregions of the male mouse

Yousuke Tsuneoka et al. Sci Rep. .

Abstract

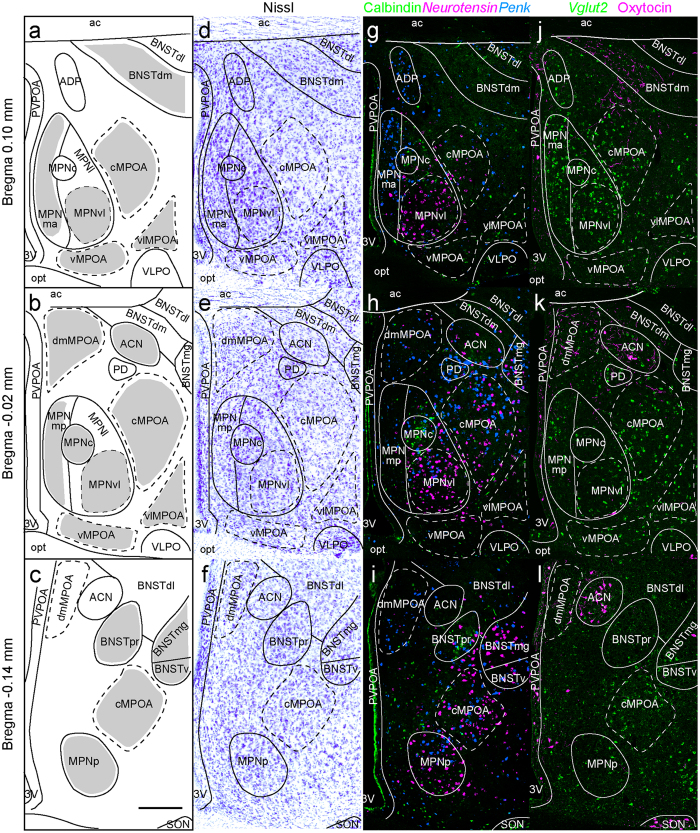
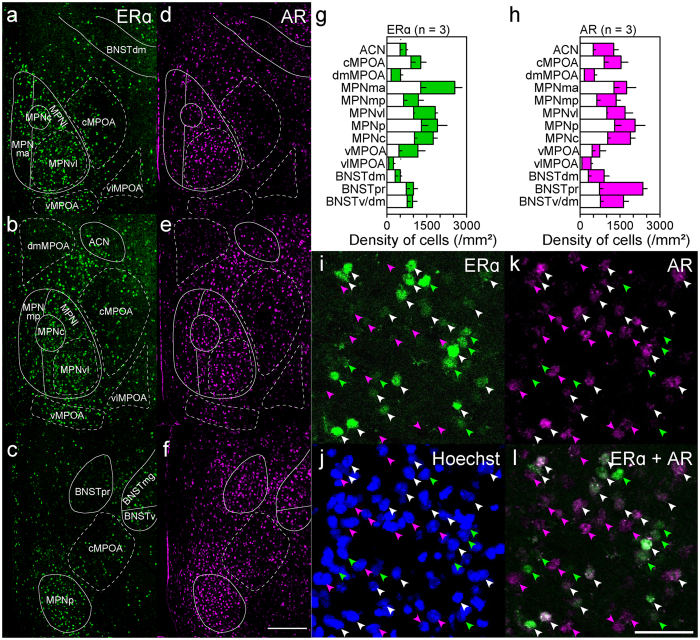
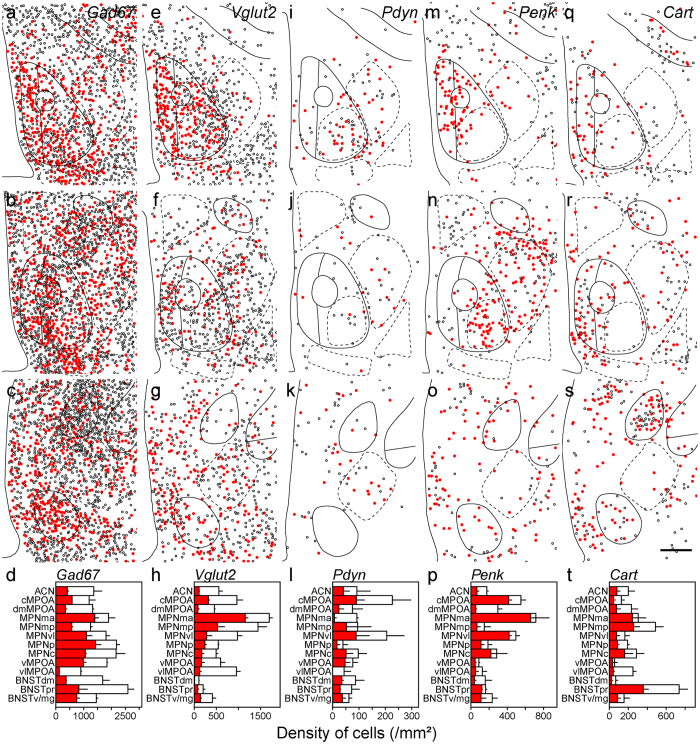
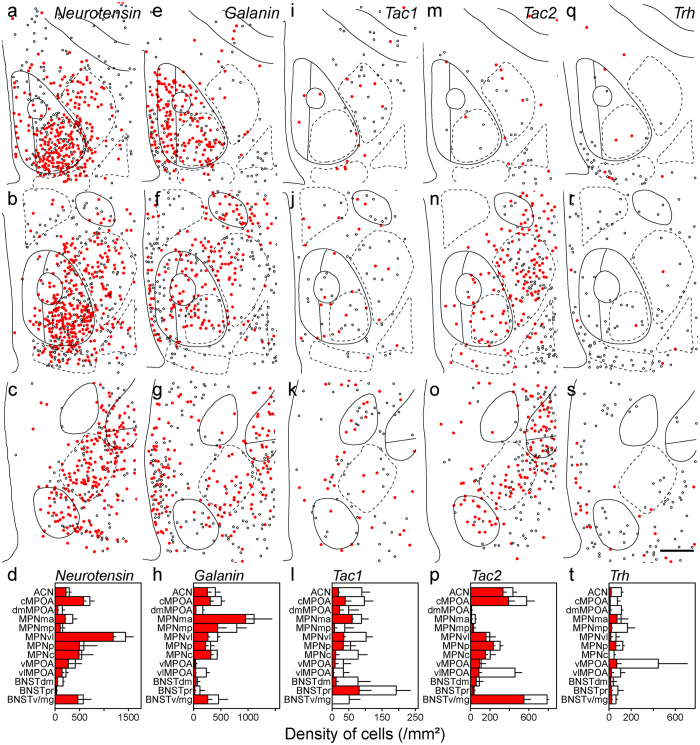
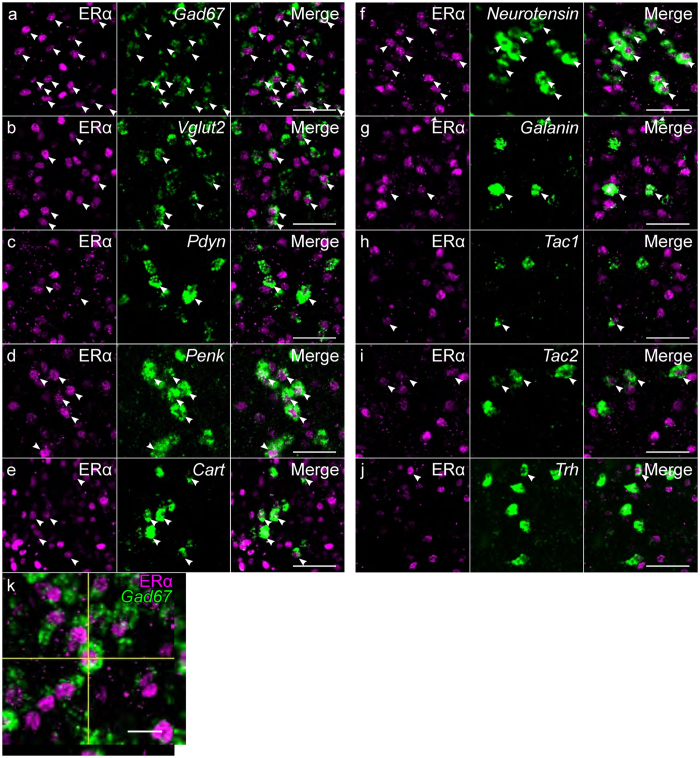
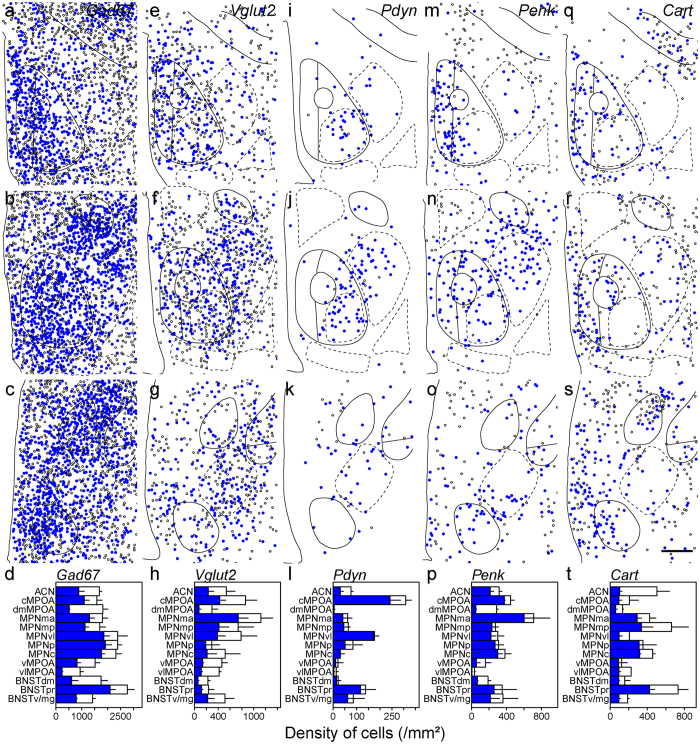
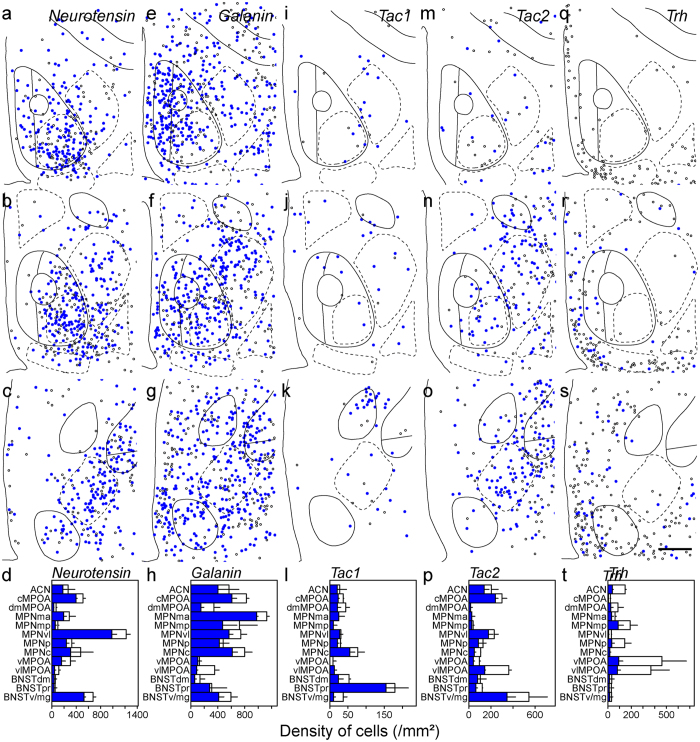
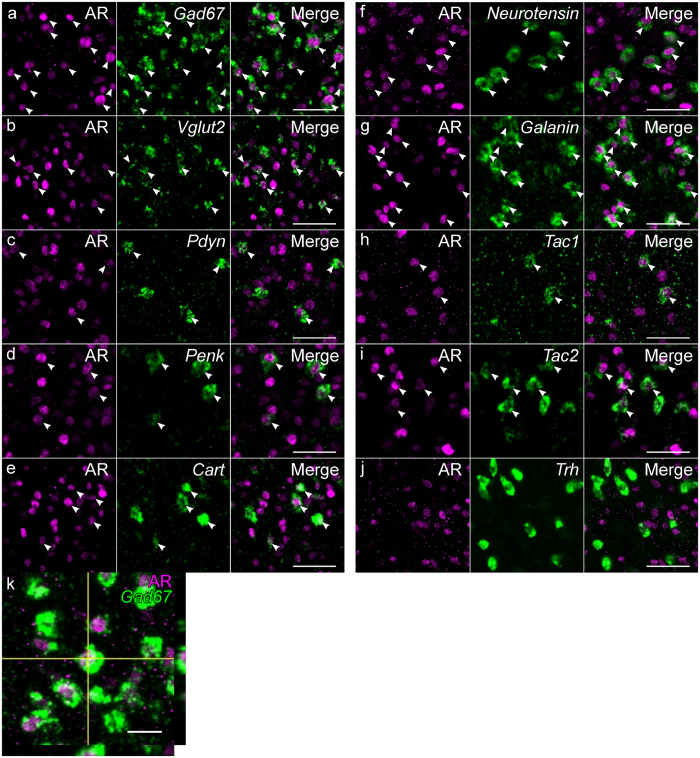
Testosterone is involved in male sexual, parental and aggressive behaviors through the androgen receptor (AR) and estrogen receptor (ER) α expressed in the brain. Although several studies have demonstrated that ERα and AR in the medial preoptic area (MPOA) are required for exhibiting sexual and aggressive behaviors of male mice, the molecular characteristics of ERα- and AR-expressing cells in the mouse MPOA are largely unknown. Here, we performed in situ hybridization for neurotransmitters and neuropeptides, combined with immunohistochemistry for ERα and AR to quantitate and characterize gonadal steroid receptor-expressing cells in the MPOA subregions of male mice. Prodynorphin, preproenkephalin (Penk), cocaine- and amphetamine-related transcript, neurotensin, galanin, tachykinin (Tac)1, Tac2 and thyrotropin releasing hormone (Trh) have distinct expression patterns in the MPOA subregions. Gad67-expressing cells were the most dominant neuronal subtype among the ERα- and AR-expressing cells throughout the MPOA. The percentage of ERα- and AR-immunoreactivities varied depending on the neuronal subtype. A substantial proportion of the neurotensin-, galanin-, Tac2- and Penk-expressing cells in the MPOA were positive for ERα and AR, whereas the vast majority of the Trh-expressing cells were negative. These results suggest that testosterone exerts differential effects depending on both the neuronal subtypes and MPOA subregions.


Conflict of interest statement

The authors declare that they have no competing interests.

Figures

Figure 1
Figure 1
Medial preoptic area (MPOA) subregions identified on Nissl-stained sections and fluorescent images using area markers. (a–c) Schematic drawings showing the MPOA subregions and nuclei of the bed nucleus of the stria terminalis (BNST). The shaded areas in (a–c) were quantitated for gonadal hormone receptor-expressing cells in this study. (d–f) Representative images of Nissl-stained coronal sections along the anterior-posterior axis. (g–i) Representative images of calbindin (green), Neurotensin (magenta) and Penk (light blue). (j–l) Representative images of Vglut2 (green) and oxytocin (magenta). These images are representative of at least six different mice for each image series. Scale bars: 200 μm. 3 v, third ventricle; ac, anterior commissure; ACN, anterior commissural nucleus; ADP, anterodorsal preoptic nucleus; BNSTdm, dorsomedial nucleus of the BNST; BNSTmg, magnocellular nucleus of the BNST; BNSTpr, principal nucleus of the BNST; BNSTv, ventral nucleus of the BNST; cMPOA, central part of the MPOA; dmMPOA, dorsomedial part of the MPOA; MPNc, central part of the MPN; MPNma, anteromedial part of the MPN; MPNmp, posteromedial part of the MPN; MPNp, posterior part of the MPN; MPNvl, ventrolateral part of the MPN; opt, optic tract; PD, posterodorsal preoptic nucleus; SON, supraoptic nucleus; vMPOA, ventral part of the MPOA; vlMPOA, ventrolateral part of the MPOA; VLPO, ventrolateral preoptic nucleus.
Figure 2
Figure 2
Distributions of ERα- and AR-ir cells in the MPOA and adjacent areas in male mice. (a–c) Representative images of single immunostaining for ERα of the MPOA. (d–f) Representative images of single immunostaining for AR of the MPOA. Solid and dashed lines indicate delineations of the quantified subregions. (a,d) Bregma, +0.10 mm. (b,e) Bregma, −0.02 mm. (c,f) Bregma, −0.14 mm. (g,h) Regional differences in singly or doubly positive cells examined with double immunostaining for ERα and AR. Open bars indicate the density of cells doubly positive for ERα and AR. Filled bars indicate the density of cells singly positive for ERα (g) or AR (h) Three sections derived from different mice were counted. (i–l) Representative fluorescent images of double fluorescent immunohistochemistry for ERα and AR. (i) ERα (j) AR. (k) Hoechst. (l) Merge of ERα and AR. Scale bars: 200 μm in (f), 50 μm in, (o).
Figure 3
Figure 3
Distributions of singly and doubly positive cells of in situ hybridization for neurotransmitters and neuropeptides with immunostaining for ERα in the MPOA and adjacent areas.Representative cell distributions of in situ hybridization for Gad67 (a–c, n = 4), Vglut2 (e–g, n = 3), Pdyn (i–k, n = 3), Penk (m–o, n = 3) and Cart (q–s, n = 3), combined with immunostaining for ERα. Filled circles indicate cells doubly positive for neurotransmitter/neuropeptide and ERα. Open circles indicate neurotransmitter/neuropeptide-positive and ERα-negative cells. Solid and dashed lines indicate delineations of the quantified subregions. The third ventricle is located on the left side of each panel. (d,h,l,p,t) Filled bars indicate cells doubly positive for neurotransmitter/neuropeptide and ERα (mean ± S. E.). Open bars indicate cells positive for neurotransmitter/neuropeptide-positive and negative for ERα (mean ± S. E.). (d) Gad67. (h) Vglut2. (l) Pdyn. (p) Penk. (t) Cart. (a,e,i,m,q) Bregma, + 0.10 mm. (b,f,j,n,r) Bregma, −0.02 mm mm. (c,g,k,o,s) Bregma, −0.14 mm. Scale bars: 200 μm.
Figure 4
Figure 4
Distributions of singly and doubly positive cells of in situ hybridization for neurotransmitters and neuropeptides with immunostaining for ERα in the MPOA and adjacent areas. Representative cell distributions of in situ hybridization for Neurotensin (ac, n = 3), Galanin (eg, n = 3), Tac1 (ik, n = 3), Tac2 (mo, n = 3) and Trh (qs, n = 3), combined with immunostaining for ERα. Filled circles indicate cells doubly positive for neurotransmitter/neuropeptide and ERα. Open circles indicate neurotransmitter/neuropeptide-positive and ERα-negative cells. Solid and dashed lines indicate delineations of the quantified subregions. The third ventricle is located on the left side of each panel. (d,h,l,p,t) Filled bars indicate cells doubly positive for neurotransmitter/neuropeptide and ERα (mean ± S. E.). Open bars indicate cells positive for neurotransmitter/neuropeptide-positive and negative for ERα (mean ± S. E.). (d) Neurotensin. (h) Galanin. (l) Tac1. (p) Tac2. (t) Trh. (a,e,i,m,q) Bregma, + 0.10 mm. (b,f,j,n,r): Bregma, −0.02 mm. (c,g,k,o,s) Bregma, −0.14 mm. Scale bars: 200 μm.
Figure 5
Figure 5
Representative fluorescent images of in situ hybridization for neurotransmitters and neuropeptides combined with immunostaining for ERα (a). Gad67. (b) Vglut2. (c) Pdyn. (d) Penk. (e) Cart. (f) Neurotensin. (g) Galanin. (h) Tac1. (i) Tac2 (j) Trh. (k) Orthogonal view of Gad67 and ERα positive cells. Each image series is representative of at least three different mice. Arrowheads indicate double positive cells. Scale bars: 50 μm (aj), 20 μm (k).
Figure 6
Figure 6
Distributions of singly and doubly positive cells of in situ hybridization for neurotransmitters and neuropeptides with immunostaining for AR in the MPOA and adjacent areas.Representative cell distributions of in situ hybridization for Gad67 (a–c, n = 3), Vglut2 (e–g, n = 3), Pdyn (ik, n = 3), Penk (mo, n = 3) and Cart (qs, n = 4), combined with immunostaining for AR. Filled circles indicate cells doubly positive for neurotransmitter/neuropeptide and AR. Open circles indicate neurotransmitter/neuropeptide-positive and AR-negative cells. Solid and dashed lines indicate delineations of the quantified subregions. The third ventricle is located on the left side of each panel. (d,h,l,p,t) Filled bars indicate cells doubly positive for neurotransmitter/neuropeptide and AR (mean ± S. E.). Open bars indicate cells positive for neurotransmitter/neuropeptide-positive and negative for AR (mean ± S. E.). (d) Gad67. (h) Vglut2. (l) Pdyn. (p) Penk. (t) Cart. (a,e,i,m,q) Bregma, + 0.10 mm. (b,f,j,n,r) Bregma −0.02 mm. (c,g,k,o,s): Bregma, −0.14 mm. Scale bars: 200 μm.
Figure 7
Figure 7
Distributions of singly and doubly positive cells of in situ hybridization for neurotransmitters and neuropeptides with immunostaining for AR in the MPOA and adjacent areas.Representative cell distributions of in situ hybridization for Neurotensin (ac, n = 3), Galanin (eg, n = 3), Tac1 (ik, n = 3), Tac2 (mo, n = 4), and Trh (qs, n = 3), combined with immunostaining for AR. Filled circles indicate cells doubly positive for neurotransmitter/neuropeptide and AR. Open circles indicate neurotransmitter/neuropeptide-positive and AR-negative cells. Solid and dashed lines indicate delineations of the quantified subregions. The third ventricle is located on the left side of each panel. (d) Neurotensin. (h) Galanin. (l) Tac1. (p) Tac2. (t) Trh. (a,e,i,m,q): Bregma, + 0.10 mm. (b,f,j,n,r) Bregma, −0.02 mm. (c,g,k,o,s) Bregma, −0.14 mm. Scale bars: 200 μm.
Figure 8
Figure 8
Representative fluorescent images of in situ hybridization for neurotransmitters and neuropeptides combined with immunostaining for AR. (a) Gad67. (b) Vglut2. (c) Pdyn. (d) Penk. (e) Cart. (f) Neurotensin. (g) Galanin. (h) Tac1. (i)Tac2. (j) Trh. (k) Orthogonal view of Gad67 and AR positive cells. Each image series is representative of at least three different mice. Arrowheads indicate double positive cells. Scale bars: 50 μm (aj), 20 μm (k).

Similar articles

Cited by

References

    1. Cunningham RL, Lumia AR, McGinnis MY. Androgen receptors, sex behavior, and aggression. Neuroendocrinology. 2012;96:131–40. doi: 10.1159/000337663. - DOI - PMC - PubMed
    1. Hull EM, Dominguez JM. Sexual behavior in male rodents. Hormones and behavior. 2007;52:45–55. doi: 10.1016/j.yhbeh.2007.03.030. - DOI - PMC - PubMed
    1. Ogawa S, Lubahn DB, Korach KS, Pfaff DW. Behavioral effects of estrogen receptor gene disruption in male mice. Proceedings of the National Academy of Sciences of the United States of America. 1997;94:1476–81. doi: 10.1073/pnas.94.4.1476. - DOI - PMC - PubMed
    1. Ogawa S, et al. Modifications of testosterone-dependent behaviors by estrogen receptor-alpha gene disruption in male mice. Endocrinology. 1998;139:5058–69. doi: 10.1210/endo.139.12.6358. - DOI - PubMed
    1. Simerly RB, Chang C, Muramatsu M, Swanson LW. Distribution of androgen and estrogen receptor mRNA-containing cells in the rat brain: an in situ hybridization study. The Journal of comparative neurology. 1990;294:76–95. doi: 10.1002/cne.902940107. - DOI - PubMed