

Low Carbon sink capacity of Red Sea mangroves
- PMID: 28852185
- PMCID: PMC5574891
- DOI: 10.1038/s41598-017-10424-9
Low Carbon sink capacity of Red Sea mangroves
Abstract
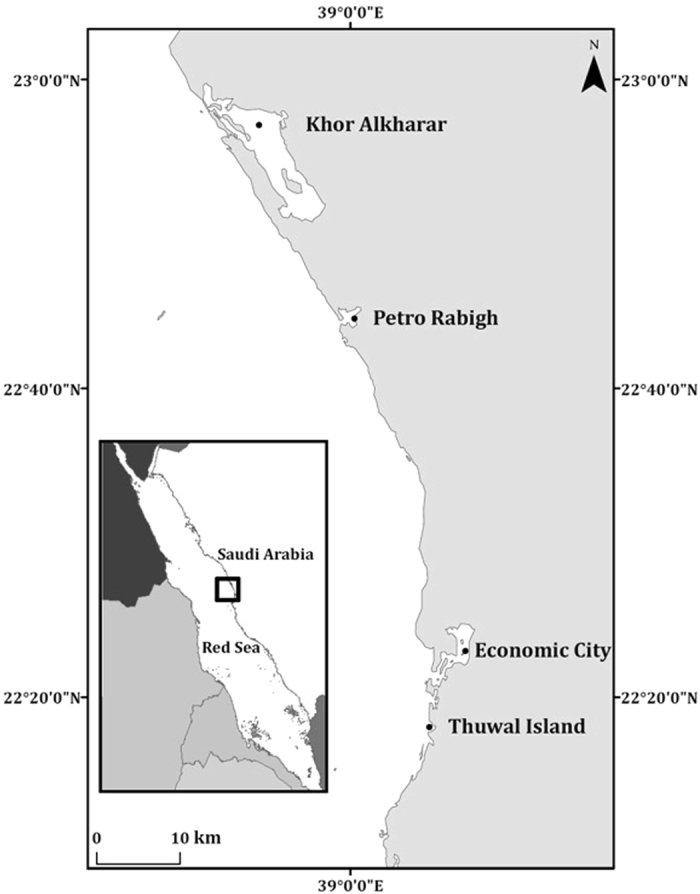
Mangroves forests of Avicennia marina occupy about 135 km2 in the Red Sea and represent one of the most important vegetated communities in this otherwise arid and oligotrophic region. We assessed the soil organic carbon (Corg) stocks, soil accretion rates (SAR; mm y-1) and soil Corg sequestration rates (g Corg m-2 yr-1) in 10 mangrove sites within four locations along the Saudi coast of the Central Red Sea. Soil Corg density and stock in Red Sea mangroves were among the lowest reported globally, with an average of 4 ± 0.3 mg Corg cm-3 and 43 ± 5 Mg Corg ha-1 (in 1 m-thick soils), respectively. Sequestration rates of Corg, estimated at 3 ± 1 and 15 ± 1 g Corg m-2 yr-1 for the long (millennia) and short (last century) temporal scales, respectively, were also relatively low compared to mangrove habitats from more humid bioregions. In contrast, the accretion rates of Central Red Sea mangroves soils were within the range reported for global mangrove forests. The relatively low Corg sink capacity of Red Sea mangroves could be due to the extreme environmental conditions such as low rainfall, nutrient limitation and high temperature, reducing the growth rates of the mangroves and increasing soil respiration rates.
Conflict of interest statement
The authors declare that they have no competing interests.
Figures


References
-
- Duarte CM, Middelburg JJ, Caraco N. Major role of marine vegetation on the oceanic carbon cycle. Biogeosciences. 2005;2:1–8. doi: 10.5194/bg-2-1-2005. - DOI
-
- Duarte CM, Losada IJ, Hendriks IE, Mazarrasa I, Marbà N. The role of coastal plant communities for climate change mitigation and adaptation. Nature Climate Change. 2013;3:961–968. doi: 10.1038/nclimate1970. - DOI
-
- Bouillon, S. et al. Mangrove production and carbon sinks: a revision of global budget estimates. Global Biogeochemical Cycles22 (2008).
-
- Duarte, C. M. In EGU General Assembly Conference Abstracts. 1459.
Publication types
LinkOut - more resources
Full Text Sources
Other Literature Sources
Molecular Biology Databases
Research Materials
Miscellaneous
