Elevated Blood Pressure and Its Associated Risk Factors among Adolescents of a North Indian City - A Cross-sectional Study
- PMID: 28852279
- PMCID: PMC5561693
- DOI: 10.4103/ijcm.IJCM_106_16
Elevated Blood Pressure and Its Associated Risk Factors among Adolescents of a North Indian City - A Cross-sectional Study
Abstract
Context: Amidst the uncertainty in childhood blood pressure (BP) thresholds, besides the ambiguity in levels and duration of BP elevation causing organ damage, hypertension is present in substantial number of asymptomatic children and adolescents with only a few studies disclosing the setup. With projection of deaths due to noncommunicable diseases in 2030 rising to 52 million, it is necessary to know about the knowledge of present adolescents about BP and its modifiable risk factors.
Aims: (1) To assess the prevalence of elevated BP among adolescents and to ascertain the associated risk factors. (2) To assess adolescent's knowledge about BP and its modifiable factors.
Settings and design: A community-based cross-sectional study was conducted on school going adolescents of Lucknow, from September 2014 to August 2015.
Subjects and methods: BP, height, and weight were measured following standard protocols, Centers for Disease Control and Prevention charts for finding respective cut-off values and oral questionnaire for assessing lifestyle risk factors were used.
Statistical analysis: Chi-square, unpaired t-test, and logistic regression were used.
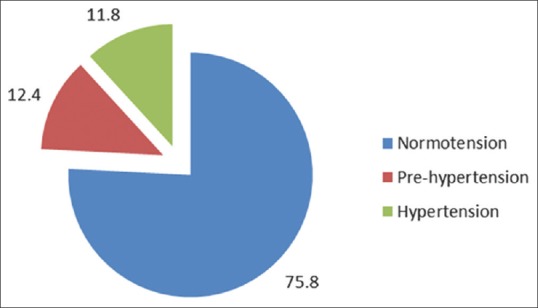
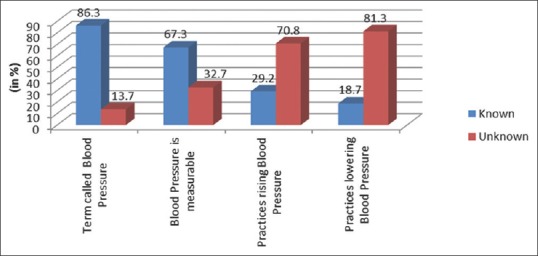
Results: Of the 1041 participants, elevated BP (BP percentile ≥90) was prevalent in 24.2%. On regression, factors such as obesity (adjusted odds ratio [aOR] = 5.8, 95% confidence interval [CI] = 3.6-9.4), low fruit diet (aOR = 3.3, 95% CI = 2.1-5.4), and frequent junk food consumption (aOR = 1.9, 95% CI = 1.3-2.8) raised the odds of elevated BP while it was lowered by being physically active (aOR = 0.67, 95% CI = 0.46-0.97). Of 86.3% of children (n = 898) who were fathomed of BP, only less than third (33% and 21.9%) acquainted of BP raising and lowering practices, respectively.
Conclusions: Prevalence of high BP is colossal with only a few children knowing its amendable nature. Strenuous efforts targeting detrimental behaviors and imparting the sense of healthy lifestyle enhancing practices are vital to control this epidemic.
Keywords: Adolescents; elevated blood pressure; knowledge.
Conflict of interest statement
There are no conflicts of interest.
Figures
Similar articles
-
Prevalence of sustained hypertension and obesity among urban and rural adolescents: a school-based, cross-sectional study in North India.BMJ Open. 2019 Sep 8;9(9):e027134. doi: 10.1136/bmjopen-2018-027134. BMJ Open. 2019. PMID: 31501100 Free PMC article.
-
Association of neck circumference and high blood pressure in children and adolescents: a case-control study.BMC Pediatr. 2015 Sep 17;15:127. doi: 10.1186/s12887-015-0444-2. BMC Pediatr. 2015. PMID: 26383844 Free PMC article.
-
Hypertension Prevalence Based on Three Separate Visits and Its Association With Obesity Among Chinese Children and Adolescents.Front Pediatr. 2019 Jul 24;7:307. doi: 10.3389/fped.2019.00307. eCollection 2019. Front Pediatr. 2019. PMID: 31396500 Free PMC article.
-
Association between obesity and high blood pressure among Lithuanian adolescents: a cross-sectional study.Ital J Pediatr. 2014 Dec 10;40:102. doi: 10.1186/s13052-014-0102-6. Ital J Pediatr. 2014. PMID: 25492217 Free PMC article.
-
Determinants of blood pressure control amongst hypertensive patients in Northwest Ethiopia.PLoS One. 2018 May 2;13(5):e0196535. doi: 10.1371/journal.pone.0196535. eCollection 2018. PLoS One. 2018. PMID: 29718964 Free PMC article.
Cited by
-
Why The Knowledge of Indian School-Going Adolescents Regarding NCDs is Not Transforming into Lifestyle Changes?Niger Med J. 2022 Sep 12;63(4):326-335. doi: 10.60787/NMJ-63-4-129. eCollection 2022 Jul-Aug. Niger Med J. 2022. PMID: 38863467 Free PMC article.
-
Assessment of Preventable Risk Factors of Cardiovascular Diseases among Junior College Students: A Cross-Sectional Study.Indian J Community Med. 2021 Jul-Sep;46(3):450-453. doi: 10.4103/ijcm.IJCM_682_20. Epub 2021 Oct 13. Indian J Community Med. 2021. PMID: 34759486 Free PMC article.
-
Association between arterial hypertension and nutritional status in adolescents from Goiânia, Goiás, Brazil.PLoS One. 2017 Dec 18;12(12):e0188782. doi: 10.1371/journal.pone.0188782. eCollection 2017. PLoS One. 2017. PMID: 29253900 Free PMC article.
References
-
- Chow CK, Teo KK, Rangarajan S, Islam S, Gupta R, Avezum A, et al. Prevalence, awareness, treatment, and control of hypertension in rural and urban communities in high-, middle-, and low-income countries. JAMA. 2013;310:959–68. - PubMed
-
- Durrani AM, Waseem F. Blood pressure distribution and its relation to anthropometric measurements among school children in Aligarh. Indian J Public Health. 2011;55:121–4. - PubMed
-
- Pickering TG, Hall JE, Appel LJ, Falkner BE, Graves J, Hill MN, et al. Recommendations for blood pressure measurement in humans and experimental animals: Blood pressure measurement in humans. [Last accessed on 2015 Dec 18];Circulation [Internet] 2005 111:697–716. Available from: http://www.ncbi.nlm.nih.gov/pubmed/15699287 . - PubMed
-
- Kuczmarski RJ, Ogden CL, Guo SS, Grummer-Strawn LM, Flegal KM, Mei Z, et al. 2000 CDC growth charts for the United States: Methods and development. [Last accessed on 2015 Dec 22];Vital and Health Statistics. 2002 11:1–190. Available from: https://www.cdc.gov/growthcharts/2000growthchart-us.pdf . - PubMed
LinkOut - more resources
Full Text Sources
Other Literature Sources