Staging of colorectal cancer using serum metabolomics with 1HNMR Spectroscopy
- PMID: 28852450
- PMCID: PMC5569592
- DOI: 10.22038/IJBMS.2017.9022
Staging of colorectal cancer using serum metabolomics with 1HNMR Spectroscopy
Abstract
Objectives: Determination of stages of colon cancer is done by biopsy usually after surgery. Metabolomics is the study of all the metabolites using LC-MS and 1HNMR spectroscopy with chemometric techniques. The stages of colon cancer were detected from patients' sera using 1HNMR.
Materials and methods: Five ml blood was collected from 16 confirmed patients referred for colonoscopy. One group of eight patients were diagnosed with stage 0 to I colon cancer and the second group of 8 patients with II-IV stage colon cancer. Sera were sent for 1HNMR. The differentiating metabolites were identified using HMDB and the metabolic cycles from Metaboanalyst.
Results: Six metabolites of which pyridoxine levels lowered, and glycine, cholesterol, taurocholic acid, cholesteryl ester and deoxyinosine increased.
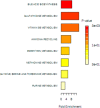
Conclusion: The different stages of cancer were identified by the main metabolic cycles such as primary bile acid biosynthesis, purine and vitamin B metabolic pathways and the glutathione cycle.
Keywords: 1HNuclear Magnetic -Resonance Spectroscopy; Colon cancer; Metabolomics; Serum; Staging.
Figures


References
-
- Seer Stat Fact Sheets. Colon and Rectum Cancer National cancer institute. Available at: http://seer.cancer.gov/statfacts/html/colorect.html .
-
- Safaee A, Fatemi SR, Ashtari S, Vahedi M, Moghimi-Dehkordi B. Four years incidence rate of colorectal cancer in Iran a survey of national cancer registry data implications for screening. Asian Pac J Cancer Prev. 2012;13:26952–2698. - PubMed
-
- Ansari R, Mahdavinia M, Sadjadi A, Nouraie M, Kamangar F, Bishehsari F, et al. Incidence and age distribution of colorectal cancer in Iran results of a population-based cancer registry. Cancer Lett. 2006;240:143–147. - PubMed
-
- Colon Cancer Treatment (PDQ®)-National cancer institute. Available at: http://www.cancer.gov/cancertopics/pdq/treatment/colon/Patient/p.2 .
-
- Nicholson JK, Lindon JC, Holmes E. Metabonomics: understanding the metabolic responses of living systems to pathophysiological stimuli via multivariate statistical analysis of biological NMR spectroscopic data. Xenobiotica. 1999;12:1181–1189. - PubMed
LinkOut - more resources
Full Text Sources
