. 2017 Aug 22:5:6.
doi: 10.1186/s40170-017-0168-x. eCollection 2017.

Metabolic profiling of triple-negative breast cancer cells reveals metabolic vulnerabilities

Affiliations

Metabolic profiling of triple-negative breast cancer cells reveals metabolic vulnerabilities

Nathan J Lanning et al. Cancer Metab. .

Abstract

Background: Among breast cancers, the triple-negative breast cancer (TNBC) subtype has the worst prognosis with no approved targeted therapies and only standard chemotherapy as the backbone of systemic therapy. Unique metabolic changes in cancer progression provide innovative therapeutic opportunities. The receptor tyrosine kinases (RTKs) epidermal growth factor receptor (EGFR), and MET receptor are highly expressed in TNBC, making both promising therapeutic targets. RTK signaling profoundly alters cellular metabolism by increasing glucose consumption and subsequently diverting glucose carbon sources into metabolic pathways necessary to support the tumorigenesis. Therefore, detailed metabolic profiles of TNBC subtypes and their response to tyrosine kinase inhibitors may identify therapeutic sensitivities.

Methods: We quantified the metabolic profiles of TNBC cell lines representing multiple TNBC subtypes using gas chromatography mass spectrometry. In addition, we subjected MDA-MB-231, MDA-MB-468, Hs578T, and HCC70 cell lines to metabolic flux analysis of basal and maximal glycolytic and mitochondrial oxidative rates. Metabolic pool size and flux measurements were performed in the presence and absence of the MET inhibitor, INC280/capmatinib, and the EGFR inhibitor, erlotinib. Further, the sensitivities of these cells to modulators of core metabolic pathways were determined. In addition, we annotated a rate-limiting metabolic enzymes library and performed a siRNA screen in combination with MET or EGFR inhibitors to validate synergistic effects.

Results: TNBC cell line models displayed significant metabolic heterogeneity with respect to basal and maximal metabolic rates and responses to RTK and metabolic pathway inhibitors. Comprehensive systems biology analysis of metabolic perturbations, combined siRNA and tyrosine kinase inhibitor screens identified a core set of TCA cycle and fatty acid pathways whose perturbation sensitizes TNBC cells to small molecule targeting of receptor tyrosine kinases.

Conclusions: Similar to the genomic heterogeneity observed in TNBC, our results reveal metabolic heterogeneity among TNBC subtypes and demonstrate that understanding metabolic profiles and drug responses may prove valuable in targeting TNBC subtypes and identifying therapeutic susceptibilities in TNBC patients. Perturbation of metabolic pathways sensitizes TNBC to inhibition of receptor tyrosine kinases. Such metabolic vulnerabilities offer promise for effective therapeutic targeting for TNBC patients.

Keywords: Metabolic inhibitor; Metabolism; Rate-limiting enzymes; Receptor tyrosine kinase; Triple-negative breast cancer; Tyrosine kinase inhibitor.


Conflict of interest statement

Ethics approval and consent to participate

Not applicable.

Consent for publication

Not applicable.

Competing interests

The authors declare that they have no competing interests.

Publisher’s Note

Springer Nature remains neutral with regard to jurisdictional claims in published maps and institutional affiliations.

Figures
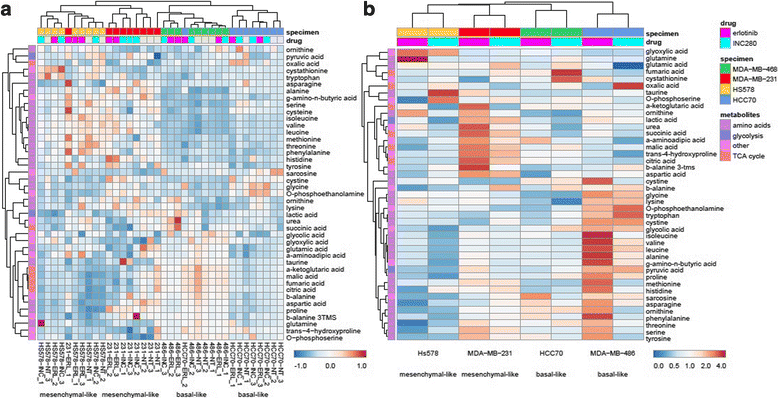
Fig. 1
Fig. 1
Metabolomics profiling of TNBC cell lines. Hierarchical clustering of metabolic profiles of TNBC cell lines reveals molecular heterogeneity between subtypes. a Pool size measurements show common clusters of low TCA cycle and elevated amino acid metabolites of mesenchymal-like subtype cell lines MDA-MB-231 and Hs578 vs basal-like subtypes HCC70 and MDA-MB-456. b Clustering of drug responses of TNBC cell lines (average ratios of metabolite concentrations in conditions INC280/vehicle and erlotinib/vehicle are plotted for each set of biological triplicates). Drug perturbations of reduced amino acid pool sizes show similar response of reduced amino acid pool sizes upon receptor tyrosine kinase inhibitor treatment of mesenchymal-like subtype MDA-MB-231 and Hs578 cell lines. INC280/capmatinib was used to inhibit proto-oncogene MET receptor tyrosine kinase, and erlotinib was used to inhibit receptor tyrosine kinase and growth factor receptor EGFR in TNBC cell lines
Fig. 2
Fig. 2
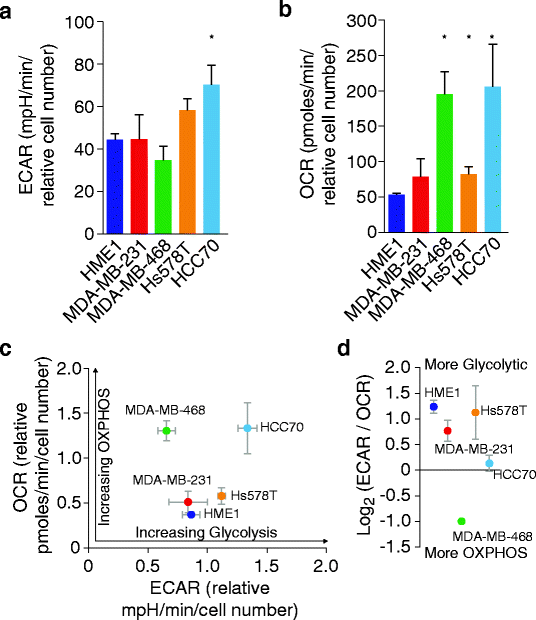
TNBC basal metabolic profiles. a Cells were maintained in uniform media for 24 h prior to measuring ECAR. ECAR values were normalized to total cell numbers for each cell line in the ECAR assay. Data are ECAR averages from four experiments, each with five biological replicates. Error bars represent SEM. Asterisks indicate significance compared to HME1 cell values (p ≤ 0.05). b Cells were maintained in uniform media for 24 h prior to measuring OCR. OCR values were normalized to total cell numbers for each cell line in the OCR assay. Data are OCR averages from four experiments, each with three biological replicates. Error bars represent SEM. Asterisks indicate significance compared to HME1 cell values (p ≤ 0.05). c Relative ECAR and OCR data from a and b were plotted simultaneously to reveal overall relative basal metabolic profiles for each cell model. d The ECAR/OCR ratio of the data in d was log2 transformed to provide an index of each cell model’s comparative utilization of glycolytic and oxidative metabolism
Fig. 3
Fig. 3
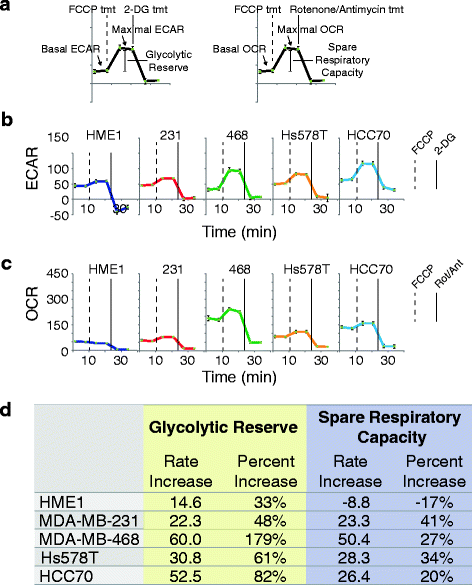
TNBC maximal metabolic profiles. a Schematic indicating derivation of maximal metabolic rates, glycolytic reserve, and spare respiratory capacity from the experiments in (a) and (b). b Cells were maintained in uniform media prior to measuring ECAR. ECAR was measured twice in the basal state, and then twice again following each metabolic inhibitor treatment (1 μM FCCP, 50 mM 2-deoxyglucose) at 7 minute intervals. ECAR values were normalized to a measurement of total cell numbers for each cell line in the ECAR assay. Data are ECAR averages from one representative experiment, with error bars representing SD. c Cells were maintained in uniform media prior to measuring OCR. OCR was measured twice in the basal state, and then twice again following each metabolic inhibitor treatment (1 μM FCCP, 1 μM rotenone + 1 μM antimycin) at 7 minute intervals. OCR values were normalized to a measurement of total cell numbers for each cell line in the OCR assay. Data are OCR averages from one representative experiment, with error bars representing SD. d Glycolytic reserve (derived from b) and spare respiratory capacity (derived from c) calculations. Data are expressed as actual rate unit increase and percent increase over basal rates. Rate increases were calculated by subtracting the basal rate values from the maximal rate values. Percent increases were calculated by dividing the rate increase values by the basal values
Fig. 4
Fig. 4
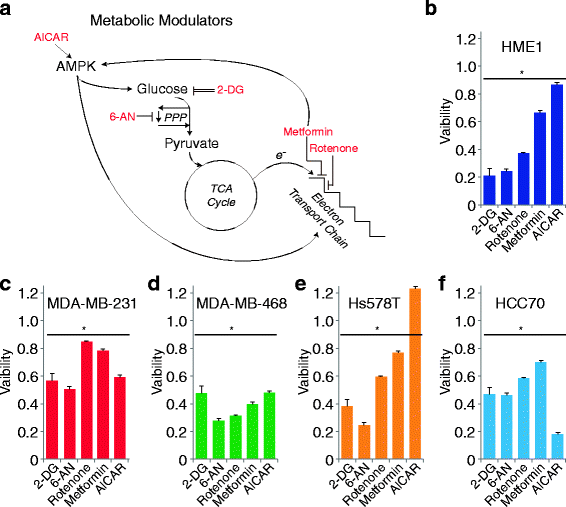
TNBC response to metabolic modulators. a Schematic of metabolic pathways and the points at which chemical inhibitors or activators act. bd Viability measurements of cells following 48 h of treatment with indicated chemicals: 25 mM 2-DG, 200 μM 6-AN, 1 μM rotenone, 10 mM metformin, and 1 mM AICAR. Data are viability averages from one representative experiment with error bars representing SD. Asterisks represent significance compared to vehicle control (p ≤ 0.01)
Fig. 5
Fig. 5
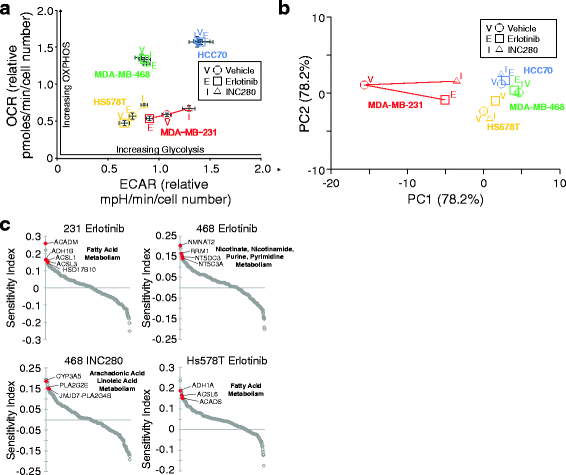
RTK-dependent TNBC sensitization to metabolic pathway perturbation. a Metabolic rate response to RTK inhibitors. 40,000 cells per well were plated in Seahorse 96-well assay plates. Cells were treated for 24 h with the DMSO, erlotinib, or INC280, and then ECAR and OCR were measured as described in Methods. b Principle component analysis of drug responses. Mesenchymal-like subtype MDA-MB-231 and Hs578 cell lines show largest perturbations. c RNAi screen results for selected TKI treatments which induce sensitivities to knockdown of common metabolic pathway genes

Similar articles

Cited by

References

    1. Foulkes WD, Smith IE, Reis-Filho JS. Triple-negative breast cancer. N Engl J Med. 2010;363:1938–1948. doi: 10.1056/NEJMra1001389. - DOI - PubMed
    1. Dent R, Trudeau M, Pritchard KI, Hanna WM, Kahn HK, Sawka CA, Lickley LA, Rawlinson E, Sun P, Narod SA. Triple-negative breast cancer: clinical features and patterns of recurrence. Clin Cancer Res. 2007;13(15 Pt 1):4429–4434. doi: 10.1158/1078-0432.CCR-06-3045. - DOI - PubMed
    1. Liedtke C, Mazouni C, Hess KR, André F, Tordai A, Mejia JA, Symmans WF, Gonzalez-Angulo AM, Hennessy B, Green M, Cristofanilli M, Hortobagyi GN, Pusztai L. Response to neoadjuvant therapy and long-term survival in patients with triple-negative breast cancer. J Clin Oncol. 2008;26:1275–1281. doi: 10.1200/JCO.2007.14.4147. - DOI - PubMed
    1. Lehmann BD, Bauer JA, Chen X, Sanders ME, Chakravarthy AB, Shyr Y, Pietenpol JA. Identification of human triple-negative breast cancer subtypes and preclinical models for selection of targeted therapies. J Clin Invest. 2011;121:2750–2767. doi: 10.1172/JCI45014. - DOI - PMC - PubMed
    1. Burstein MD, Tsimelzon A, Poage GM, Covington KR, Contreras A, Fuqua SAW, Savage MI, Osborne CK, Hilsenbeck SG, Chang JC, Mills GB, Lau CC, Brown PH. Comprehensive genomic analysis identifies novel subtypes and targets of triple-negative breast cancer. Clin Cancer Res. 2015;21:1688–1698. doi: 10.1158/1078-0432.CCR-14-0432. - DOI - PMC - PubMed