. 2017 Dec;203(12):959-972.
doi: 10.1007/s00359-017-1209-1. Epub 2017 Aug 29.

Take time: odor coding capacity across sensory neurons increases over time in Drosophila

Affiliations

Take time: odor coding capacity across sensory neurons increases over time in Drosophila

Daniel Münch et al. J Comp Physiol A Neuroethol Sens Neural Behav Physiol. 2017 Dec.

Abstract

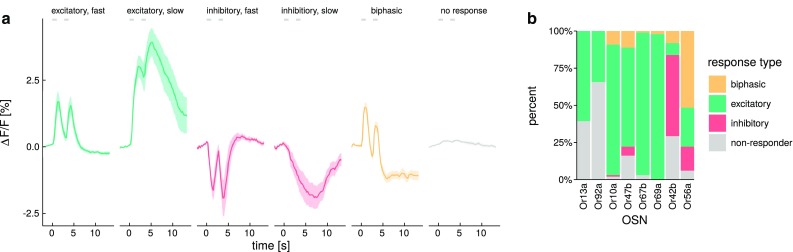
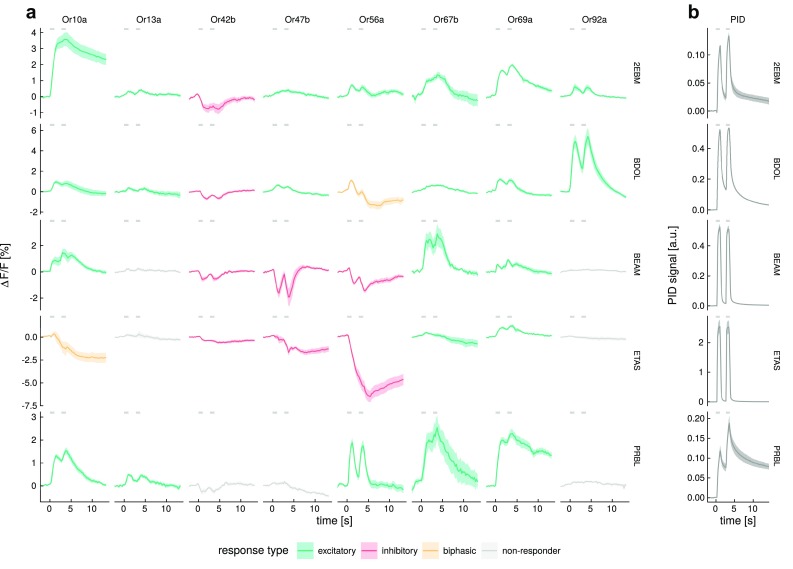
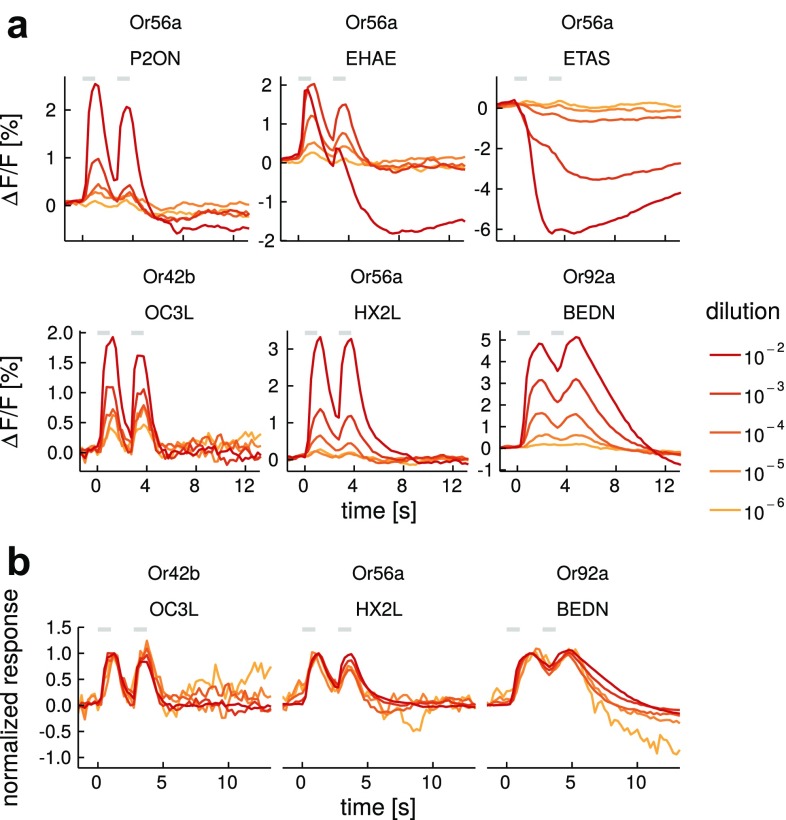
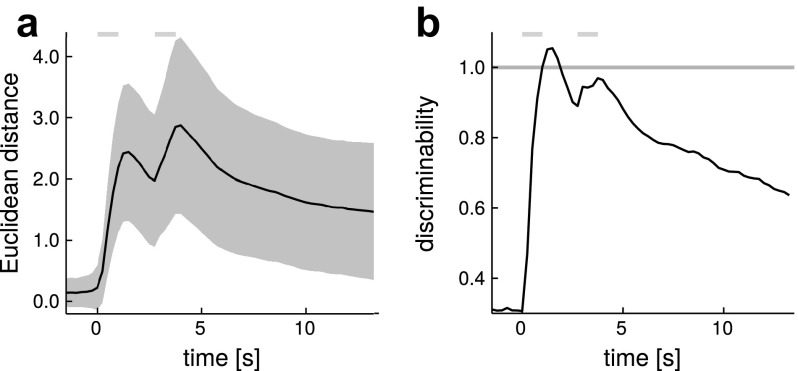
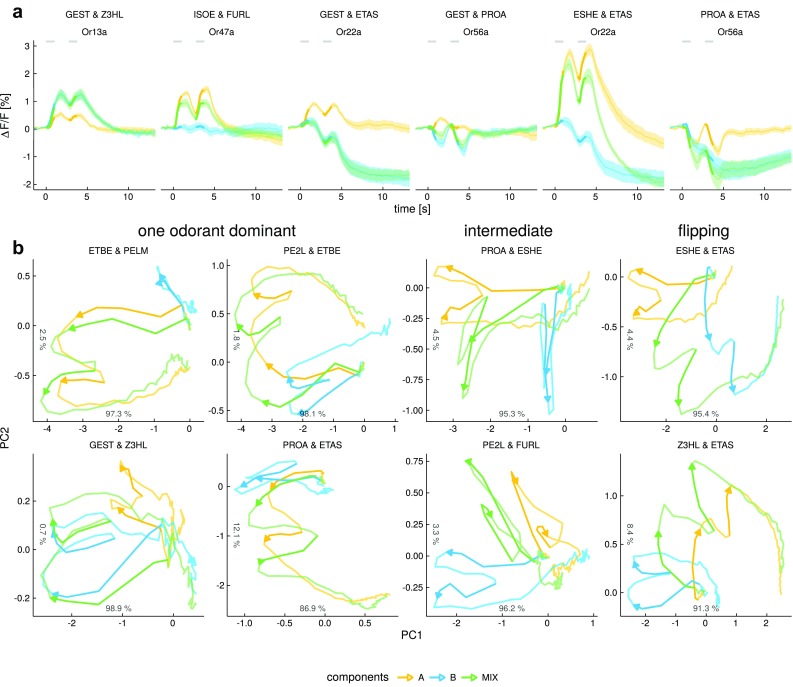
Due to the highly efficient olfactory code, olfactory sensory systems are able to reliably encode enormous numbers of olfactory stimuli. The olfactory code consists of combinatorial activation patterns across sensory neurons, thus its capacity exceeds the number of involved classes of sensory neurons by a manifold. Activation patterns are not static but vary over time, caused by the temporally complex response dynamics of the individual sensory neuron responses. We systematically analyzed the temporal dynamics of olfactory sensory neuron responses to a diverse set of odorants. We find that response dynamics depend on the combination of sensory neuron and odorant and that information about odorant identity can be extracted from the time course of the response. We also show that new response dynamics can arise when mixing two odorants. Our data show that temporal dynamics of odorant responses are able to significantly enhance the coding capacity of olfactory sensory systems.

Keywords: Adaptation; Combinatorial code; Odor mixture; Olfaction; Temporal code.


Conflict of interest statement

The authors declare no conflict of interest.

Figures

Fig. 1
Fig. 1
Response dynamics are temporally diverse. All odorants given at 10-2 dilution. a The different response dynamics we observed could be grouped into four different categories. Excitatory and inhibitory responses could be further subdivided into “fast” and “slow” responses. Traces are given as average of n = 4–10 animals, shades indicate SEM. Gray segments indicate the stimulation times. b The four main response types were differentially distributed across OSN classes. Response types were automatically defined, responses with maxima below a threshold of |0.3%|ΔF/F (±2.5×SD before stimulus onset) were defined as “non-responders” (see “Material and methods” for details)
Fig. 2
Fig. 2
Response dynamics depend on the odorant–OSN combination. a Example calcium imaging response traces for eight OSNs stimulated with five odorants. Traces are given as average of n = 4–13 animals, shades indicate SEM, colors indicate response type as in Fig. 1. b PID measurements of the stimulus dynamics for the five example odorants. Traces are given as average of n = 1–3 independent measurements. See Fig. S2 for response traces and PID measurements of all 99 odorants. For a list of odorant abbreviations see Table S1. Gray segments indicate the stimulation times
Fig. 3
Fig. 3
Response dynamics are stable across a concentration range. a Recordings of five odorant–OSN combinations at five dilution steps. Traces are given as average of n = 3–17 animals. Colors indicate different dilutions. b Same recordings as in the lower panel in a but normalized to the first response peak. Gray segments indicate the stimulation times. For a list of odorant abbreviations see Table S1
Fig. 4
Fig. 4
Odorant pattern difference peaks during stimulation. a The average Euclidean distances between response patterns of all possible odorant pairs. Shades indicate the variability within the repeated measurements of a given odorant (see “Material and methods” for details), gray segments indicate the stimulation times. b Average discriminability of all possible pairs of odorants. The discriminability measure was derived from dividing Euclidean distances by the variability within repeated measurements of an odorant (see “Material and methods” for details). Gray shades indicate SEM, gray segments indicate the stimulation times
Fig. 5
Fig. 5
Odorant identity information increases over time. a Schematic showing the time points of the recordings that were used for the classification shown in b and d. Black traces are averages across all recordings of a given response type. Colors indicate the different time points used in the classification (compare to b), gray segments indicate the stimulation times. b Boxplot of the classifier performance at different time points. control classification with shuffled odor labels, peak 1 and peak 2 five time points around the 1st and 2nd response peak, peak 2 shift classification run on peak 2 but with the activity right prior to peak 2 shifted to baseline, trace five time points spread across the recording, trace-shuffled classification run on the trace frames but with scrambled time information. all comprises all odorants, set 1 contains the top quartile with the 25 strongest odorants (quantified as mean absolute peak response across OSNs), set 2 contains 2nd best quartile of odorants (see Table S2 for a list of odorants and Fig. S4 for data regarding sets 3 and 4). All differences between classifications at different time points were significant (Kruskal–Wallis rank sum test with a Bonferroni corrected Dunn’s post hoc test, p < 0.01). Boxplots indicate median, lower, and upper quartile, whiskers extend to the lowest and highest values that lie within 1.5 times the inter-quartile range from the box, data beyond the whiskers are treated as outliers and indicated as points, asterisks indicate the mean. c The differences between the classifier performances at peak1 and trace. Error bars indicate SEM. Different letters indicate significant differences between groups (Kruskal–Wallis rank sum test with a Bonferroni corrected Dunn’s post hoc test, p < 0.01) d Correct classifications and classification errors in the sets of the strongest and the weakest odorants at the different time points, visualized as confusion matrices. The values along the diagonal represent classification reliability. See Table S1 for a complete list of odorant names and abbreviations
Fig. 6
Fig. 6
Response dynamics of binary mixtures. a Response traces elicited from binary mixtures of odorants. The mixture trace is shown in green, the components are shown in yellow and blue, gray segments indicate the stimulation times. Concentration of the components was the same when tested alone or in the mixture (1×10⁻³vol/vol dilution). Traces are given as average of n = 7–16 animals. b Principal component trajectories of mixture and component responses. Trajectories show how the odor response pattern of the five analyzed OSNs develops over time. Same color code as in a. Numbers on the axes indicate the percentage of variance explained by the corresponding principal component. Times of odorant stimulation are indicated by darker arrows pointing in the direction of time. See Table S1 for a complete list of odorant names and abbreviations and Figs. S7 and S8 for data of all mixtures tested

Similar articles

Cited by

References

    1. Abraham NM, Spors H, Carleton A, Margrie TW, Kuner T, Schaefer AT. Maintaining accuracy at the expense of speed: stimulus similarity defines odor discrimination time in mice. Neuron. 2004;44(5):865–876. - PubMed
    1. Benton R, Vannice KS, Gomez-Diaz C, Vosshall LB. Variant ionotropic glutamate receptors as chemosensory receptors in Drosophila. Cell. 2009;136(1):149–62. doi: 10.1016/j.cell.2008.12.001. - DOI - PMC - PubMed
    1. Campbell RAA, Honegger KS, Qin H, Li W, Demir E, Turner GC (2013) Imaging a population code for odor identity in the Drosophila mushroom body. J Neurosci 33(25):10,568–10,581. doi:10.1523/JNEUROSCI.0682-12.2013 - PMC - PubMed
    1. Chertemps T, François A, Durand N, Rosell G, Dekker T, Lucas P, Maïbèche-Coisne M. A carboxylesterase, esterase-6, modulates sensory physiological and behavioral response dynamics to pheromone in Drosophila. BMC Biol. 2012;10(1):56. doi: 10.1186/1741-7007-10-56. - DOI - PMC - PubMed
    1. Costa T, Herz A. Antagonists with negative intrinsic activity at delta opioid receptors coupled to GTP-binding proteins. Proc Natl Acad Sci. 1989;86(19):7321–7325. doi: 10.1073/pnas.86.19.7321. - DOI - PMC - PubMed

LinkOut - more resources