

Neuronal connections of the central amygdalar nucleus with refeeding-activated brain areas in rats
- PMID: 28852859
- PMCID: PMC5773374
- DOI: 10.1007/s00429-017-1501-4
Neuronal connections of the central amygdalar nucleus with refeeding-activated brain areas in rats
Abstract
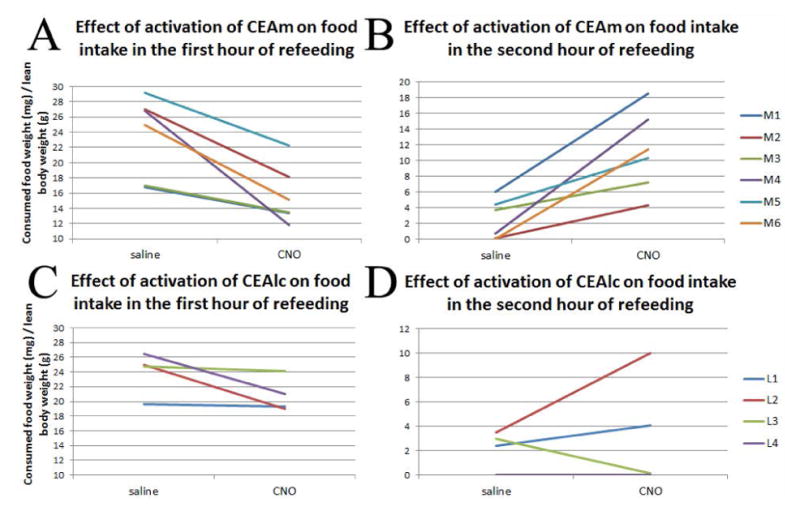
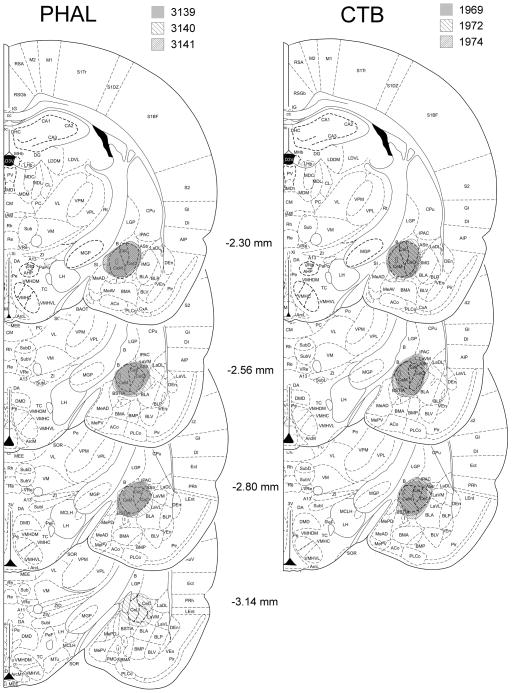
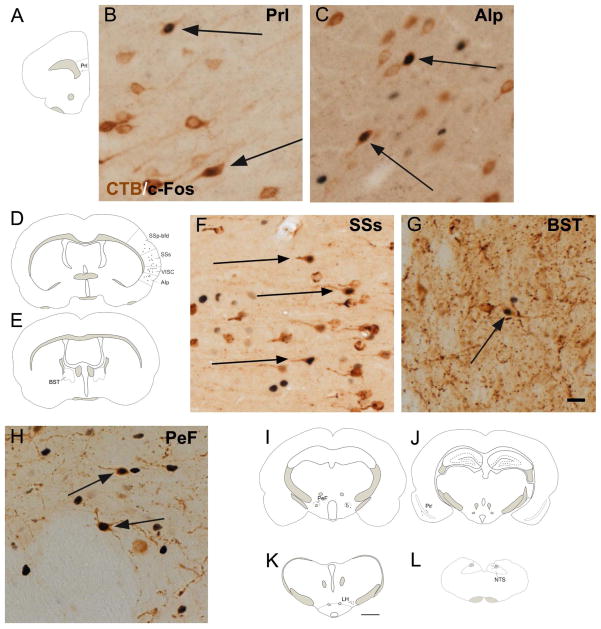
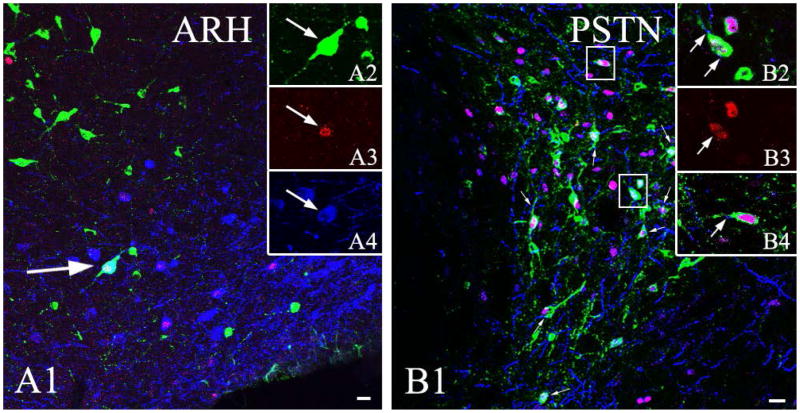
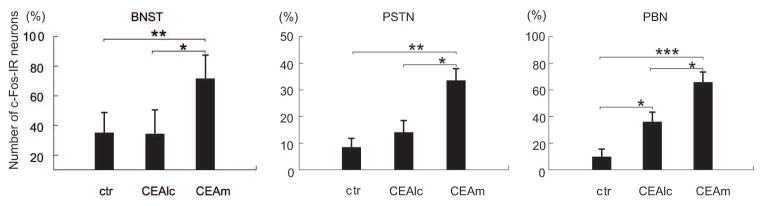
Following fasting, satiety is accompanied by neuronal activation in brain areas including the central amygdalar nucleus (CEA). Since CEA is known to inhibit food intake, we hypothesized that CEA contributes to the termination of meal during refeeding. To better understand the organization of this satiety-related circuit, the interconnections of the CEA with refeeding-activated neuronal groups were elucidated using retrograde (cholera toxin-β subunit, CTB) and anterograde (phaseolus vulgaris leucoagglutinin, PHA-L) tracers in male rats. C-Fos-immunoreactivity was used as marker of neuronal activation. The refeeding-activated input of the CEA primarily originated from the paraventricular thalamic, parasubthalamic and parabrachial nuclei. Few CTB-c-Fos double-labeled neurons were detected in the prefrontal cortex, lateral hypothalamic area, nucleus of the solitary tract (NTS) and the bed nuclei of the stria terminalis (BNST). Only few refeeding-activated proopiomelanocortin-producing neurons of the arcuate nucleus projected to the CEA. Anterograde tract tracing revealed a high density of PHAL-labeled axons contacted with refeeding-activated neurons in the BNST, lateral hypothalamic area, parasubthalamic, paraventricular thalamic and parabrachial nuclei and NTS; a low density of labeled axons was found in the paraventricular hypothalamic nucleus. Chemogenetic activation of the medial CEA (CEAm) inhibited food intake during the first hour of refeeding, while activation of lateral CEA had no effect. These data demonstrate the existence of reciprocal connections between the CEA and distinct refeeding-activated hypothalamic, thalamic and brainstem nuclei, suggesting the importance of short feedback loops in the regulation of satiety and importance of the CEAm in the regulation of food intake during refeeding.
Keywords: Anterograde tract tracing; Connectivity map; Parabrachial nucleus; Parasubthalamic nucleus; Retrograde tract tracing; Satiety; c-Fos.
Conflict of interest statement
Figures

 indicates a high density of PHA-L fibers, whereas
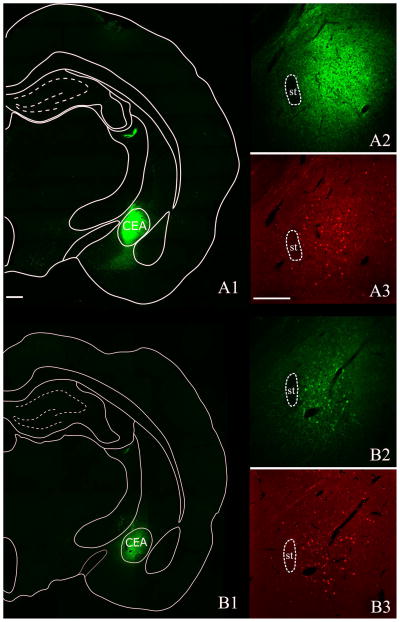
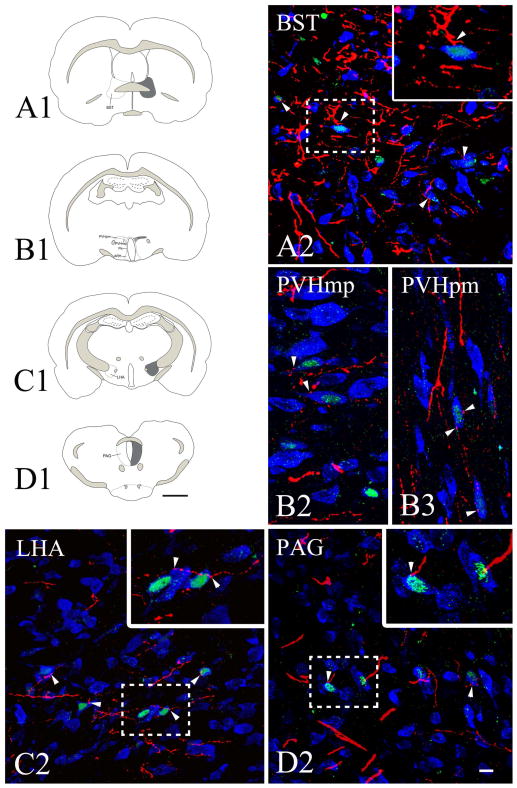
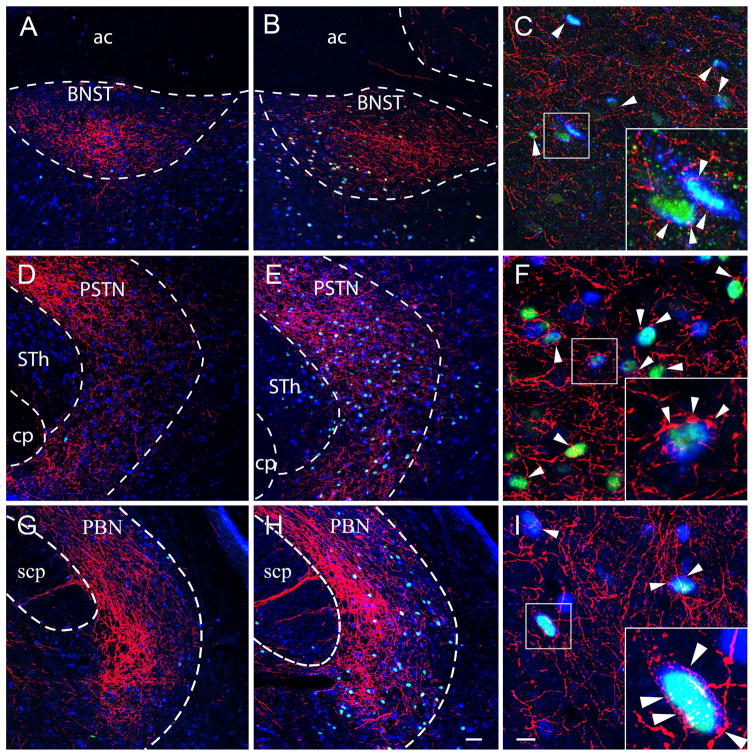
 indicates a low density of PHA-L fibers. Confocal images illustrate PHA-L (red) fibers among refeeding-activated neurons. Arrowheads point to PHA-L-immunoreactive (red) contacts on c-Fos (green)/HuCD (blue) double-labeled neurons. Higher magnification of framed areas is shown in the insets. Scale bars: 500μm in the schematic drawings and 20μm in the confocal images.
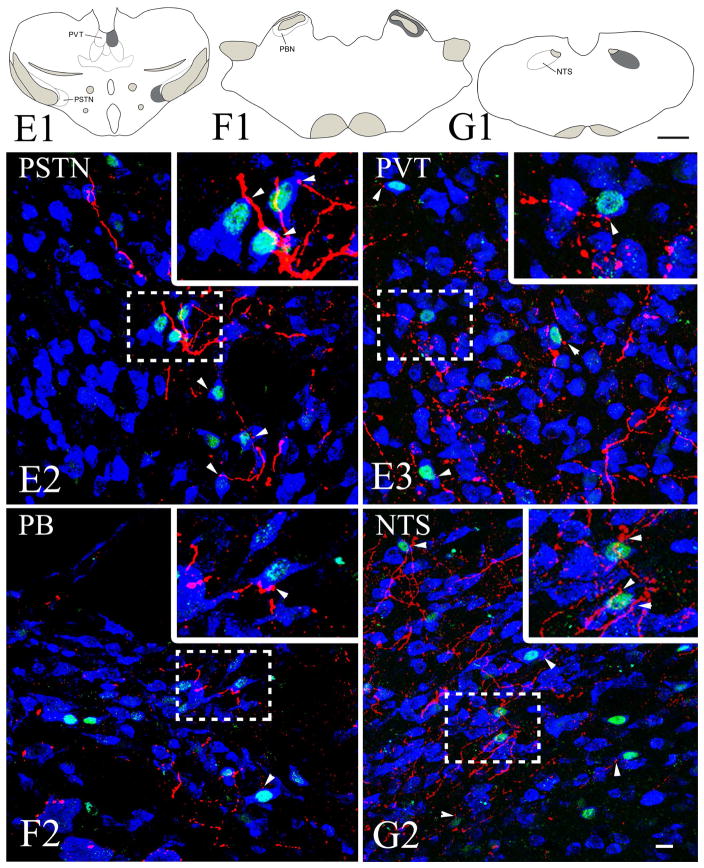 indicates a high density of PHA-L fibers, whereas
indicates a low density of PHA-L fibers. Confocal images illustrate PHA-L (red) fibers among refeeding-activated neurons. Arrowheads point to PHA-L-immunoreactive (red) contacts on c-Fos (green)/HuCD (blue) double-labeled neurons. Higher magnification of framed areas is shown in the insets. Scale bars: 500μm in the schematic drawings and 20μm in the confocal images.
indicates a high density of PHA-L fibers, whereas
indicates a low density of PHA-L fibers. Confocal images illustrate PHA-L (red) fibers among refeeding-activated neurons. Arrowheads point to PHA-L-immunoreactive (red) contacts on c-Fos (green)/HuCD (blue) double-labeled neurons. Higher magnification of framed areas is shown in the insets. Scale bars: 500μm in the schematic drawings and 20μm in the confocal images.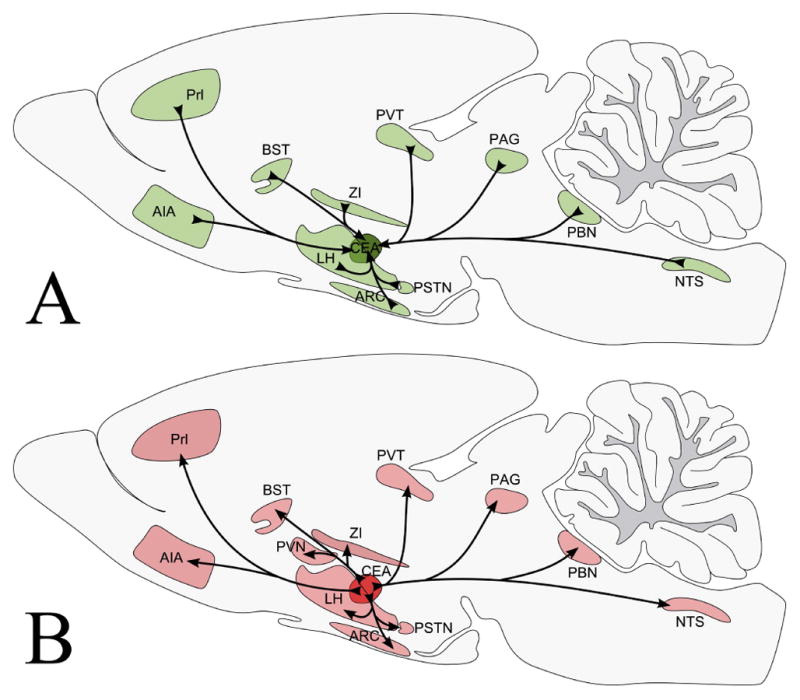
References
-
- Alexander GM, Rogan SC, Abbas AI, Armbruster BN, Pei Y, Allen JA, Nonneman RJ, Hartmann J, Moy SS, Nicolelis MA, McNamara JO, Roth BL. Remote control of neuronal activity in transgenic mice expressing evolved G protein-coupled receptors. Neuron. 2009;63(1):27–39. doi: 10.1016/j.neuron.2009.06.014. - DOI - PMC - PubMed
-
- Baldwin AE, Holahan MR, Sadeghian K, Kelley AE. N-methyl-D-aspartate receptor-dependent plasticity within a distributed corticostriatal network mediates appetitive instrumental learning. Behavioral neuroscience. 2000;114(1):84–98. - PubMed
-
- Balleine BW, Dickinson A. Goal-directed instrumental action: contingency and incentive learning and their cortical substrates. Neuropharmacology. 1998;37(4–5):407–419. - PubMed
MeSH terms
Substances
Grants and funding
LinkOut - more resources
Full Text Sources
Other Literature Sources
