

In situ analysis of FGFR2 mRNA and comparison with FGFR2 gene copy number by dual-color in situ hybridization in a large cohort of gastric cancer patients
- PMID: 28852882
- PMCID: PMC5906494
- DOI: 10.1007/s10120-017-0758-x
In situ analysis of FGFR2 mRNA and comparison with FGFR2 gene copy number by dual-color in situ hybridization in a large cohort of gastric cancer patients
Abstract
Background: Fibroblast growth factor receptor (FGFR2) has been proposed as a target in gastric cancer. However, appropriate methods to select patients for anti-FGFR2 therapies have not yet been established.
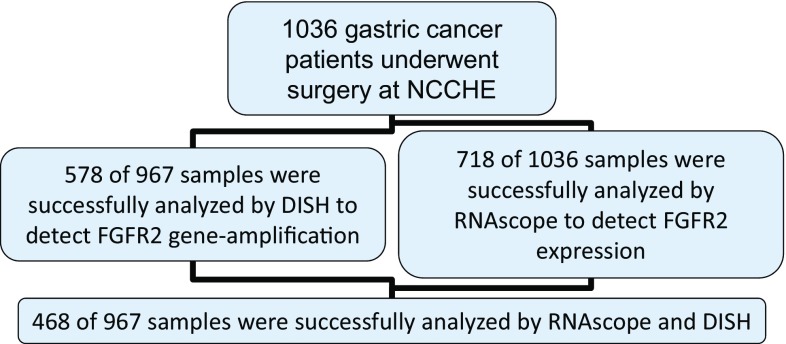
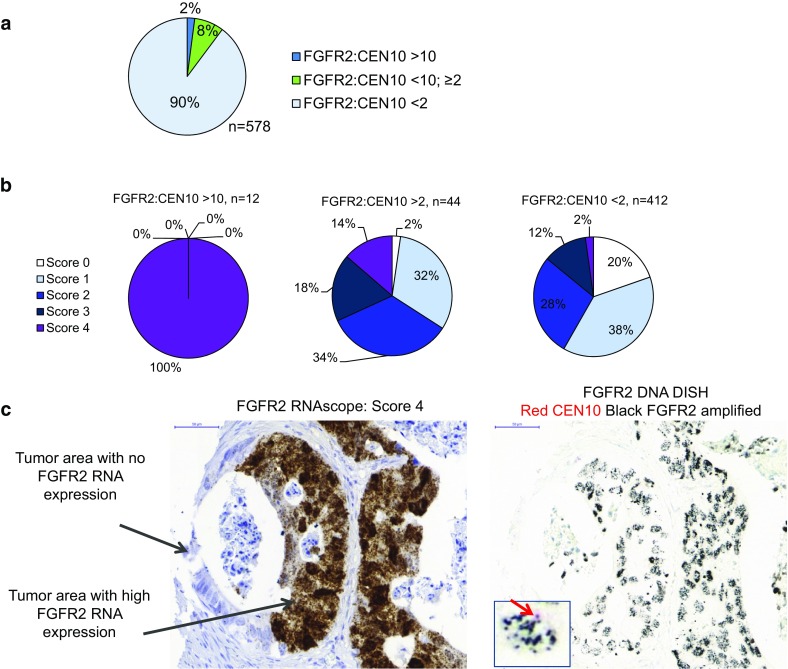
Methods: We used in situ techniques to investigate FGFR2 mRNA expression and gene amplification in a large cohort of 1036 Japanese gastric cancer patients. FGFR2 mRNA expression was determined by RNAscope. FGFR2 gene amplification was determined by dual-color in situ hybridization (DISH).
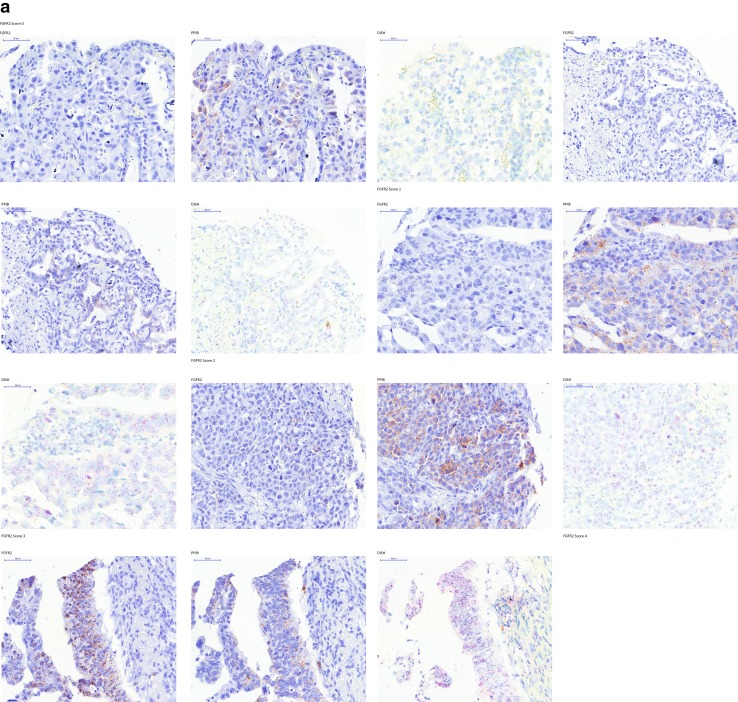
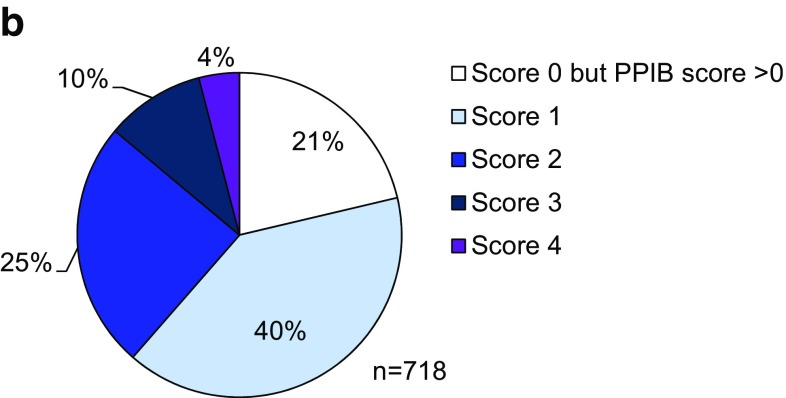
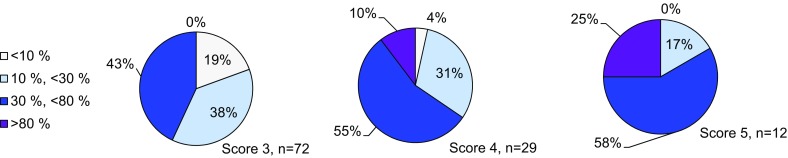
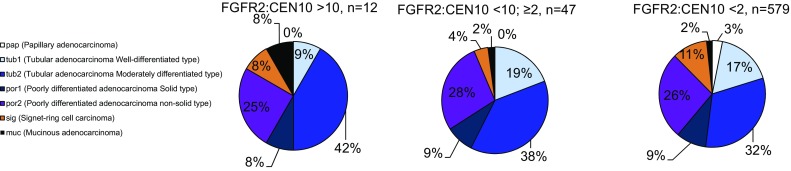
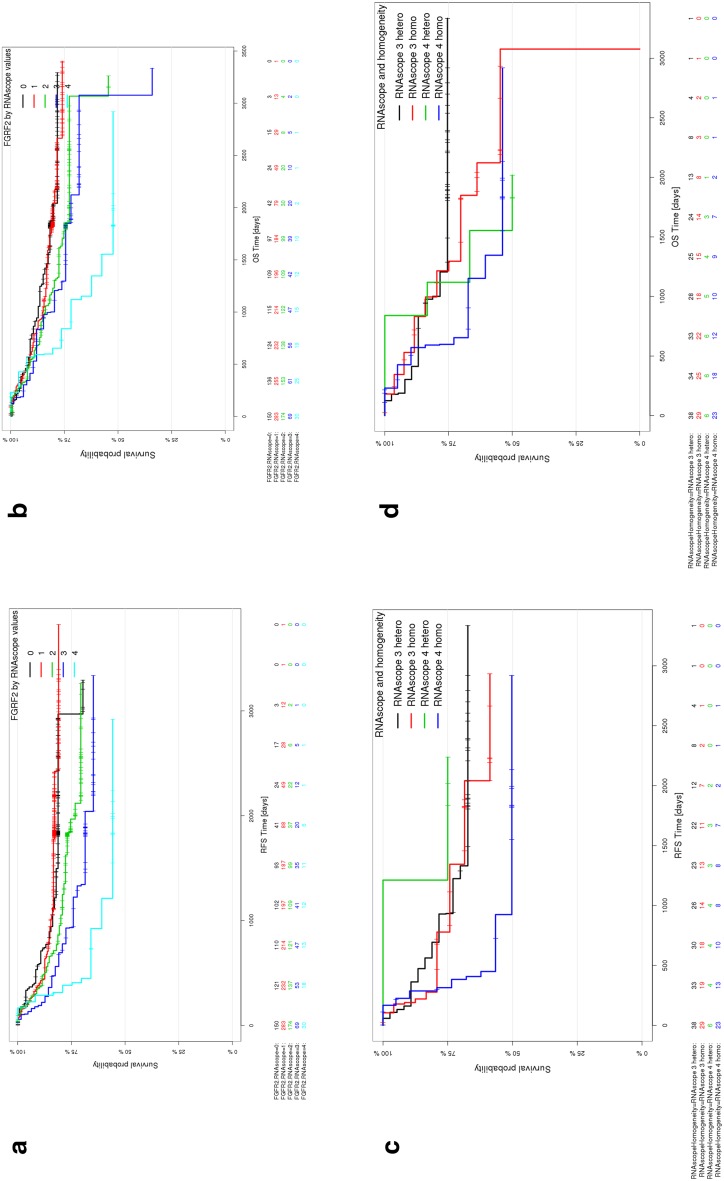
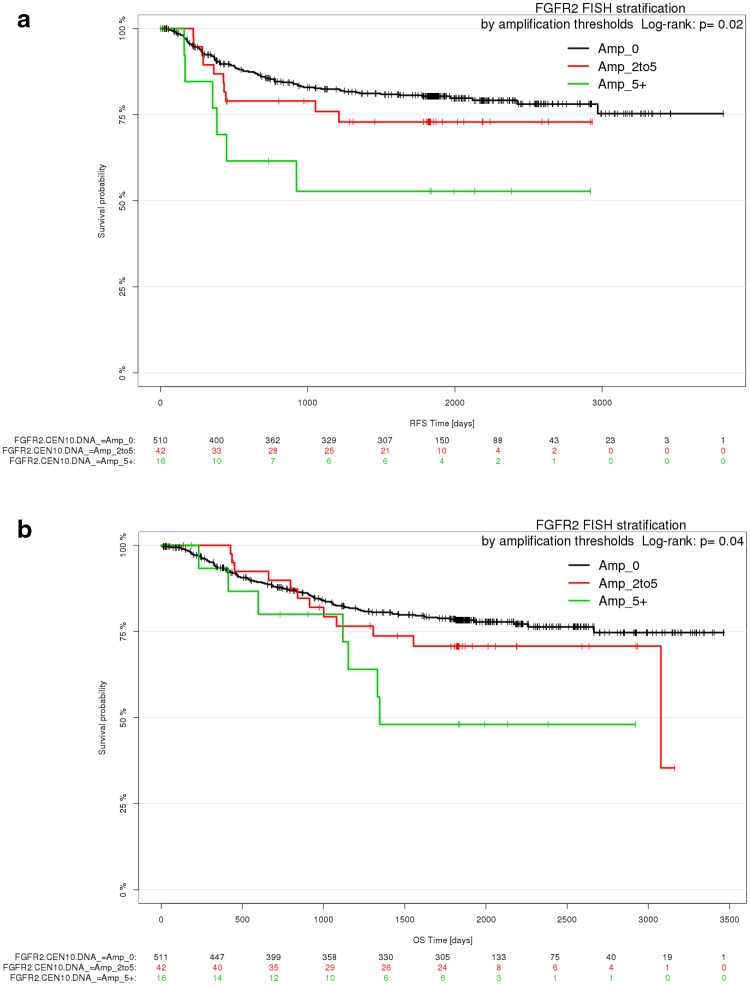
Results: We successfully analyzed 578 and 718 samples by DISH and RNAscope, respectively; 2% (12/578) showed strong FGFR2 gene amplification (FGFR2:CEN10 >10); moderate FGFR2 gene amplification (FGFR2:CEN10 <10; ≥2) was detected in 8% (47/578); and high FGFR2 mRNA expression of score 4 (>10 dots/cell and >10% of positive cells with dot clusters under a 20× objective) was seen in 4% (29/718). For 468 samples, both mRNA and DISH data were available. FGFR2 mRNA expression levels were associated with gene amplification; FGFR2 mRNA levels were highest in the highly amplified samples (n = 12). All highly amplified samples showed very strong FGFR2 mRNA expression (dense clusters of the signal visible under a 1× objective). Patients with very strong FGFR2 mRNA expression showed more homogeneous FGFR2 mRNA expression compared to patients with lower FGFGR2 mRNA expression. Gastric cancer patients with tumors that had an FGFR2 mRNA expression score of 4 had shorter RFS compared with score 0-3 patients.
Conclusion: RNAscope and DISH are suitable methods to evaluate FGFR2 status in gastric cancer. Formalin-fixed paraffin-embedded (FFPE) tissue slides allowed evaluation of the intratumor heterogeneity of these FGFR2 biomarkers.
Keywords: Fibroblast growth factor receptors 2; Gene amplification; In situ hybridization; Molecular targeted therapy; Stomach neoplasms.
Conflict of interest statement
Ethical statement
All procedures followed were in accordance with the ethical standards of the responsible committee on human experimentation (institutional and national) and with the Helsinki Declaration of 1964 and later versions.
Informed consent
Informed consent or a substitute for it was obtained from all patients for being included in the study.
Conflict of interest
Yasutoshi Kuboki, Akiko Nagatsuma, and Atsushi Ochiai have received research grants from Bayer AG. Christoph A. Schatz, Karl Koechert, Sabine Schubert, Sabine Wittemer-Rump, Karl Ziegelbauer, and Thomas Krahn are full-time employees of Bayer AG. Janine Feng is a full-time employee of Ventana Medical Systems, Inc.
Figures
Similar articles
-
The beginning of the era of precision medicine for gastric cancer with fibroblast growth factor receptor 2 aberration.Gastric Cancer. 2021 Nov;24(6):1169-1183. doi: 10.1007/s10120-021-01235-z. Epub 2021 Aug 16. Gastric Cancer. 2021. PMID: 34398359 Review.
-
FGFR2 Assessment in Gastric Cancer Using Quantitative Real-Time Polymerase Chain Reaction, Fluorescent In Situ Hybridization, and Immunohistochemistry.Am J Clin Pathol. 2015 Jun;143(6):865-72. doi: 10.1309/AJCPNFLSMWWPP8DR. Am J Clin Pathol. 2015. PMID: 25972329
-
FGFR2 gene amplification and clinicopathological features in gastric cancer.Br J Cancer. 2012 Feb 14;106(4):727-32. doi: 10.1038/bjc.2011.603. Epub 2012 Jan 12. Br J Cancer. 2012. PMID: 22240789 Free PMC article.
-
Evaluation of Fibroblast Growth Factor Receptor 2 Expression, Heterogeneity and Clinical Significance in Gastric Cancer.Pathobiology. 2015;82(6):269-79. doi: 10.1159/000441149. Epub 2015 Oct 31. Pathobiology. 2015. PMID: 26516773
-
Targeting the fibroblast growth factor receptor 2 in gastric cancer: promise or pitfall?Ann Oncol. 2017 Jun 1;28(6):1207-1216. doi: 10.1093/annonc/mdx081. Ann Oncol. 2017. PMID: 28327938 Review.
Cited by
-
The beginning of the era of precision medicine for gastric cancer with fibroblast growth factor receptor 2 aberration.Gastric Cancer. 2021 Nov;24(6):1169-1183. doi: 10.1007/s10120-021-01235-z. Epub 2021 Aug 16. Gastric Cancer. 2021. PMID: 34398359 Review.
-
Long Non-coding RNA ASNR Targeting miR-519e-5p Promotes Gastric Cancer Development by Regulating FGFR2.Front Cell Dev Biol. 2021 Jul 9;9:679176. doi: 10.3389/fcell.2021.679176. eCollection 2021. Front Cell Dev Biol. 2021. PMID: 34307360 Free PMC article.
-
FGFR2-amplified tumor clones are markedly heterogeneously distributed in carcinomas of the upper gastrointestinal tract.J Cancer Res Clin Oncol. 2023 Jul;149(8):5289-5300. doi: 10.1007/s00432-022-04460-w. Epub 2022 Nov 23. J Cancer Res Clin Oncol. 2023. PMID: 36416959 Free PMC article.
-
Comprehensive analysis of the prognostic value and immune infiltration of FGFR family members in gastric cancer.Front Oncol. 2022 Sep 6;12:936952. doi: 10.3389/fonc.2022.936952. eCollection 2022. Front Oncol. 2022. PMID: 36147913 Free PMC article.
-
Targeting the Oncogenic FGF-FGFR Axis in Gastric Carcinogenesis.Cells. 2019 Jun 25;8(6):637. doi: 10.3390/cells8060637. Cells. 2019. PMID: 31242658 Free PMC article. Review.
References
-
- Bang YJ, Van Cutsem E, Feyereislova A, Chung HC, Shen L, Sawaki A, et al. Trastuzumab in combination with chemotherapy versus chemotherapy alone for treatment of HER2-positive advanced gastric or gastro-oesophageal junction cancer (ToGA): a phase 3, open-label, randomised controlled trial. Lancet. 2010;376:687–697. doi: 10.1016/S0140-6736(10)61121-X. - DOI - PubMed
Publication types
MeSH terms
Substances
LinkOut - more resources
Full Text Sources
Other Literature Sources
Medical
Miscellaneous
