. 2017 Dec 1;196(11):1443-1455.
doi: 10.1164/rccm.201610-2157OC.

Lung Endothelial MicroRNA-1 Regulates Tumor Growth and Angiogenesis

Affiliations

Lung Endothelial MicroRNA-1 Regulates Tumor Growth and Angiogenesis

Asawari Korde et al. Am J Respir Crit Care Med. .

Abstract

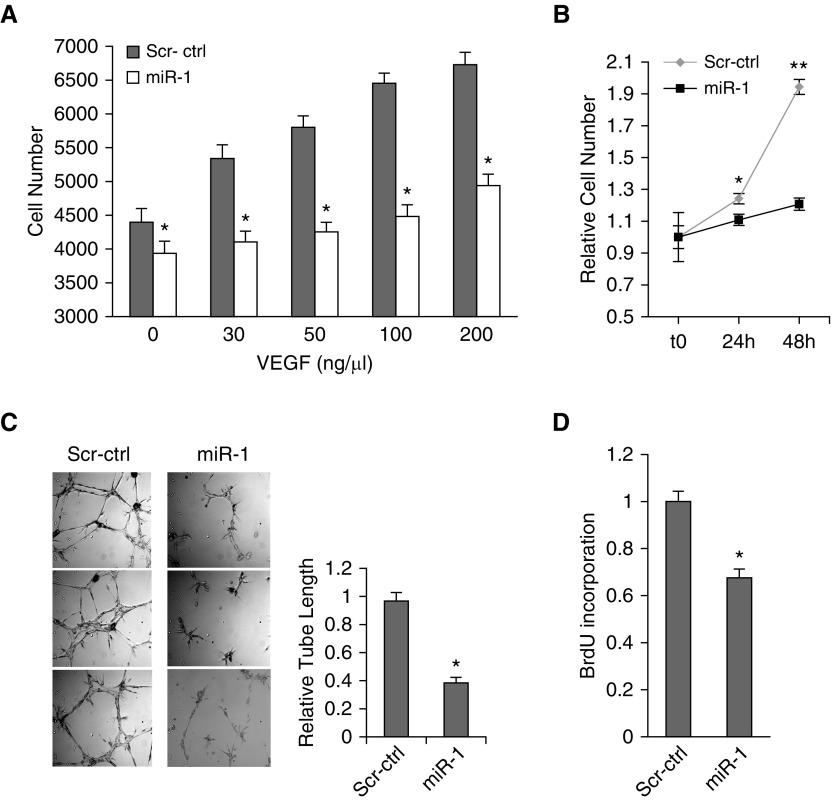
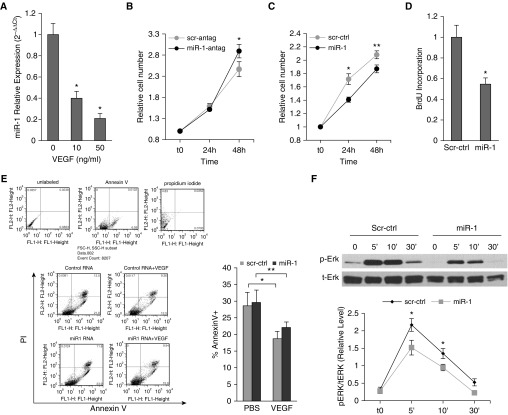
Rationale: Vascular endothelial growth factor down-regulates microRNA-1 (miR-1) in the lung endothelium, and endothelial cells play a critical role in tumor progression and angiogenesis.

Objectives: To examine the clinical significance of miR-1 in non-small cell lung cancer (NSCLC) and its specific role in tumor endothelium.

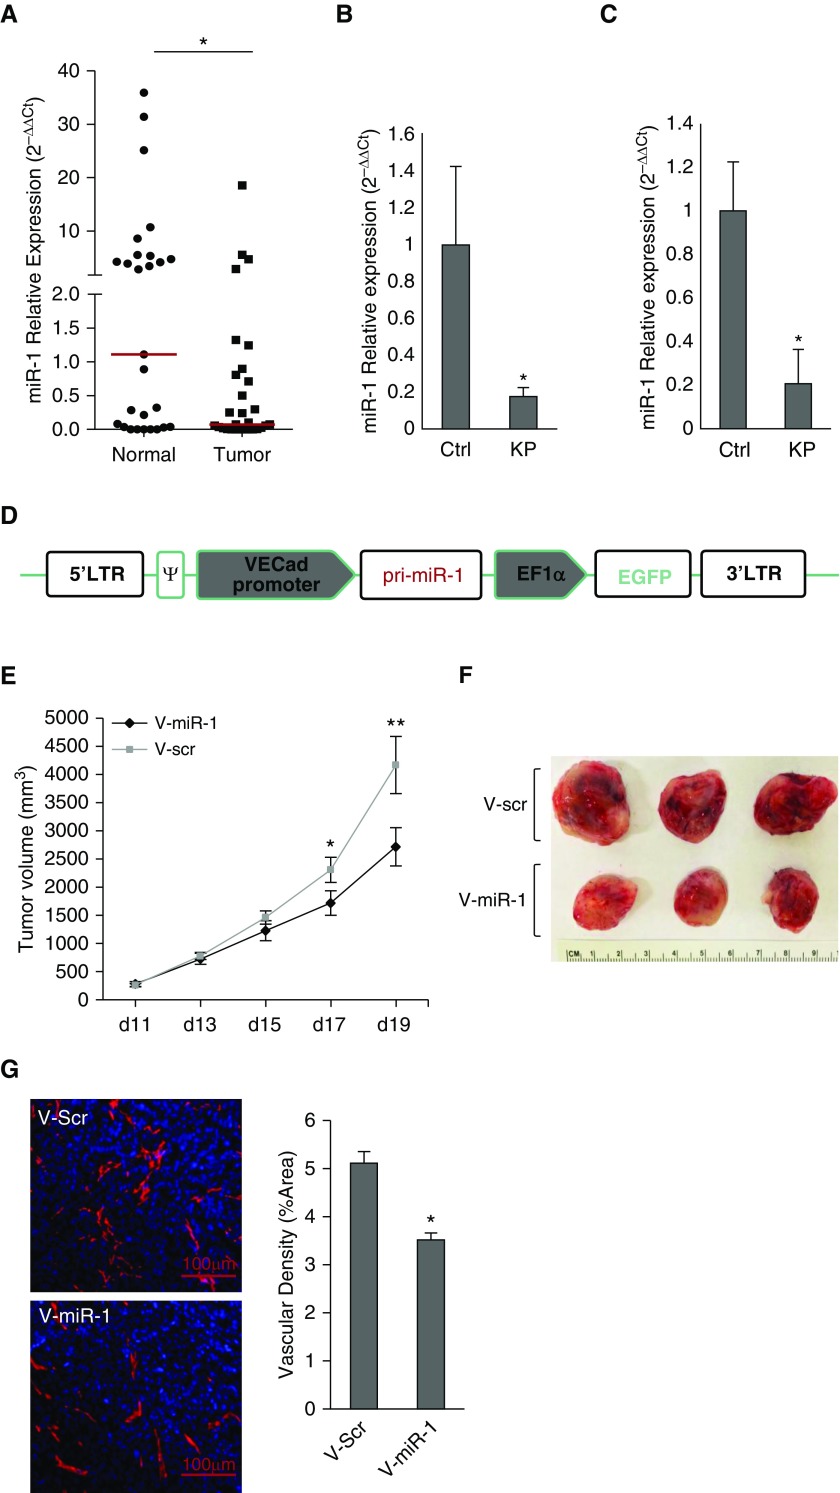
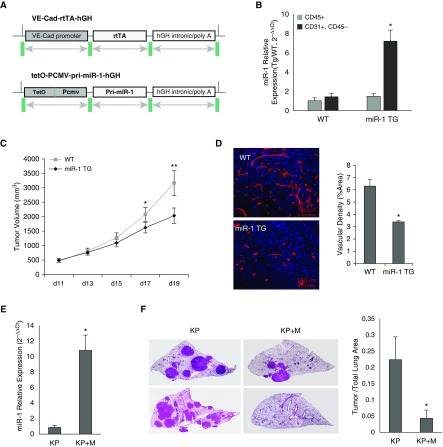
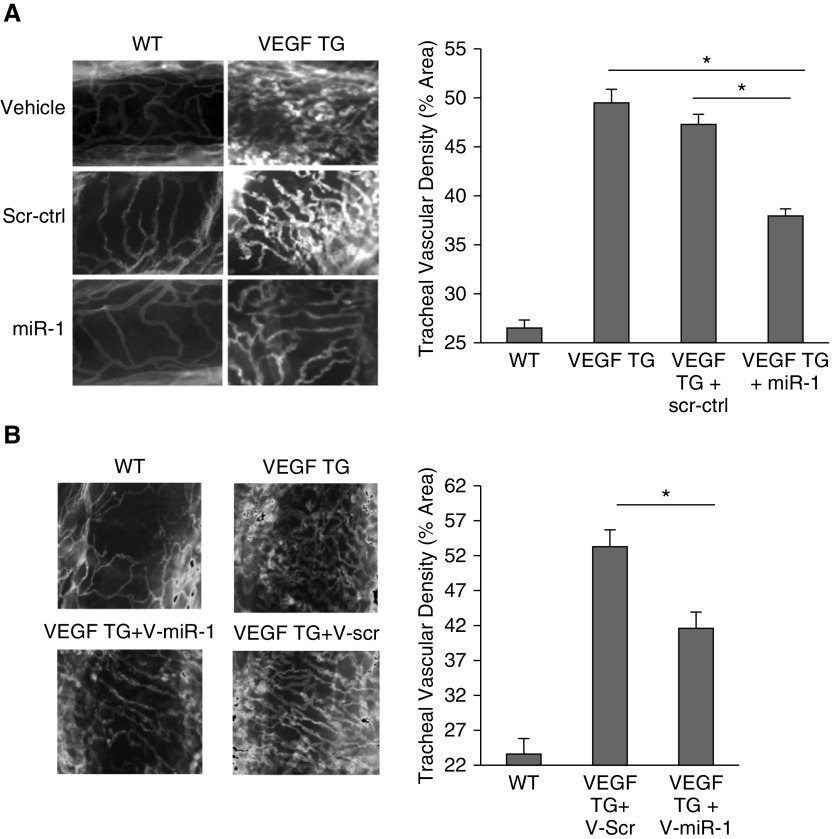
Methods: miR-1 levels were measured by Taqman assay. Endothelial cells were isolated by magnetic sorting. We used vascular endothelial cadherin promoter to create a vascular-specific miR-1 lentiviral vector and an inducible transgenic mouse. KRASG12D mut/Trp53-/- (KP) mice, lung-specific vascular endothelial growth factor transgenic mice, Lewis lung carcinoma xenografts, and primary endothelial cells were used to test the effects of miR-1.

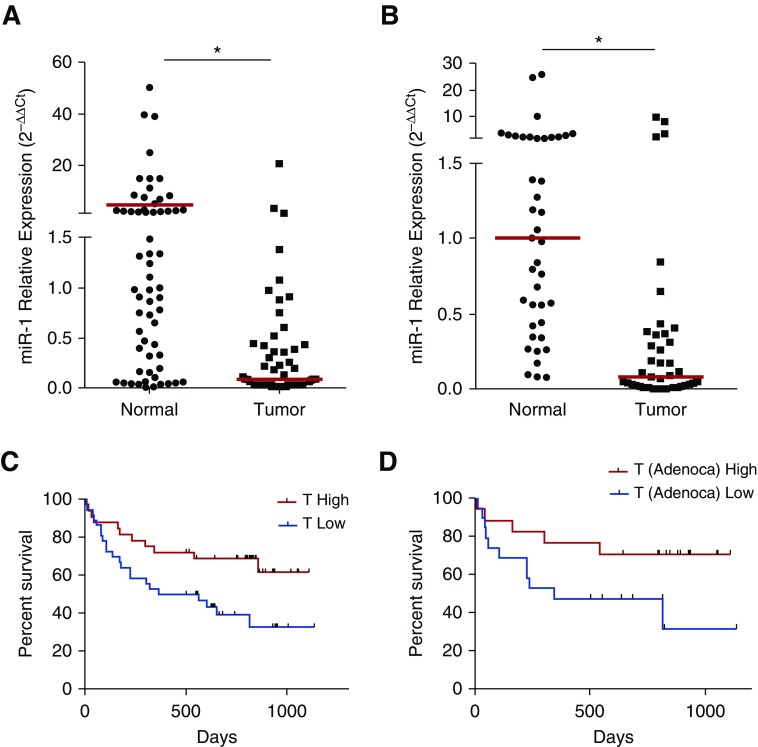
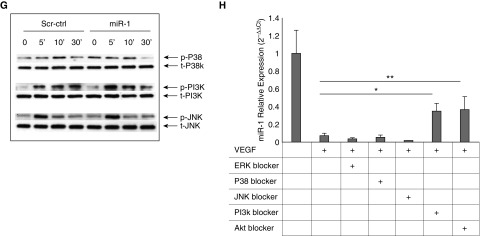
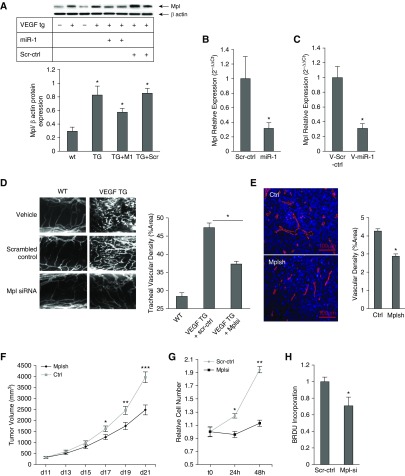
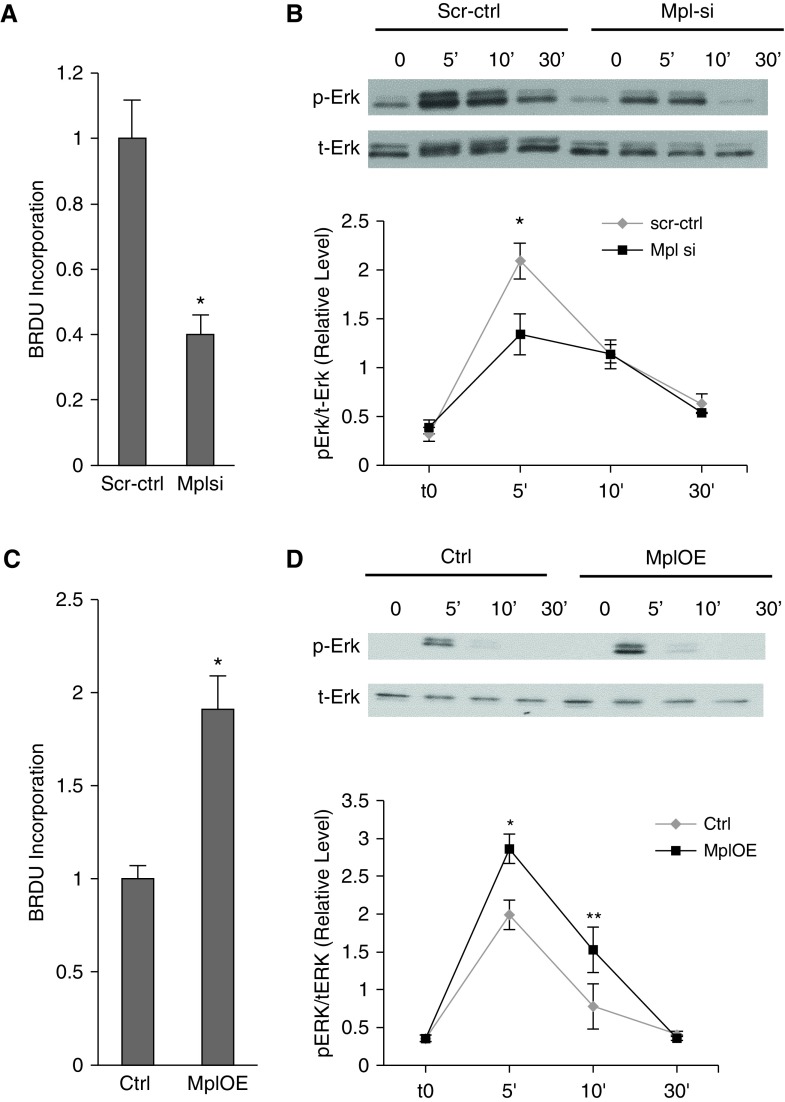
Measurements and main results: In two cohorts of patients with NSCLC, miR-1 levels were lower in tumors than the cancer-free tissue. Tumor miR-1 levels correlated with the overall survival of patients with NSCLC. miR-1 levels were also lower in endothelial cells isolated from NSCLC tumors and tumor-bearing lungs of KP mouse model. We examined the significance of lower miR-1 levels by testing the effects of vascular-specific miR-1 overexpression. Vector-mediated delivery or transgenic overexpression of miR-1 in endothelial cells decreased tumor burden in KP mice, reduced the growth and vascularity of Lewis lung carcinoma xenografts, and decreased tracheal angiogenesis in vascular endothelial growth factor transgenic mice. In endothelial cells, miR-1 level was regulated through phosphoinositide 3-kinase and specifically controlled proliferation, de novo DNA synthesis, and ERK1/2 activation. Myeloproliferative leukemia oncogene was targeted by miR-1 in the lung endothelium and regulated tumor growth and angiogenesis.

Conclusions: Endothelial miR-1 is down-regulated in NSCLC tumors and controls tumor progression and angiogenesis.

Keywords: angiogenesis; lung cancer; microRNA-1; tumor microenvironment; vascular endothelial growth factor blockers.


Figures

Figure 1.
Figure 1.
The clinical significance of microRNA-1 (miR-1) levels in non–small cell lung cancer. (A) Mature miR-1/18s (control gene) levels were measured in tumors and cancer-free lung tissue samples from the all–non–small cell lung cancer cohort. Values were normalized to the median of the normal samples and expressed as 2−∆∆Ct (nTumor = 61, nNormal = 57; *P = 0.0033). (B) miR-1 values in samples from the early lung adenocarcinoma cohort were measured and graphed as in A (nTumor = 41, nNormal = 41; *P < 0.0001). In A and B, red bars show medians in each group. (C) Patients were divided into T-high and T-low groups based on the median of all tumor miR-1 levels in the cohort. Kaplan-Meier graph shows survival (in days) for T-high and T-low patients (n = 61; P = 0.0082). (D) Patients with lung adenocarcinoma (Adenoca) were divided into T-high and T-low groups and their survival compared as described in C (n = 36; P = 0.0189). In C and D, gray tick marks indicate censored patients.
Figure 2.
Figure 2.
MicroRNA-1 (miR-1) is down-regulated in tumor endothelium and regulates angiogenesis. (A) Endothelial cells (CD31+, CD45) were isolated from non–small cell lung cancer tumors (Tumor) and adjacent cancer-free tissues (Normal). miR-1/18s levels were normalized to the median of the control (Normal) group and expressed as 2−∆∆Ct (n = 28; *P = 0.0351). Red horizontal lines indicate medians of the groups. (B) Kirsten rat sarcoma viral oncogene homolog (KRAS) mutant/transformation-related protein 53 (P53) (KP) knockout mice received intranasal Cre recombinase (or control [ctrl]) vector and their lungs harvested after 6 months. miR-1/18s levels were measured in the whole lungs, normalized to the mean of the control group, and expressed as 2−∆∆Ct (n = 12 in each group from two experiments; *P = 0.01533). (C) Endothelial (CD31+, CD45) cells were isolated from the lungs of KP and ctrl mice and miR-1 levels were measured and normalized as described in B (n ≥ 5 in each group from two experiments; *P = 0.016). (D) Vascular-specific miR-1 expression vector (V-miR-1). Vascular endothelial cadherin (VECad) promoter was cloned upstream of primary (pri)-miR-1 sequence in a lentiviral transfer vector containing enhanced green fluorescent protein as a marker gene driven by elongation factor 1 α subunit (EF1α) promoter. (E–G) Effect of vascular-specific miR-1 overexpression on tumor growth and angiogenesis. Lewis lung carcinoma implants were injected with V-miR-1 or scrambled control vector (V-scr) on Day 10, and harvested on Day 19 after implantation. The sizes of the tumors were measured and volumes calculated according to the following formula: volume = 0.52 × width2 × length. (E) Tumor volumes are graphed versus the time of measurement (number of days on the x-axis; data points are means of tumor volume) (n ≥ 13 in each group from three experiments; *P = 0.036013, **P = 0.016034). (F) Representative tumors from the two groups on Day 19 after implantation. (G) Tumor sections were stained with anti-CD31 antibody and DAPI (4',6-diamidino-2-phenylindole). (Left) Representative images. (Right) Quantification of vessel density based on the percentage of CD31-positive areas/whole area examined (n ≥ 7 in each group from two experiments; *P = 0.002645). Error bars represent SEM. ψ = packaging signal; EGFP = enhanced green fluorescent protein; LTR = long terminal repeat.
Figure 3.
Figure 3.
The effects of vascular-specific microRNA-1 (miR-1) in the transgenic model. (A) Constructs used for the generation of inducible endothelial-specific transgenic mouse. VE-Cad-rtTA-hGH: contains vascular endothelial cadherin (VE-Cad) promoter, reverse tetracycline transactivator (rtTA), and human growth hormone (hGH) intronic, nuclear localization, and polyadenylation sequences. tet-O-pCMV-pri-miR-1-hGH: contains a polymeric tetracycline operator (tet-O), minimal cytomegalovirus (CMV) promoter, and hGH intronic, polyadenylation, and nuclear localization signals flanking its multiple cloning site. Primary (pri)-miR-1 sequence was cloned between the hGH intronic sequence and tet-O-CMV promoter. (B) miR-1 levels were measured in endothelial (CD31+, CD45) and immune (CD45+) cell fractions isolated from wild-type and miR-1 transgenic (miR-1 TG) mice. Bar graphs represent mean level of miR-1 expressed as 2−∆∆Ct value (see supplementary methods for description of normalization). The asterisk indicates significant increase in CD31+ CD45 fraction as compared to CD45+ fraction in the miR-1 TG group (n = 4 per group; *P = 0.001768). (C and D) The effects of miR-1 transgene expression on tumor growth and angiogenesis in Lewis lung carcinoma model. Tumor implantation and volume measurements performed as described in Figure 2E (n ≥ 4 from three experiments; *P = 0.033645; **P = 0.007521). (D) Tumors sections were stained with anti-CD31 antibody and analyzed for vascular density as described in Figure 2G. (Left) Representative images of tumors. (Right) Quantification of CD31-positive area (vascular density) expressed as percentage of the whole area examined (n ≥ 12 from three experiments; *P = 0.017903). (E and F) The effect of endothelial miR-1 in Kirsten rat sarcoma viral oncogene homolog (KRAS)/transformation-related protein 53 (P53) knockout (KP) model. KP and KP + M mice (KP cross with miR-1-TG mice) received Cre recombinase at 1 month of age. miR-1 overexpression was induced by adding doxycycline to the drinking water 5 months after Cre delivery and lungs were harvested 6 months after Cre delivery. (E) Relative expression of miR-1 (miR-1/18s in KP + M and KP mice normalized to the levels in KP mice) in endothelial cells isolated from these lungs (n = 9 from 2 experiments; *P = 0.001211). (F) Lungs were sectioned (5 μm) and stained with hematoxylin and eosin. Tumor burden was determined by measuring tumor area/whole lung area. (Left) Representative images of the lungs from two mice in each group (each image was assembled from multiple smaller images at ×400 magnification). (Right) Quantification of tumor burden in the two groups (n = 9 from two experiments; *P = 0.02887). Error bars represent SEM. WT = wild-type.
Figure 4.
Figure 4.
The effects of vascular-specific microRNA-1 (miR-1) on lung angiogenesis. (A) miR-1, scrambled control (scr-ctrl), or vehicle were delivered intranasally to vascular endothelial growth factor (VEGF) transgenic (VEGF TG) or wild-type (WT) mice 1 day after inducing the transgene. Lungs were harvested after 10 days. Tracheas were stained with anti-CD31 antibody. (Left) Representative images. (Right) Quantification of CD31-positive area (vascular density) expressed as a percentage of the whole area examined (n ≥ 8 from four experiments; *P < 0.00001). (B) Effect of vascular-specific miR-1 overexpression on tracheal vascular density. WT and VEGF TG mice received intranasal V-miR-1 or V-scr and VEGF transgene was induced by adding doxycycline to the drinking water. Tracheal vascular density was measured as described in A. (Left) Representative images. (Right) Results of quantification (n ≥ 6 from three experiments; *P = 0.00970). Error bars represent SEM. V-miR-1 = vascular-specific miR-1; V-scr = vascular-specific scrambled control.
Figure 5.
Figure 5.
The effect of microRNA-1 on mouse lung endothelial cells (MLEC). (A–D) MLECs were transfected with double stranded miR-1 mimic (miR-1) or scrambled control RNA (Scr-ctrl) and stimulated with recombinant human vascular endothelial growth factor (VEGF)-A. (A) MLEC growth at 24 hours in response to various concentrations of VEGF was measured using WST-1 kit (Roche) (n = 6 from two experiments; *P < 0.05). (B) MLEC growth in response to 50 ng/ml of VEGF at the indicated time points was measured as in A (x-axis shows time) (n = 24 from four experiments; *P < 0.01, **P < 0.000001). (C) Endothelial sprouting (capillary tube formation in matrigel). (Left) Representative images. (Right) Quantitation of the relative tube length (n = 9 from three experiments; *P < 0.005). (D) Bromodeoxyuridine incorporation in response to VEGF was measured as an index of de novo DNA synthesis by ELISA (Roche) and values were normalized to the control reaction (n ≥ 24 from six experiments; *P = 1.4 × 10−6). Error bars represent SEM. BrdU = bromodeoxyuridine.
Figure 6.
Figure 6.
The role and regulation of microRNA-1 in human primary endothelial cells. (A) miR-1/18s levels were measured in human umbilical vein endothelial cells (HUVECs) stimulated with 10 ng or 50 ng/ml of recombinant human vascular endothelial growth factor (VEGF). Values were normalized to the mean of the control group and expressed as 2−∆∆Ct (n ≥ 15 from five experiments; *P < 0.0001). (B–E) HUVECs were transfected with miR-1 antagomir (miR-1-antag), mature miR-1 double-stranded mimic (miR-1), or their respective scrambled controls (scr-antag, or scr-ctrl). HUVECs were then starved overnight and stimulated with VEGF (10 ng/ml). (B) The effects of miR-1-antag and its control on proliferation were measured and presented as in Figure 5A (n = 12 from two experiments; *P = 0.043). (C) The effects of miR-1 and its control on proliferation were measured and presented as in Figure 5A (n = 16 from three experiments; *P = 0.00194; **P = 0.0307). (D) The effects of miR-1 and scr-ctrl on bromodeoxyuridine incorporation (de novo DNA synthesis) was measured and presented as in Figure 5D (n = 20 from four experiments; *P = 0.00123). (E) The effect of miR-1 and scr-ctrl on cell death was analyzed by fluorescence-activated cell sorter analysis for Annexin V and propidium iodide (PI). (Left) Results of a typical fluorescence-activated cell sorter analysis experiments. (Top) Results of staining with each reagent in a representative experiment. (Bottom left) Representative dot plots for each experimental group. (Bottom right) Quantification of apoptotic cell fraction defined as a percentage of Annexin V–positive cells (n ≥ 6 from two experiments; *P = 0.028; **P = 0.047). (F and G) HUVECs were transfected with miR-1 or scr-ctrl, starved overnight, and stimulated with VEGF. Reaction was stopped at 5, 10, or 30 minutes and cells were lysed. Phosphorylated and total extracellular signal–regulated protein kinase (ERK) (p-ERK and t-ERK, respectively) fractions were detected by Western blotting. (F) Representative immunoblot (top) and quantification of the activated ERK1/2 (p-ERK/t-ERK) (bottom) (x-axis shows time in minutes) (n = 8; *P < 0.04). (G) Representative immunoblots for activated (phosphorylated, p-) and total (t-) P38 mitogen-activated protein kinase (P38K), phosphoinositide 3-kinase (PI3K), and c-jun N-terminal kinase (JNK). (H) HUVECs were starved, incubated with blockers, and stimulated with VEGF for 24 hours. miR-1 was measured as described in Figure 2 (n ≥ 10 from five experiments; *P < 0.001; **P < 1 × 10−5). Error bars represent SEM. BrdU = bromodeoxyuridine; FSC = forward scatter; PBS = phosphate-buffered saline; SSC = side scatter.
Figure 6.
Figure 6.
The role and regulation of microRNA-1 in human primary endothelial cells. (A) miR-1/18s levels were measured in human umbilical vein endothelial cells (HUVECs) stimulated with 10 ng or 50 ng/ml of recombinant human vascular endothelial growth factor (VEGF). Values were normalized to the mean of the control group and expressed as 2−∆∆Ct (n ≥ 15 from five experiments; *P < 0.0001). (B–E) HUVECs were transfected with miR-1 antagomir (miR-1-antag), mature miR-1 double-stranded mimic (miR-1), or their respective scrambled controls (scr-antag, or scr-ctrl). HUVECs were then starved overnight and stimulated with VEGF (10 ng/ml). (B) The effects of miR-1-antag and its control on proliferation were measured and presented as in Figure 5A (n = 12 from two experiments; *P = 0.043). (C) The effects of miR-1 and its control on proliferation were measured and presented as in Figure 5A (n = 16 from three experiments; *P = 0.00194; **P = 0.0307). (D) The effects of miR-1 and scr-ctrl on bromodeoxyuridine incorporation (de novo DNA synthesis) was measured and presented as in Figure 5D (n = 20 from four experiments; *P = 0.00123). (E) The effect of miR-1 and scr-ctrl on cell death was analyzed by fluorescence-activated cell sorter analysis for Annexin V and propidium iodide (PI). (Left) Results of a typical fluorescence-activated cell sorter analysis experiments. (Top) Results of staining with each reagent in a representative experiment. (Bottom left) Representative dot plots for each experimental group. (Bottom right) Quantification of apoptotic cell fraction defined as a percentage of Annexin V–positive cells (n ≥ 6 from two experiments; *P = 0.028; **P = 0.047). (F and G) HUVECs were transfected with miR-1 or scr-ctrl, starved overnight, and stimulated with VEGF. Reaction was stopped at 5, 10, or 30 minutes and cells were lysed. Phosphorylated and total extracellular signal–regulated protein kinase (ERK) (p-ERK and t-ERK, respectively) fractions were detected by Western blotting. (F) Representative immunoblot (top) and quantification of the activated ERK1/2 (p-ERK/t-ERK) (bottom) (x-axis shows time in minutes) (n = 8; *P < 0.04). (G) Representative immunoblots for activated (phosphorylated, p-) and total (t-) P38 mitogen-activated protein kinase (P38K), phosphoinositide 3-kinase (PI3K), and c-jun N-terminal kinase (JNK). (H) HUVECs were starved, incubated with blockers, and stimulated with VEGF for 24 hours. miR-1 was measured as described in Figure 2 (n ≥ 10 from five experiments; *P < 0.001; **P < 1 × 10−5). Error bars represent SEM. BrdU = bromodeoxyuridine; FSC = forward scatter; PBS = phosphate-buffered saline; SSC = side scatter.
Figure 7.
Figure 7.
The role of myeloproliferative leukemia virus oncogene (Mpl) in angiogenesis and tumor growth. (A) Mpl expression was detected by Western blot analysis in the lungs of vascular endothelial growth factor (VEGF) transgenic (TG) mice (VEGF TG+) and their wild-type (WT) littermates (WT/VEGF TG) that received double-stranded microRNA-1 (miR-1) or scrambled control (Scr-ctrl) RNA. (Top) Representative Western blot. (Bottom) Results of densitometric analysis (TG+M1 = VEGF TG + miR-1) (n = 3; *P and **P < 0.05). (B) Mpl expression was measured by Taqman quantitative real-time polymerase chain reaction in lung endothelial cells isolated from mice that received intranasal miR-1 or Scr-ctrl-RNA. The graph shows Mpl/glyceraldehyde phosphate dehydrogenase levels normalized to the control group and expressed as 2−ΔΔCt (n = 11 from four experiments; *P < 0.03). (C) A similar measurement as shown in B on lung endothelial cells from mice that received vascular-specific lenti-miR-1 (V-miR-1) or control (V-Scr-ctrl). The graph shows Mpl/glyceraldehyde phosphate dehydrogenase levels normalized to the control group and expressed as 2−ΔΔCt (n = 8, from two experiments; *P < 0.002). (D) VEGF-TG and -WT mice received small interfering RNA (siRNA) against Mpl (Mplsi) or Scr-ctrl. Tracheas were isolated and angiogenesis was assessed as described in Figure 4A. (Left) Representative images of tracheal vessels from WT and TG mice treated with vehicle (buffer), Mpl siRNA, or scrambled control RNA (n = 9 from three experiments; P < 0.0005). (E) Lewis lung carcinoma implants were injected with lentiviral vector containing Mpl short hairpin RNA (shRNA) (Mplsh) or the control vector (Ctrl). Tumors were harvested on Day 21 and vascularity assessed after staining with anti-CD31 antibody (n = 14 from two experiments; *P = 0.004923). (F) Tumor sizes were measured at the indicated time points and volumes calculated as in Figure 2E (n = 17 from two experiments; *P = 0.01606, **P = 0.00302, ***P = 4.07 × 10−5). (G and H) Mouse lung endothelial cells were transfected with Mplsi or Scr-ctrl and stimulated with VEGF (50 ng/ml). (G) Cell proliferation was measured as described in Figure 1D (n = 24 from four experiments; *P < 0.01, **P < 0.00001). (H) BrdU incorporation was compared between the two groups (values were normalized to the control reaction, n = 20 from four experiments; *P = 0.02). Error bars represent SEM. BrdU = bromodeoxyuridine.
Figure 8.
Figure 8.
The role of myeloproliferative leukemia virus oncogene (Mpl) in human endothelial cells. (A and B) Human umbilical vein endothelial cells (HUVECs) were transfected with Mpl small interfering RNA (siRNA) (Mplsi) or scramble control RNA (scr-ctrl) and stimulated with vascular endothelial growth factor. (A) Bromodeoxyuridine (BrdU) incorporation in HUVEC was measured by ELISA and normalized to Scr-ctrl (n ≥ 5 from four experiments; *P < 0.0005). (B) Extracellular signal–regulated protein kinase (Erk) activation (phospho-Erk protein [pErk]/total Erk protein [tErk]) was measured as described in Figure 6F. (Top) Representative blot. (Bottom) Results of densitometric analysis (x-axis shows time in minutes) (n = 6 for each data point from three experiments; *P = 0.05). (C and D) HUVECs were transfected with Mpl overexpression vector (MplOE) or control vector (Ctrl) and stimulated with vascular endothelial growth factor. (C) BrdU incorporation was measured and depicted as described in C (n = 12 from two experiments; *P < 0.0001). (D) Erk activation was measured as described in B (n = 6 from six experiments; *P = 0.0026; **P = 0.0344). Error bars represent SEM.

Similar articles

Cited by

References

    1. Cao Y, Arbiser J, D’Amato RJ, D’Amore PA, Ingber DE, Kerbel R, Klagsbrun M, Lim S, Moses MA, Zetter B, et al. Forty-year journey of angiogenesis translational research. Sci Transl Med. 2011;3:114rv3. - PMC - PubMed
    1. Quail DF, Joyce JA. Microenvironmental regulation of tumor progression and metastasis. Nat Med. 2013;19:1423–1437. - PMC - PubMed
    1. Dudley AC. Tumor endothelial cells. Cold Spring Harb Perspect Med. 2012;2:a006536. - PMC - PubMed
    1. Jain RK. Antiangiogenesis strategies revisited: from starving tumors to alleviating hypoxia. Cancer Cell. 2014;26:605–622. - PMC - PubMed
    1. Bartel DP. MicroRNAs: target recognition and regulatory functions. Cell. 2009;136:215–233. - PMC - PubMed

Publication types

MeSH terms

Substances