. 2017 Sep 14;549(7671):227-232.
doi: 10.1038/nature23666. Epub 2017 Aug 30.

Fate mapping of human glioblastoma reveals an invariant stem cell hierarchy

Affiliations

Fate mapping of human glioblastoma reveals an invariant stem cell hierarchy

Xiaoyang Lan et al. Nature. .

Abstract

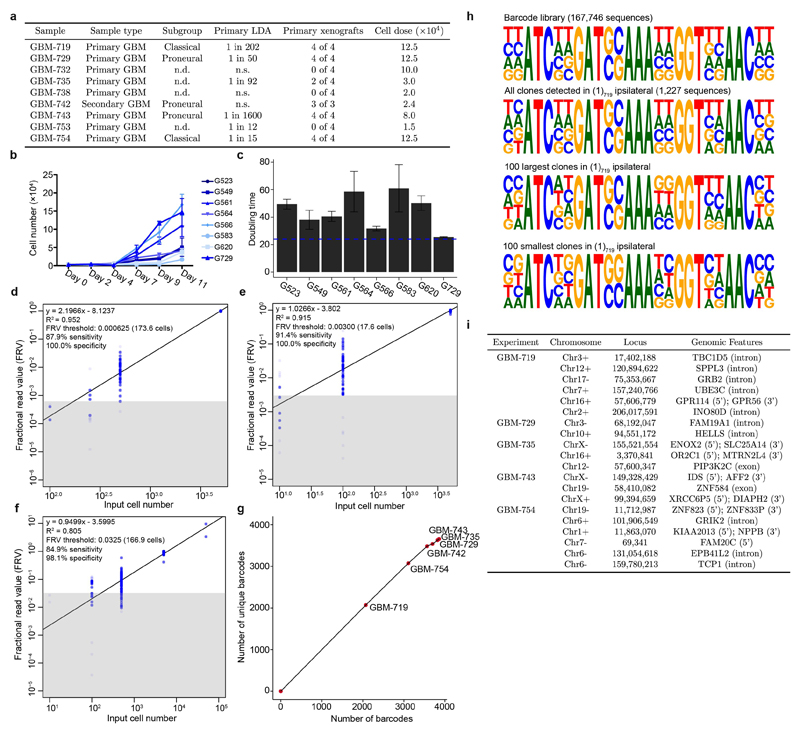
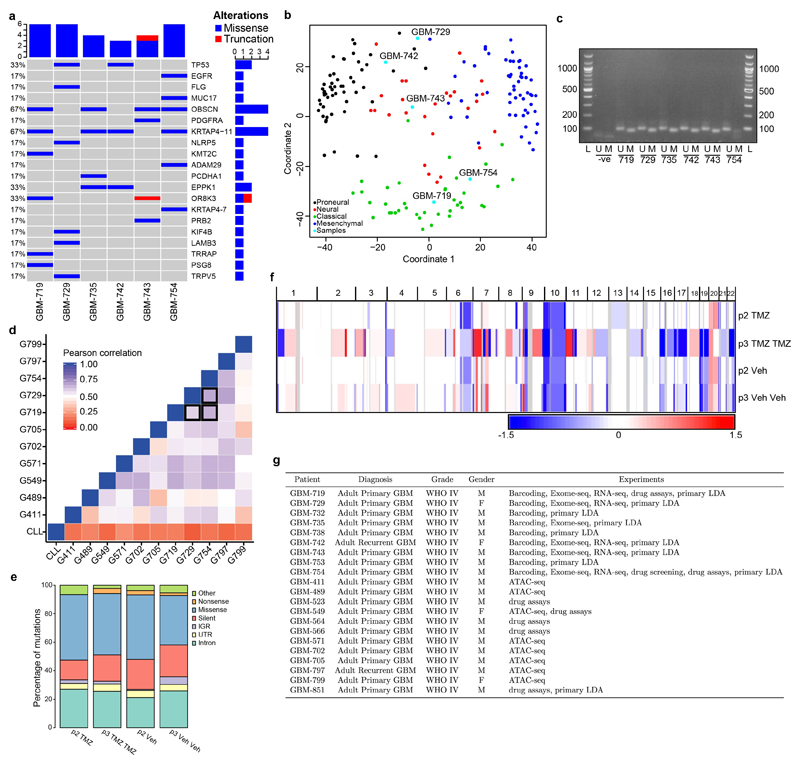
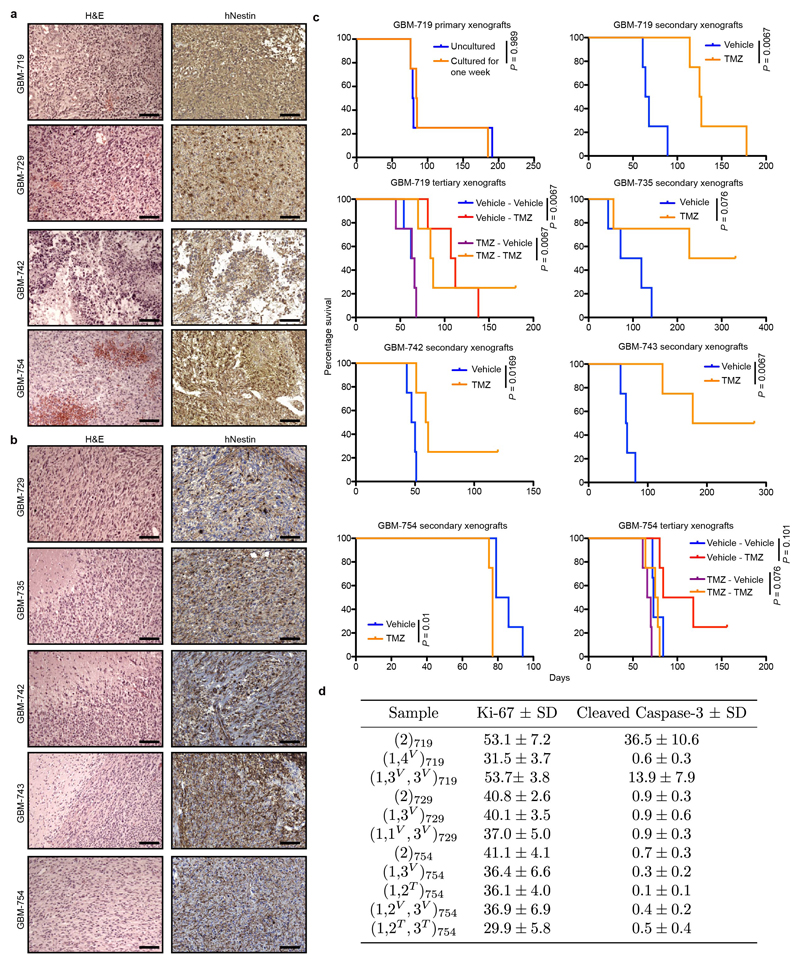
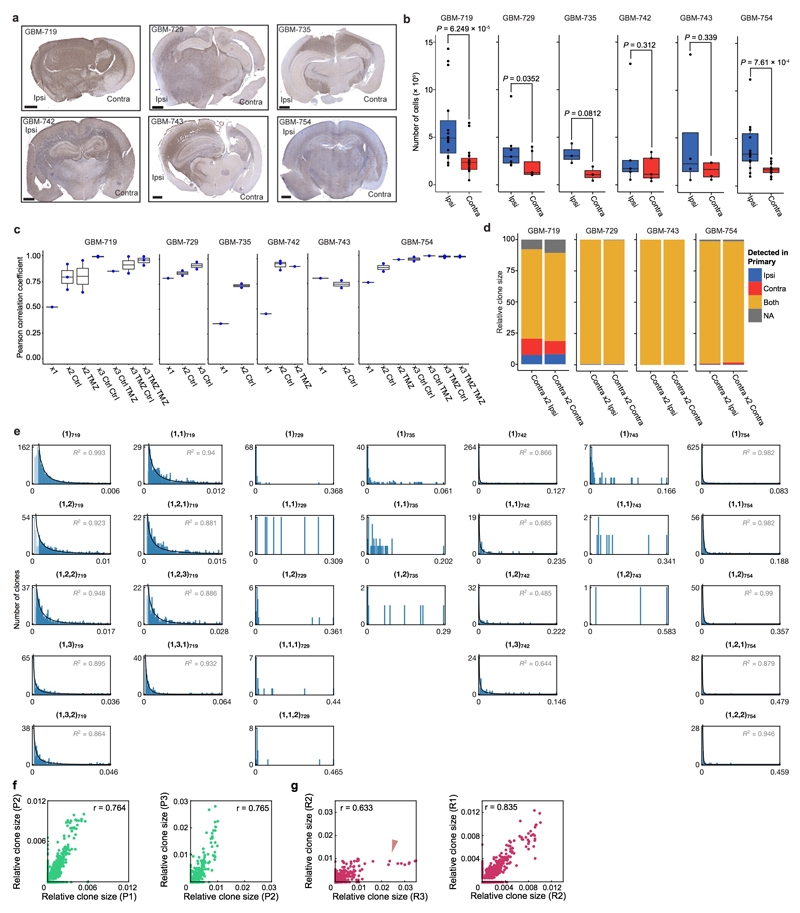
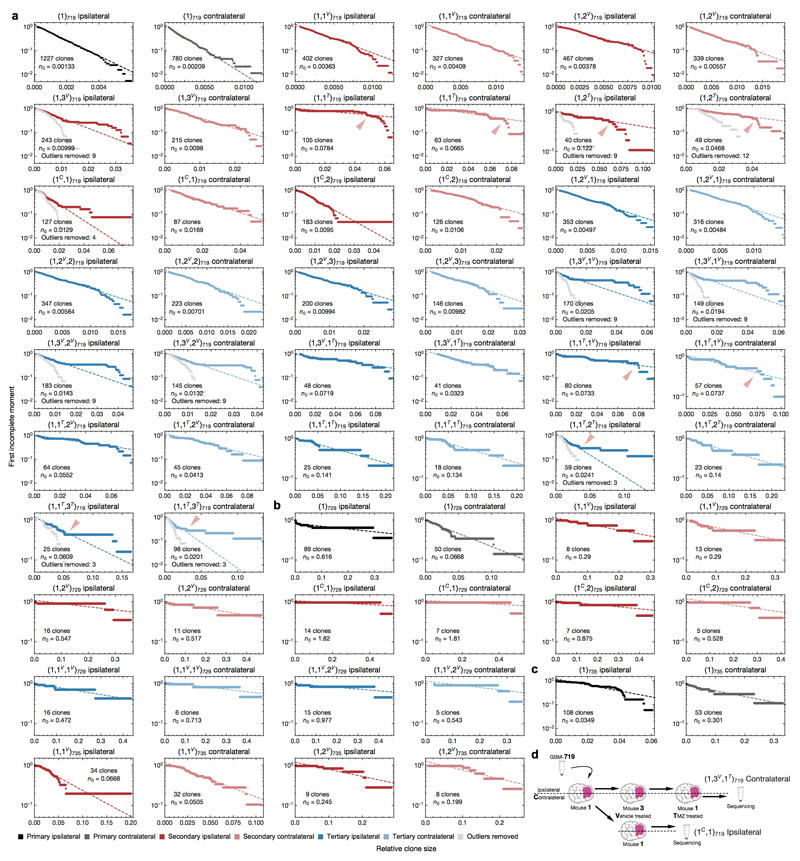
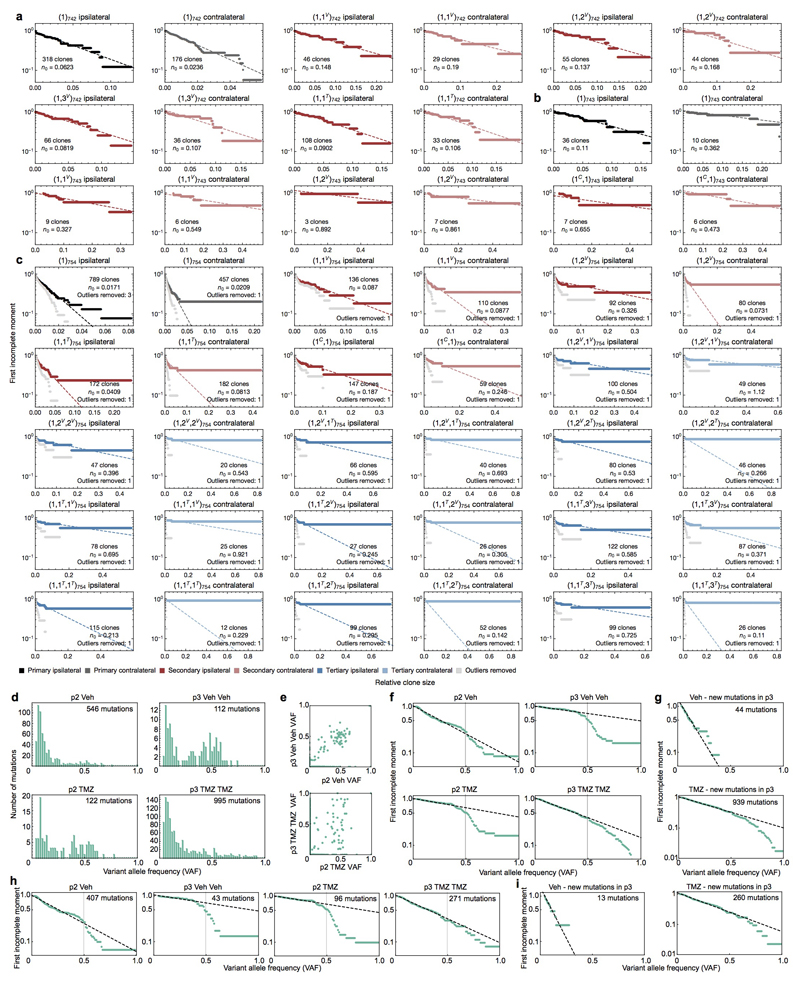
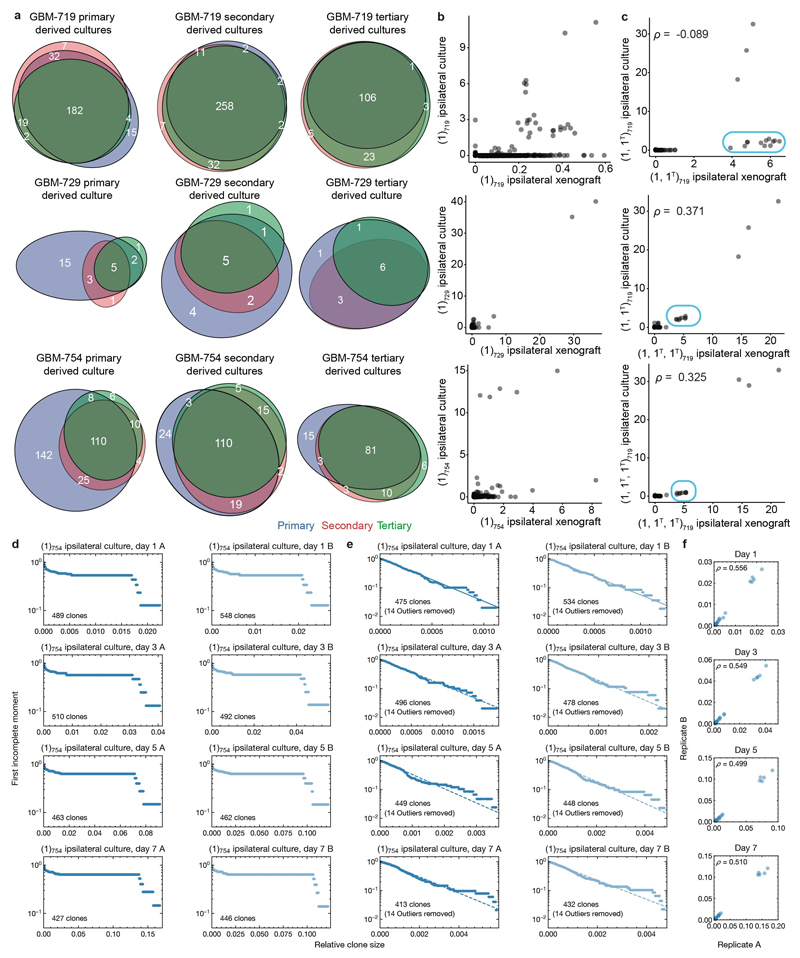
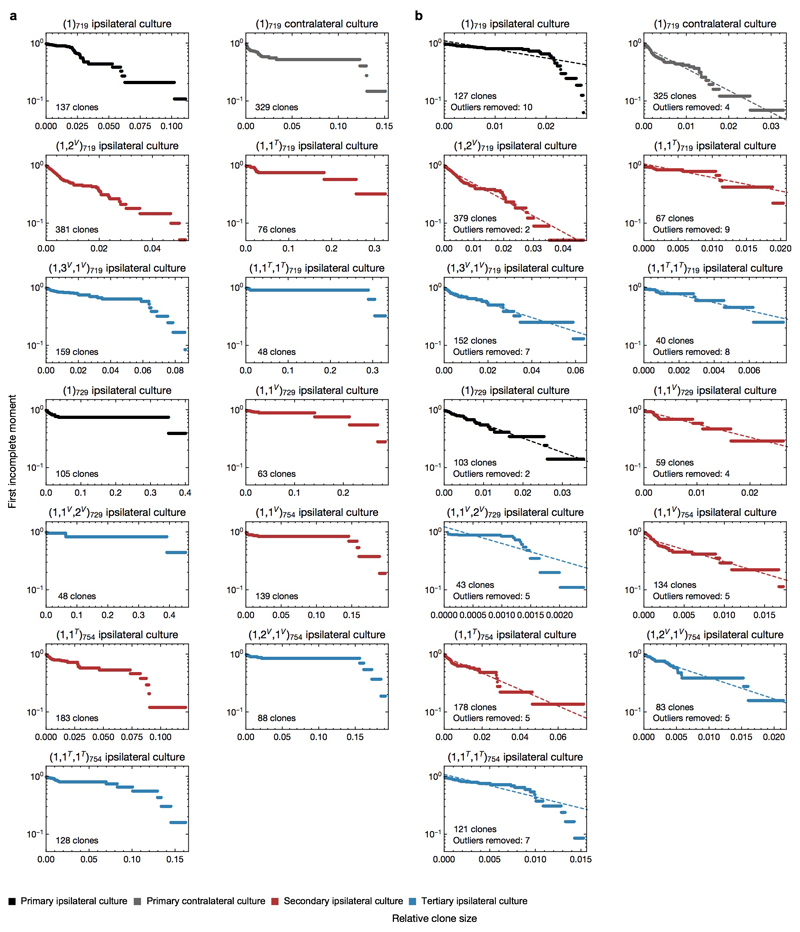
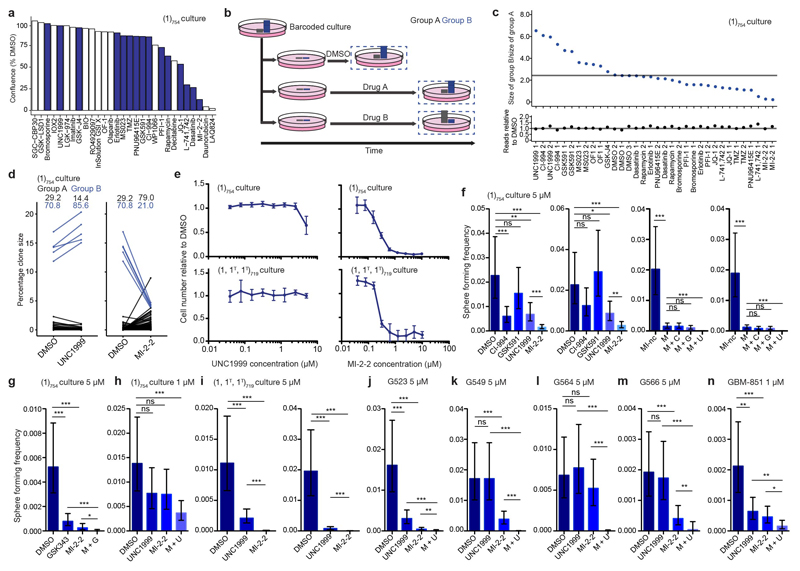
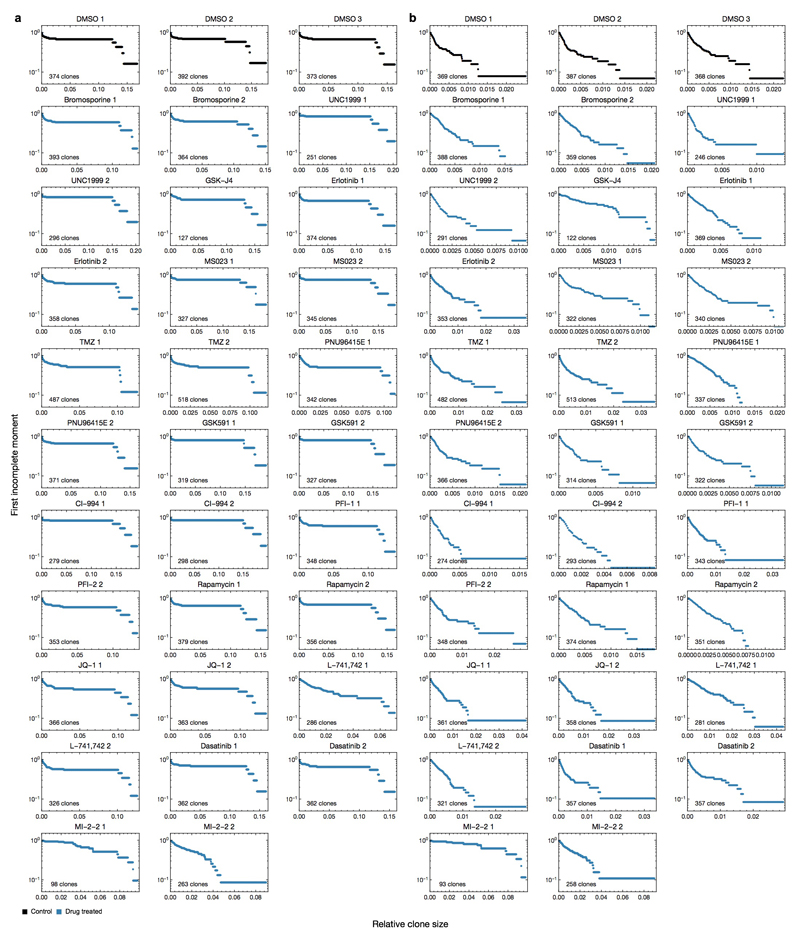
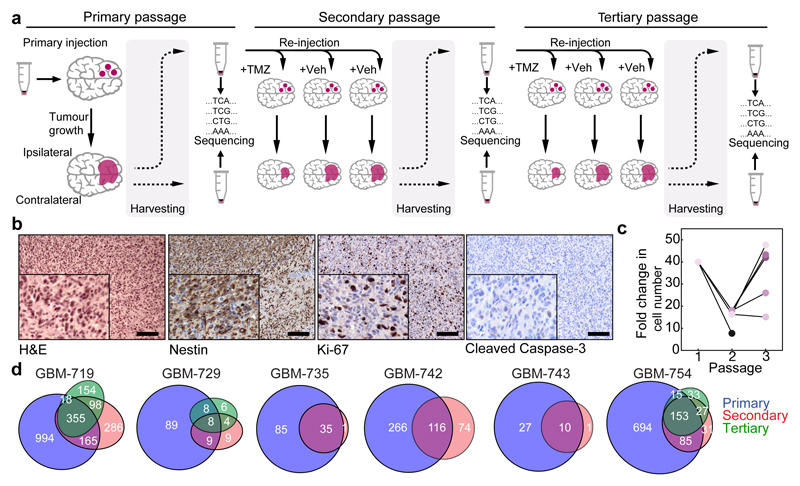
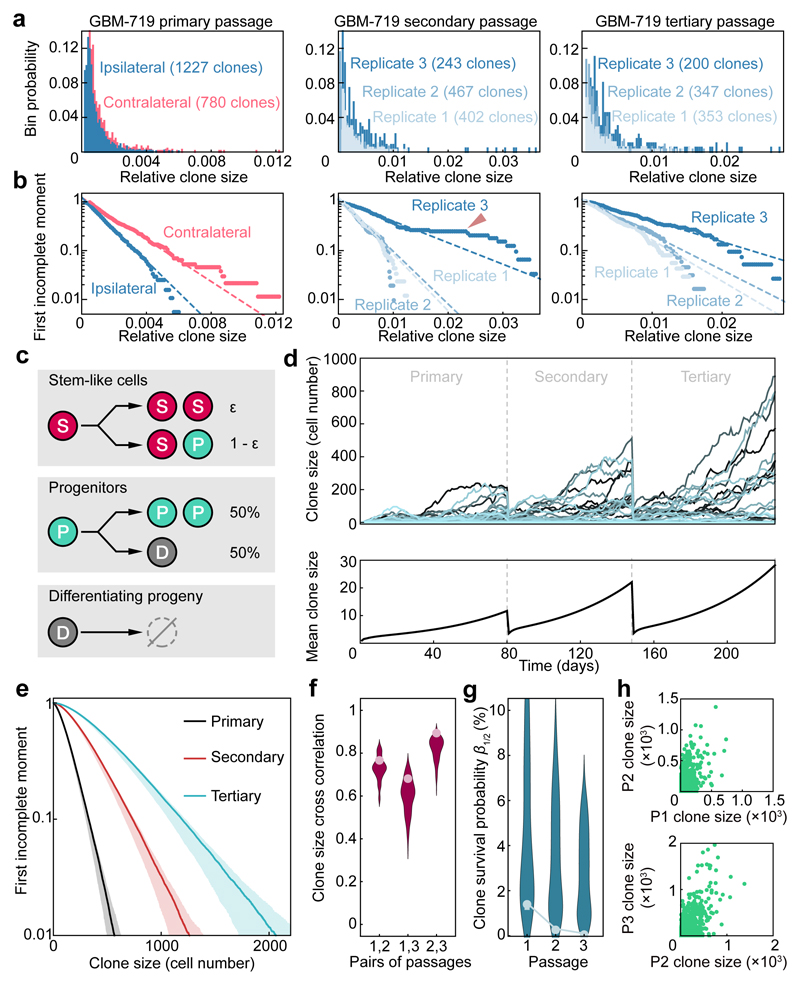
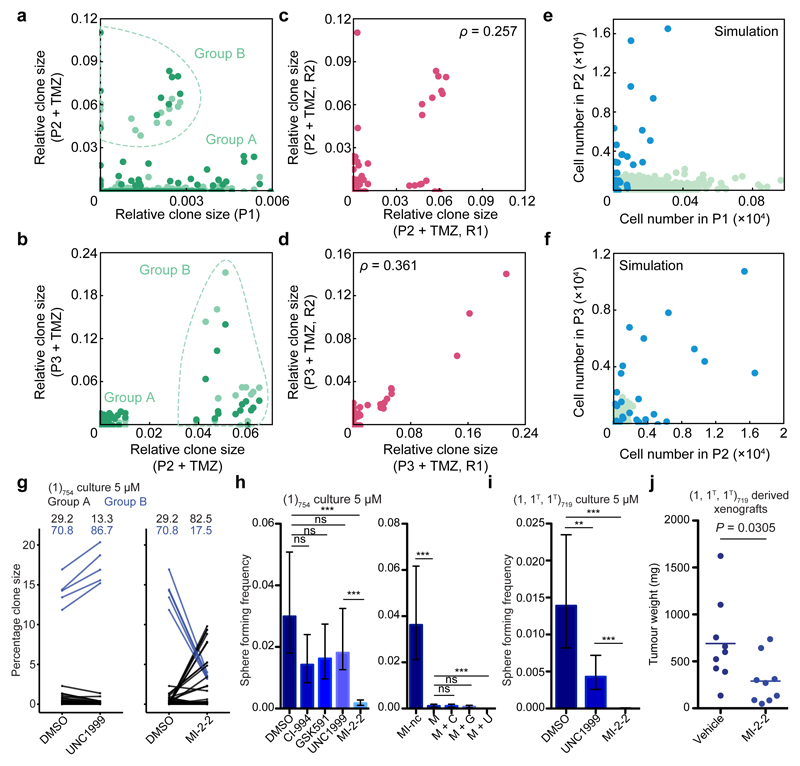
Human glioblastomas harbour a subpopulation of glioblastoma stem cells that drive tumorigenesis. However, the origin of intratumoural functional heterogeneity between glioblastoma cells remains poorly understood. Here we study the clonal evolution of barcoded glioblastoma cells in an unbiased way following serial xenotransplantation to define their individual fate behaviours. Independent of an evolving mutational signature, we show that the growth of glioblastoma clones in vivo is consistent with a remarkably neutral process involving a conserved proliferative hierarchy rooted in glioblastoma stem cells. In this model, slow-cycling stem-like cells give rise to a more rapidly cycling progenitor population with extensive self-maintenance capacity, which in turn generates non-proliferative cells. We also identify rare 'outlier' clones that deviate from these dynamics, and further show that chemotherapy facilitates the expansion of pre-existing drug-resistant glioblastoma stem cells. Finally, we show that functionally distinct glioblastoma stem cells can be separately targeted using epigenetic compounds, suggesting new avenues for glioblastoma-targeted therapy.


Conflict of interest statement

The authors declare no competing financial interests.

Figures

Extended data Figure 1
Extended data Figure 1. Barcode data processing.
a, Summary of GBM models used for barcoding experiments indicating TCGA subgroups as determined by RNA-Seq, self-renewing frequency as assessed by primary limiting dilution analysis (LDA), the number of primary xenografts successfully established and the cell dose used for primary xenografts (n.d: not done, n.s: no spheres). b, Proliferation kinetics of GSC cultures in vitro. Data are shown as mean ± sd of 3 technical replicates. c, Cell doubling times of GSCs grown in culture calculated using the data in (b). Data are shown as mean ± sd of 3 technical replicates, horizontal line marks 24 hours. d-f, Relationship between fractional read value (FRV) and input cell numbers in spiked-in controls for the three sequencing runs. The highly influential data points (Cook’s distance > 4/n) are grayed out and not used for regression analysis to estimate relative clone sizes. The black line is the line of best fit, and the grey box indicates sequencing noise threshold. g, Analysis of barcode sequence saturation across six in vivo experiments. h, Position weight matrices depicting the representation of variable nucleotides in the barcode library, the (1)719 ipsilateral sample, as well as the largest and smallest 100 clones in that sample. The height of nucleotides at each position represents its relative frequency, with the most frequently occurring nucleotide shown in the top position. i, Summary of unique barcode integration sites identified by splinkerette PCR.
Extended data Figure 2
Extended data Figure 2. Molecular characterization of GBMs and GBM xenografts.
a, Oncoprint plot of mutations identified in primary GBM tissue samples that are of the top 200 recurrently mutated genes in the provisional TCGA dataset. b, Multidimensional scaling plot for the 32-gene simple GBM classification method using RNA-Seq. Shown are the TCGA samples with RNA-Seq data and 5 patient samples used in the current study. TCGA samples are labelled and coloured according to their original subgroup as determined from microarray expression analysis. c, Methylation-specific PCR assay for the MGMT promoter in 6 primary GBMs. L: ladder, -ve: water only control, U: unmethylated PCR product, M: methylated PCR product. Specific ladder marker sizes are shown in base pairs. d, Pairwise correlation of ATAC-Seq peak intensities across GSC culture models and compared with a chronic lymphocytic leukaemia (CLL) control. Black outline highlights correlations for GSC cultures derived from the GBMs used for the in vivo barcoding study (G719, G729, G754). e, Summary of somatic mutations identified using exome sequencing from representative GBM-719 barcoded xenografts, grouped according to type. p2 Veh: passage 2; treated with vehicle, p2 TMZ: passage 2; treated with TMZ, p3 Veh Veh: passage 3; treated with vehicle at passages 2 and 3, p3 TMZ TMZ: passage 3; treated with TMZ at passages 2 and 3 and briefly expanded in vitro prior to sequencing. f, Heat map representing relative copy number profiles from whole exome sequencing of GBM-719 xenograft samples. Segments of gains (red) or deletions (blue) are colour-coded based on log2 copy number ratios. Frequent loss of chromosome 10 is a common observation in GBM. g, Summary of patient characteristics for all tumour samples used throughout the study, and the experiment(s) that each sample is used for.
Extended data Figure 3
Extended data Figure 3. Functional characterization of GBMs and GBM xenografts.
a, H&E and human-specific nestin staining in primary glioblastoma specimens, scale bar = 100 µm. b, H&E and human-specific nestin staining for representative GBM xenografts, scale bar = 100 µm. c, Survival analysis of xenografts derived from the indicated GBM model and treatment conditions. All survival analyses were performed using a log-rank test (n = 4 mice per group with the exception of the GBM-754 experiment, Vehicle – Vehicle group which contains 3 mice). d, Quantification of percentage proliferative activity in serial xenografts by Ki-67 staining and percentage apoptosis by cleaved Caspase-3 staining, mean ± sd of 6 representative sections from the same xenograft sample.
Extended data Figure 4
Extended data Figure 4. GSCs are able to invade contralaterally and have heterogeneous clonal outputs.
a, Human-specific nestin staining in representative xenografts between ipsilateral and contralateral hemispheres (scale bar = 1mm, Ipsi: ipsilateral hemisphere, Contra: contralateral hemisphere). b, Comparison of cell numbers recovered from xenografts between the ipsilateral and contralateral fractions, two-sided paired t-tests. Single data points are overlaid over the box plot, the horizontal line represents the median, and the lower and upper hinges represent the 25th and 75th quartiles respectively. The lower and upper whiskers extend from the hinge to the lowest and highest values within 1.5 times the inter-quartile range (IQR). c, Plot of Pearson correlation coefficients comparing relative clone sizes between two hemispheres, for the indicated sample groups. The box-plots are displayed as with panel (b). d, Clonal composition of tumours generated serially from contralateral fractions, grouped according to the geographical distribution of each detected clone in the previous (primary) passage. e, Clone size distributions for representative xenograft samples. All data shown are from ipsilateral hemispheres, not treated with TMZ, and generated from ipsilateral-derived cells from the previous passage (in the case of secondary and tertiary xenografts). Fits to a negative binomial distribution (curve) are included for patients with rich data sets (GBM-719, GBM-742, and GBM-754), used for quantitative analyses. Plot titles identify the respective sequence of serial passages by the nomenclature introduced in the Supplementary Theory. f, Representative correlation of clone size between successive serial passages of GBM-719 untreated xenografts with Pearson’s r indicated. P1: primary passage, P2: secondary passage, P3: tertiary passage. g, Representative correlations of clone size between different secondary passage replicate experiments derived from the same primary xenograft as panel (f), with Pearson’s r indicated. The red arrowhead shows deviations from a linear correlation due to large outliers. R1: replicate 1, R2: replicate 2, R3: replicate 3.
Extended data Figure 5
Extended data Figure 5. First incomplete moment of clone size distributions for GBM-719, -729, and -735 xenografts.
a-c, First incomplete moments of the clone size distributions for all xenograft samples derived from patient tumours GBM-719 (a), GBM-729 (b), and GBM-735 (c). Samples are named according to the sequence of samples injected, V: vehicle treated, T: TMZ treated, C: generated from the contralateral fraction of the previous passage. For illustrative purposes, GBM-719 xenografts (a) that are TMZ-treated are marked with a red arrowhead where the distribution appears to deviate from the negative binomial. The indicated fit parameter n0 describe a characteristic clone size of the population (Supplementary Theory 2-3). Where Group B clones (large outliers) were removed to generate a more accurate fit, the number of clones removed is indicated and the re-calculated first incomplete moment distributions with outliers removed are plotted in grey. d, Schematic describing how a sequence of treatments resulting in a particular xenograft sample is incorporated into the sample nomenclatures.
Extended data Figure 6
Extended data Figure 6. First incomplete moment of clone size distributions for GBM-742, -743, and -754 xenografts and variant allele frequencies (VAFs) for GBM-719 xenografts.
a-c, First incomplete moments of the clone size distributions for all xenografts derived from the tumours GBM-742 (a), GBM-743 (b), and GBM-754 (c). Sample and plot annotations are as described for Extended data figure 5. d, Distribution of variant allele frequencies (VAFs) across GBM-719 xenograft samples. Mutations with a VAF of 0.5 likely corresponds to variants in the clonal population (found in all cells within the tumour), while less prevalent mutations correspond to subclonal populations defined by recent mutational events found only in a subset of cells. e, Comparison of VAF values for mutations in paired secondary and tertiary passages. f, First incomplete moments show a negative binomial distribution for VAF values below 0.5 across xenograft samples. The dashed line shows a fit to the exponential and the vertical line marks a VAF of 0.5. g, First incomplete moments for mutations that are newly detected in the tertiary vehicle- and TMZ-treated passage. h, Same as panel (f) after filtering out mutations that do not occur in diploid regions of the genome. i, Same as panel (g) after filtering out mutations that do not occur in diploid regions of the genome.
Extended data Figure 7
Extended data Figure 7. Barcode analysis of xenograft derived cultures.
a, Proportional Venn diagrams depicting the number of unique and shared barcoded clones as defined by the in vivo passages (primary, secondary, or tertiary), that are also detectable within the specified xenograft-derived cultures. b, Comparison of clone sizes between paired primary xenografts and primary xenograft-derived GSC cultures. c, Correlation of clone sizes between TMZ-treated GBM-719 xenografts, and cultures derived from these xenografts. A select cluster of clones that become outcompeted after secondary xenografts are outlined in blue, and Spearman’s rho coefficients are as indicated. d, First incomplete moments of the full clone size distributions for GBM-754 primary xenograft cultures at different times throughout culture expansion. e, First incomplete moments of the clone size distributions used in panel (d), with the 14 largest outlier clones removed from each sample. f, Pairwise clone size comparisons between replicate cultures in (d), with Spearman’s rho indicated.
Extended data Figure 8
Extended data Figure 8. First incomplete moment of clone size distributions for remaining GBM xenograft derived cultures.
a, Plots of first incomplete moment for cultures derived from the indicated GBM xenografts. b, Same as (a), with the indicated number of large outlier clones removed from the analysis.
Extended data Figure 9
Extended data Figure 9. Epigenetic drug screening of GBM-754 primary xenograft culture.
a, Primary drug screen of GBM-754 primary xenograft-derived culture, with growth assessed as culture density relative to DMSO control. Compounds highlighted in blue were used in subsequent experiments. b, Strategy to identify clonal differences in drug response. Cells are treated in duplicate with each compound, and allowed to repopulate to the same density as DMSO controls prior to barcode sequencing. c, Summary of results from drug repopulation experiments. The top plot shows the ratio between sum relative clone sizes of Group B and Group A, technical replicates are denoted as 1, 2, or 3. The horizontal line marks the mean Group B/Group A ratio for DMSO treated cultures. The bottom plot shows the number of reads obtained from each sample after repopulation, relative to DMSO. The horizontal line marks the mean number of reads for DMSO samples. d, Additional technical replicate experiments related to Fig. 3g, demonstrating selectivity of UNC1999 and MI-2-2 on Group A and B clones respectively. e, Dose response assays for the indicated GSC culture models upon UNC1999 and MI-2-2 treatment, mean ± sd of 6 technical replicates. f, Two additional independent experiments related to Fig. 3h. P values for the left and right replicates respectively are 6.95 × 10⁻⁴; 0.148 for DMSO vs. CI-994, 0.338; 0.55 for DMSO vs. GSK591, 3.31 × 10⁻³; 0.0177 for DMSO vs. UNC1999, 2.15 × 10⁻¹¹; 1.59 × 10⁻⁷ for DMSO vs. MI-2-2, 1.49 × 10⁻¹⁰; 3.7 × 10⁻¹² for MI-nc vs. M, 0.963; 0.408 for M vs. M + C, 0.355; 0.408 for M vs. M + G, 2.68 × 10⁻⁹; 6.06 × 10⁻⁸ for M vs. M + U. g, Combined effect of GSK343 and MI-2-2 on self-renewal. P = 4.42 × 10⁻⁶ for DMSO vs GSK343, 2.96 × 10⁻¹² for DMSO vs MI-2-2, 3.62 × 10⁻⁶ for GSK343 vs M + G, 0.0125 for MI-2-2 vs M + G. h, Combined effect of UNC1999 and MI-2-2 on self-renewal when used at 1 μM, representative of 3 independent experiments. P = 0.147 for DMSO vs. UNC1999, 0.129 for DMSO vs MI-2-2, 9.84 × 10⁻⁴ for DMSO vs. M + U. i, Two additional independent experiments related to Fig. 3i. P values for the left and right replicates respectively are 4.59 × 10⁻⁵; 4.81 × 10⁻¹⁵ for DMSO vs. UNC1999, 3.28 × 10⁻²⁵; 1.13 × 10⁻³¹ for DMSO vs MI-2-2, 1.86 × 10⁻¹¹; 3.61 × 10⁻⁶ for UNC1999 vs MI-2-2. j-m, Combined effect of UNC1999 and MI-2-2 on self-renewal in the indicated GSC culture models. P values for the G523, G549, G564, G566 experiments respectively are 1.9 × 10⁻⁵; 1; 0.758; 0.799 for DMSO vs UNC1999, 8.14 × 10⁻¹⁸; 2.14 × 10⁻⁴; 0.503; 6.12 × 10⁻⁴ for DMSO vs MI-2-2, 2.72 × 10⁻¹²; 3.28 × 10⁻³⁰; 1.15 × 10⁻²¹; 2.54 × 10⁻⁸ for UNC1999 vs M + U, 7.69 × 10⁻³; 1.26 × 10⁻¹⁵; 2.61 × 10⁻¹⁸; 8.82 × 10⁻³ for MI-2-2 vs M + U. n, Combined effect of UNC1999 and MI-2-2 on self-renewal of uncultured GBM-851 cells. P = 3.01 × 10⁻³ for DMSO vs UNC1999, 1.36 × 10⁻⁴ for DMSO vs MI-2-2, 3.11 × 10⁻³ for UNC1999 vs M + U, 0.0276 for MI-2-2 vs M + U. Analysis of LDA results was performed using ELDA software, error bars represent 95% confidence interval (ns P > 0.05, * P ≤ 0.05, ** P ≤ 0.01, *** P ≤ 0.001).
Extended data Figure 10
Extended data Figure 10. First incomplete moment of the clone size distributions for drug-treated GBM-754 primary xenograft cultures.
a, First incomplete moments of the full clone size distributions of GBM-754 primary xenograft cultures treated with different drugs. b, First incomplete moments of the clone size distributions used in panel (a), with 5 group B clones removed.
Figure 1
Figure 1. Serial transplantation scheme and characterization of barcoded glioblastoma xenografts.
a, General transplantation scheme for barcoded xenografts derived from primary GBM tumour cells (GBM-719). b, Staining of a secondary GBM-719 xenograft with the indicated markers, scale bar = 100 μm. c, Tumour growth quantified as the estimated fold-change in cell number between injection and harvesting for different ipsilateral derived GBM-719 xenografts. Lines indicate serial transplantation trajectories. d, Proportional Venn diagrams depicting the number of barcoded clones unique to each passage or shared between passages for the indicated experiment.
Figure 2
Figure 2. Clonal dynamics of GBM is consistent with a conserved proliferative hierarchy.
a, Clone size distributions of xenografts derived from GBM-719 cells across different passages. For the primary passage, distributions for the ipsilateral (blue) and contralateral sides (red) are shown. For the secondary and tertiary passages, distributions for the ipsilateral side from different replicate experiments are shown (shades of blue). b, First incomplete moment of the corresponding clone size distributions shown in panel (a), displayed on a logarithmic scale (Supplementary Theory 2). Dashed lines show exponentials as a guide for the eye. The red arrowhead indicate deviations from exponential behaviour due to a small number (<4%) of outlier clones. c, A minimal model of tumour growth based on a three-component hierarchy involving transitions from a slow-cycling stem-like compartment (S) to a more rapidly cycling progenitor population (P) to a non-dividing compartment (D). Following S cell divisions, a fraction, ε, result in symmetric fate outcome while the remainder lead to asymmetric fate. With equal probability, P cells divide symmetrically or give rise to D cells which, in turn, rapidly undergo apoptosis. d, Representative clone size trajectories computed for the model shown in (c). Different curves correspond to different clones across three serial passages, along with the average over all trajectories, with the S cell division rate of 0.15/ day, the P cell division rate of 1/day, the D cell apoptosis rate of 0.5/day and ε = 15% (for details, see Supplementary Theory 5). e, First incomplete moment of the clone size distribution across passages derived from 2×10⁶ simulated clone trajectories. The shaded areas show the regions within which 95% of the respective curves fall for repeated simulations with 5×10⁴ clones each. For each passage, the first incomplete moment follows an approximate exponential size dependence. Parameters as in panel (d). f, Clone size correlation for different passages in the model (distributions) and from representative xenografts derived from GBM-719 cells (data points). Distributions show model results within the biologically plausible parameter range (see Supplementary Theory, Table S2). See Supplementary Theory, Figure S3 for other patients. g, Fraction of initially injected clones growing above half of the characteristic clone frequency n0/2 for the same datasets as in (f) (see Supplementary Theory 6.3). See Supplementary Theory, Figure S2 for other patients. h, Simulated examples of clone size correlations across successive serial passages. Parameters are as in panel (d).
Figure 3
Figure 3. Chemotherapy reveals clonal transformations in GBM.
a, Correlation of clone sizes for the primary, untreated xenograft with secondary xenografts treated with TMZ (light and dark dots indicate two replicate secondary xenografts). Light dataset – Group A: 1255 data points, Group B: 15 data points; dark dataset – Group A: 1228 data points, Group B: 10 data points. b, Correlation of clone sizes for a secondary TMZ-treated xenograft (light dots in panel (a)) with tertiary TMZ-treated xenografts, light and dark dots indicate two replicate tertiary xenografts. Light dataset – Group A: 95 data points, Group B: 15 data points; dark dataset – Group A: 117 data points, Group B: 15 data points. c, Correlation of the two replicate secondary xenografts shown in (a) with Spearman’s rho indicated. d, Correlation of the two replicate tertiary xenografts shown in (b) with Spearman’s rho indicated. e-f, Correlation of clone sizes obtained from simulations with a subset of clones being resistant to cell death (blue dots) and the remaining clones following unperturbed dynamics (green dots) for a primary and secondary passage (e) and a secondary and tertiary passage (f) (see Supplementary Theory 6.5). The S cell division rate is set at 0.1/day, the P cell division rate is 1.5/day, ε = 10%, and the apoptosis rate is set at 0.7/day with a 0.5% chance of each clone to show resistance to apoptosis (see Supplementary Theory, Table S3). g, Selectivity of UNC1999 and MI-2-2 for group A and B clones respectively, representative of 2 technical replicate experiments. Shown are relative clone sizes after DMSO treatment, or regrowth following selection with indicate compounds. The indicated values are clone sizes for groups A (black) and B (blue), lines connect the same barcoded clone under different conditions. h, Reduction of self- renewal ability upon treatment with epigenetic compounds alone and in combination as assessed by limiting dilution analysis (LDA), representative of 3 independent experiments (MI-nc: inactive control for MI-2-2, M: MI-2-2, C: CI-994, G: GSK591, U: UNC1999). P = 0.0663 for DMSO vs. CI-994, 0.132 for DMSO vs. GSK591, 0.216 for DMSO vs. UNC1999, 5.74×10⁻¹³ for DMSO vs. MI-2-2, 4.11×10⁻¹⁸ for MI-nc vs. M, 1 for M vs. M+C, 0.432 for M vs. M+G, 8.53×10⁻⁸ for M vs. M+U. i, MI-2-2 abrogates self-renewal in TMZ-transformed GBM-719 population, representative of 3 independent experiments. P = 3.73×10⁻³ for DMSO vs. UNC1999, 1.16×10⁻²⁷ for DMSO vs MI-2-2, 1.61×10⁻¹⁶ for UNC1999 vs MI-2-2. All LDA results are representative of 3 independent experiments with the remaining experiments presented in Extended Data Fig. 9. Analysis of all LDA results was performed using ELDA software, error bars represent 95% confidence interval (ns P > 0.05, * P ≤ 0.05, ** P ≤ 0.01, *** P ≤ 0.001). j, MI-2-2 inhibits tumour growth in subcutaneous xenografts derived from TMZ-transformed GBM-719 cells, n = 9 tumours per group, two-sided unpaired t-test. The horizontal line indicates the mean tumour weight of each experimental group.

Comment in

References

    1. Stupp R, et al. Radiotherapy plus concomitant and adjuvant temozolomide for glioblastoma. N Engl J Med. 2005;352:987–996. doi: 10.1056/NEJMoa043330. - DOI - PubMed
    1. Singh SK, et al. Identification of human brain tumour initiating cells. Nature. 2004;432:396–401. doi: 10.1038/nature03128. - DOI - PubMed
    1. Chen J, et al. A restricted cell population propagates glioblastoma growth after chemotherapy. Nature. 2012;488:522–526. doi: 10.1038/nature11287. - DOI - PMC - PubMed
    1. Patel AP, et al. Single-cell RNA-seq highlights intratumoral heterogeneity in primary glioblastoma. Science. 2014;344:1396–1401. doi: 10.1126/science.1254257. - DOI - PMC - PubMed
    1. Tirosh I, et al. Single-cell RNA-seq supports a developmental hierarchy in human oligodendroglioma. Nature. 2016;539:309–313. doi: 10.1038/nature20123. - DOI - PMC - PubMed

Publication types

MeSH terms