. 2017 Sep 7;549(7670):96-100.
doi: 10.1038/nature23647. Epub 2017 Aug 30.

Orthotopic patient-derived xenografts of paediatric solid tumours

Affiliations

Orthotopic patient-derived xenografts of paediatric solid tumours

Elizabeth Stewart et al. Nature. .

Abstract

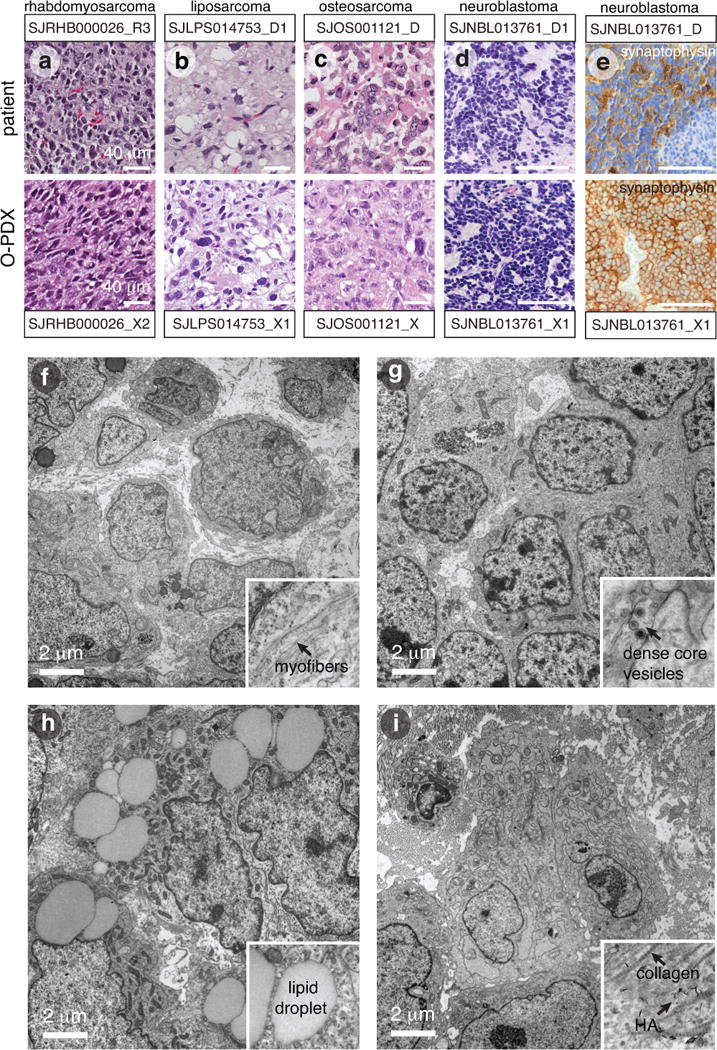
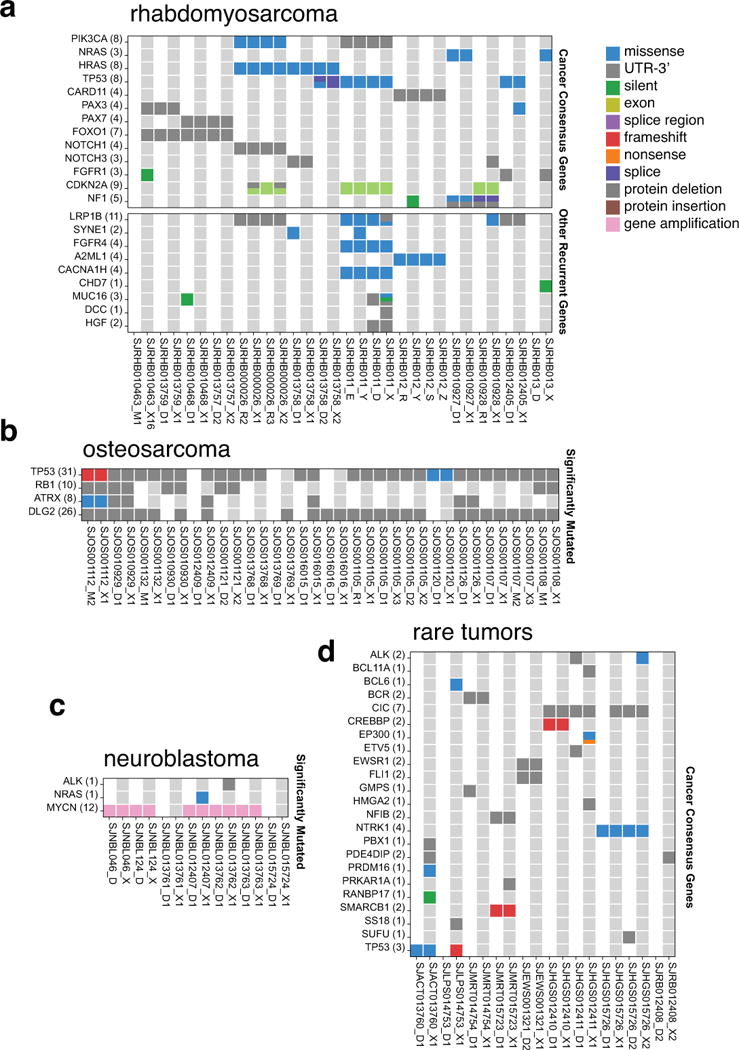
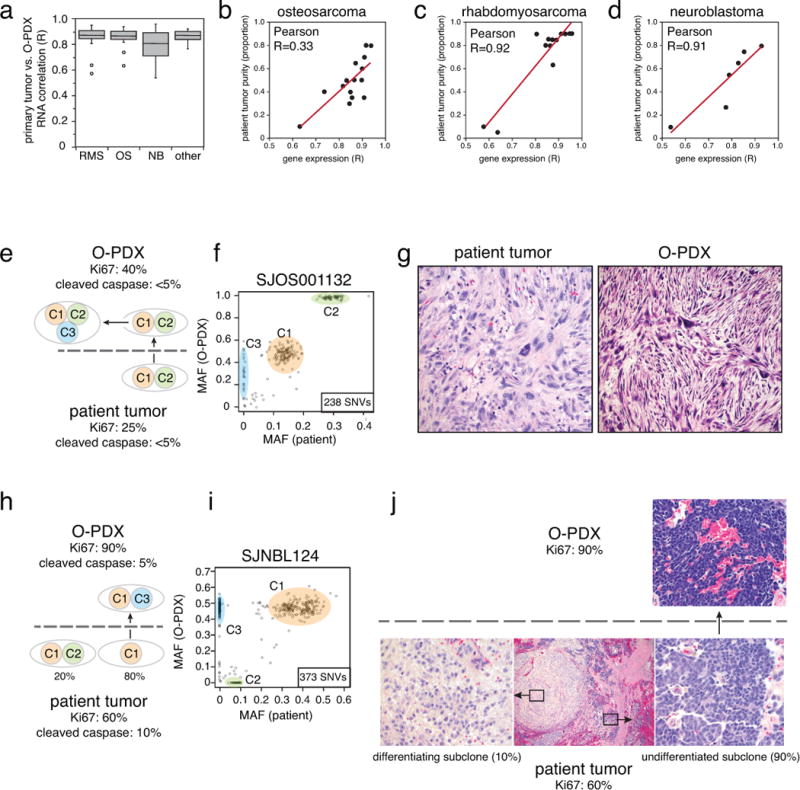
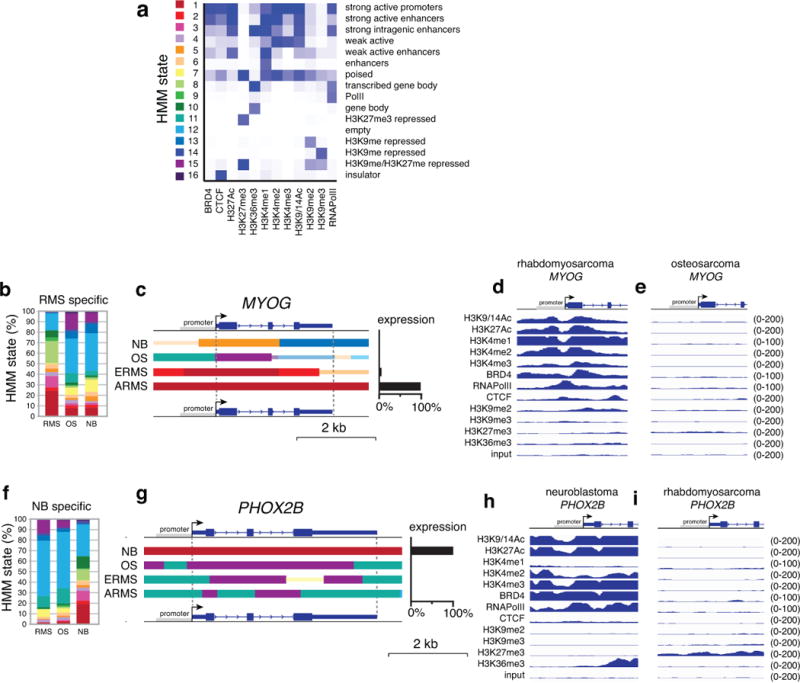
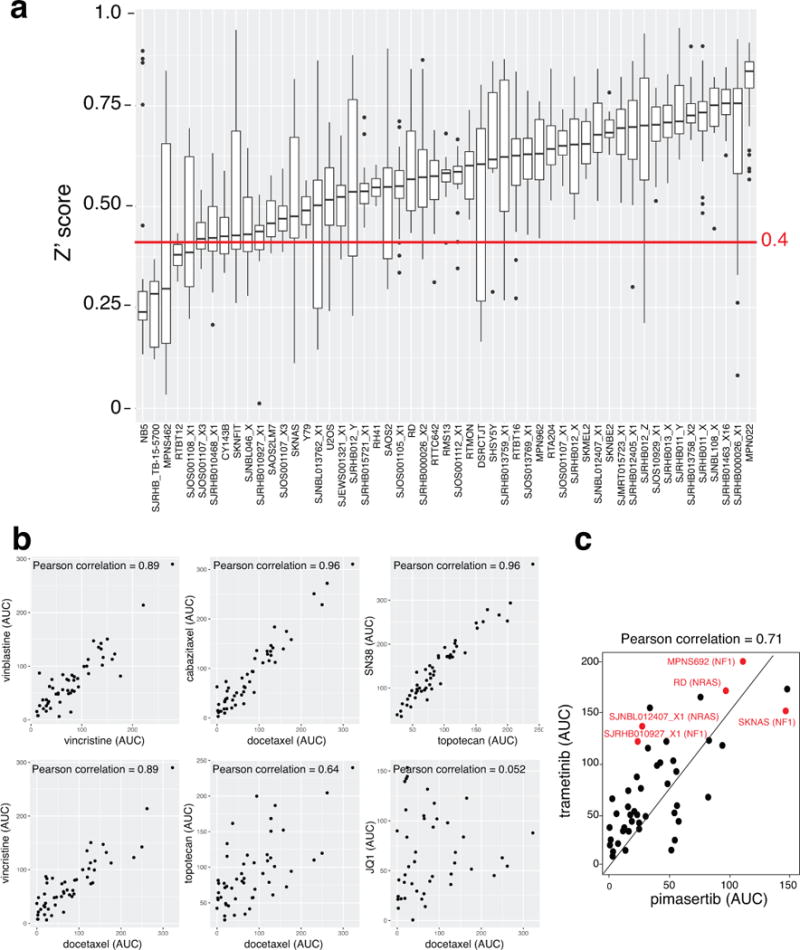
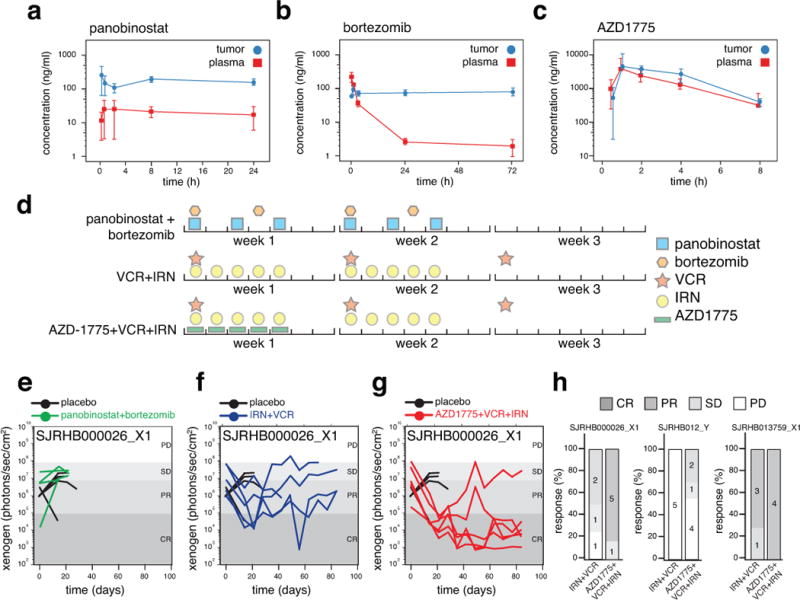
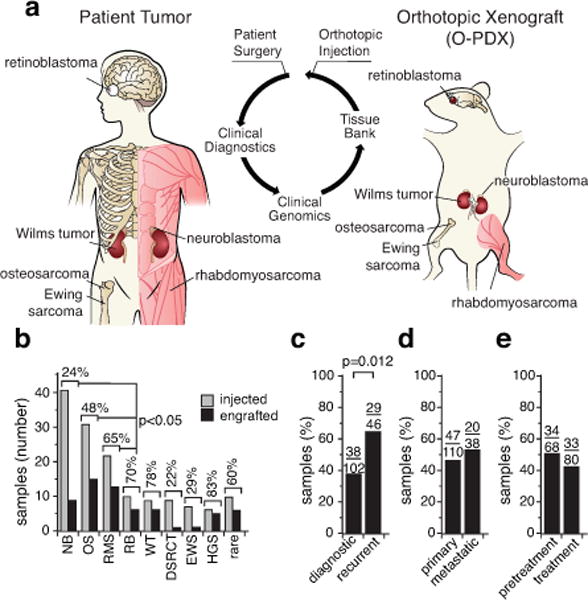
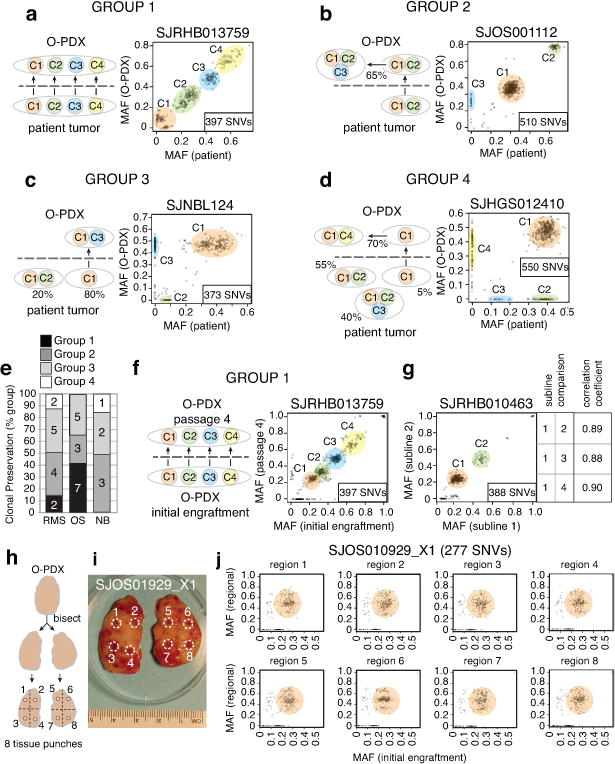
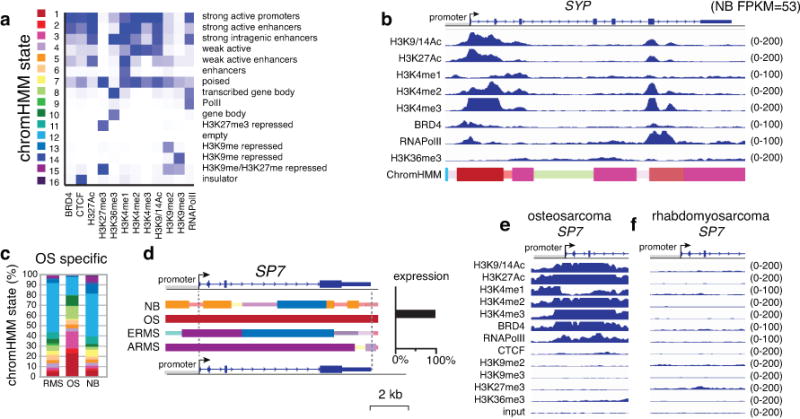
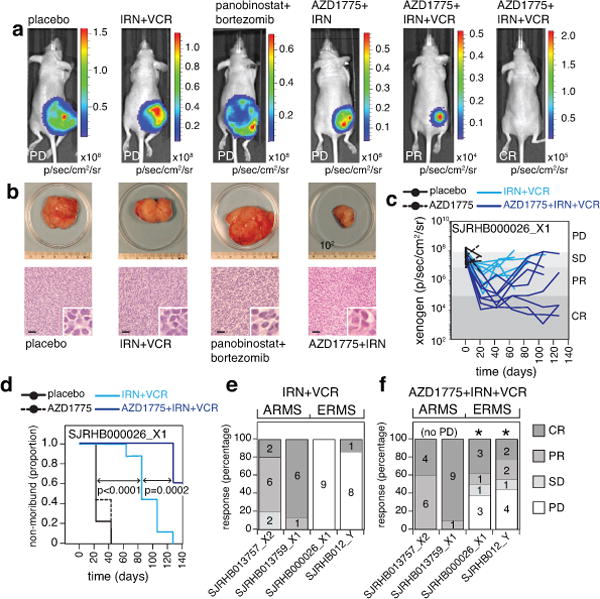
Paediatric solid tumours arise from endodermal, ectodermal, or mesodermal lineages. Although the overall survival of children with solid tumours is 75%, that of children with recurrent disease is below 30%. To capture the complexity and diversity of paediatric solid tumours and establish new models of recurrent disease, here we develop a protocol to produce orthotopic patient-derived xenografts at diagnosis, recurrence, and autopsy. Tumour specimens were received from 168 patients, and 67 orthotopic patient-derived xenografts were established for 12 types of cancer. The origins of the patient-derived xenograft tumours were reflected in their gene-expression profiles and epigenomes. Genomic profiling of the tumours, including detailed clonal analysis, was performed to determine whether the clonal population in the xenograft recapitulated the patient's tumour. We identified several drug vulnerabilities and showed that the combination of a WEE1 inhibitor (AZD1775), irinotecan, and vincristine can lead to complete response in multiple rhabdomyosarcoma orthotopic patient-derived xenografts tumours in vivo.


Conflict of interest statement

AUTHOR INFORMATION The authors declare no competing financial interests. Readers are welcome to comment on the online version of the paper. Publisher’s note: Springer Nature remains neutral with regard to jurisdictional claims in published maps and institutional affiliations.

Figures

Extended Data Figure 1
Extended Data Figure 1. O-PDX models retain the cellular features of the corresponding patient tumors
(a–d) Micrographs of hematoxylin and eosin–stained patient tumors and corresponding O-PDX tumors for a representative rhabdomyosarcoma (a), liposarcoma (b), osteosarcoma (c), and neuroblastoma (d). (e) Immunohistochemical staining for synaptophysin (brown) for SJNBL013761_D and the matched O-PDX. (f–i) Transmission electron micrographs of a representative rhabdomyosarcoma (f), neuroblastoma (g), liposarcoma (h), and osteosarcoma (i). Inset for each micrograph is a higher magnification view of a key cellular hallmark of each tumor. Abbreviations: HA, hydroxyapatite. Scale bars a–e, 40 μm; f–i, 2 μm.
Extended Data Figure 2
Extended Data Figure 2. O-PDX tumors retain the genomic features of the patient tumors
(a–d) Heat maps of the 51 tumors that had sufficient material for whole-genome sequencing and whole-exome sequencing analyses. Individual O-PDX/patient tumor pairs are indicated by alternating gray and white columns. Heat maps are grouped based on the disease: rhabdomyosarcoma (a), osteosarcoma (b), neuroblastoma (c), and rare tumors (d).
Extended Data Figure 3
Extended Data Figure 3. Molecular and cellular clonal heterogeneity
(a) Boxplot of the correlation coefficient (R) between each O-PDX and the corresponding patient tumor. (b–d) Scatterplots for the gene-expression correlation coefficients for the patient tumor compared to the O-PDX relative to the patient tumor purity determined from whole genome sequencing. The Pearson correlation between those 2 variables is indicated for each tumor type. The line of best fit for the data is shown (red). (e,f) Diagram and scatterplot of the clonal changes in SJOS001132 between the patient tumor and the O-PDX. The proportion of proliferating cells as measured by Ki67 immunostaining and dying cells as measured by cleaved caspase 3 immunostaining. The patient tumor had a major clone with two clusters of SNVs (C1 and C2) that then continued to evolve and diverge in the O-PDX into two distinct clones. One clone contains the original SNVs found in the patient tumor (C1 and C2) and the other clone has an additional cluster of SNVs (C3). The total number of SNVs analyzed in this sample was 238. g) Hematoxylin and eosin staining of the patient tumor and the O-PDX showing an expansion of cells with more aggressive pleiomorphic cellular features. h,i) Diagram and scatterplot of the clonal changes in SJNBL124 between the patient tumor and the O-PDX. The proportion of proliferating cells as measured by Ki67 immunostaining and dying cells as measured by cleaved caspase 3 immunostaining. The patient tumor had a major clone (80% of the tumor) with one clusters of SNVs (C1) and a minor clone (20% of the tumor) with two clusters of SNVs (C1 and C2). In the O-PDX, the minor clone was lost and the tumor continue to evolve and acquire an additional cluster of SNVs (C3). The total number of SNVs analyzed in this sample was 373. j) In the hematoxylin and eosin stained patient tumor, there was a major clone (90% of the tumor) with proliferating small round cells and a minor clone (10% of the tumor) that had features of differentiated neuroblastoma cells. The cells with features of differentiated cells were lost in the O-PDX.
Extended Data Figure 4
Extended Data Figure 4. Epigenetic landscape reflects cellular origins
(a) Heatmap of the HMM states used in this study. (b) Stack histogram of the percentage of each of the 16 HMM states for the genes expressed specifically in rhabdomyosarcoma across the 3 tumor types (OS, NB, RMS). (c) Representative HMM and expression of a gene (MYOG) that is specifically expressed in rhabdomyosarcoma. (d,e) Corresponding ChIP-seq peaks for all 12 antibodies and the input sample for the MYOG promoter in the rhabdomyosarcoma and osteosarcoma O-PDXs. (O) Stack histogram of the percentage of each of the 16 HMM states for the genes expressed specifically in neuroblastoma across the 3 tumor types (OS, NB, RMS). (f) Representative HMM and expression of a gene (PHOX2B) that is specifically expressed in neuroblastoma. (g,h) Corresponding ChIP-seq peaks for all 12 antibodies and the input sample for the PHOX2B promoter in the neuroblastoma and rhabdomyosarcoma O-PDXs. Abbreviations: HMM, Hidden Markov Modeling; NB, neuroblastoma; OS, osteosarcoma; RMS, rhabdomyosarcoma.
Extended Data Figure 5
Extended Data Figure 5. Drug screening quality control
a) Box plot for the Z-prime score for each of the 1,911 plates screened in this study that passed our quality control metrics. Most cell models (O-PDXs and cell lines) had a z-prime score above 0.4 (red line). The average z-prime was 0.57 and 95% of plates had z-prime between 0.27 and 0.82. b) Scatterplot of area under the curve (AUC) for the dose response curves for pairs of drugs with similar and dissimilar mechanisms. Larger AUC values represent greater drug potency (killing). The Pearson correlation is shown for each drug pair. c) Scatterplot of AUC for the dose response curve for two MEK inhibitors (trametinib and selumetinib). The cell models highlighted in red have mutations in the RAS/NF1/MEK pathway.
Extended Data Figure 6
Extended Data Figure 6. Preclincial pharmacokinetics and in vivo preclinical phase II
(a–c) Concentration-time curves for panobinostat, bortezomib and AZD1775 in mice bearing O-PDX tumors. Each data point is the mean and standard deviation of triplicate animals. The pharmacokinetics for IRN and VCR had been determined previously. (d) Outline of the schedule used for the combination of panobinostat with bortezomib, VCR+IRN as the standard of care and AZD1775+VCR+IRN. The schedules were selected to match that used in patients and the dose was selected to provide the same plasma exposure based on the pharmacokinetics in (a–c). (e–g) Line graphs of tumor response for individual SJRHB000026_X1 mice on the preclinical phase II study for placebo-treated mice and each of the 3 treatment groups. Each line indicates an individual mouse with tumor. (h) Stack bar plots of the response percentages for 3 different RMS O-PDX models with standard of care for recurrent RMS (IRN+VCR) and the AZD1775+VCR+IRN treatment regimen. The numbers of mice in each response category are indicated on the plot.
Figure 1
Figure 1. Generation of pediatric solid tumor O-PDX models
(a) Drawing of orthotopic implantation in immunocompromised mice. (b) Histogram of engraftment efficiency by tumor type. (c–e) Histograms of engraftment efficiency for diagnostic and recurrent samples (c), primary and metastatic samples (d), and pretreatment versus samples collected during treatment (e). The number of tumor specimens are indicated over each bar from Supplementary Table 1. Abbreviations: DSRCT, desmoplastic small round cell tumor; EWS, Ewing sarcoma; HGS, high-grade sarcoma; NB, neuroblastoma; OS, osteosarcoma; RB, retinoblastoma; RMS, rhabdomyosarcoma; WT, Wilms tumor.
Figure 2
Figure 2. Clonal preservation in O-PDX tumors
(a–d) Representative scatterplots of mutant allele frequency (MAFs) for the SNVs analyzed by capture-based Illumina sequencing. Individual clones are color-coded and labeled C1–C4. (a) Group 1 includes O-PDX tumors that preserved the clonal diversity and ratios of the patient tumors. (b) Group 2 includes O-PDX tumors that preserved the clonal diversity and ratios of the patient tumors and continued to evolve in the mice. (c) Group 3 includes O-PDX tumors that lost at least 1 clone in the patient tumor but were derived from a major clone. (d) Group 4 includes O-PDX tumors that were derived from a minor clone (<10%). (e) Stack histogram of the percentage of groups 1–4 clonal classification by tumor type. The number of samples in each group are indicated on the histogram. (f) Comparison of clonal composition at initial engraftment and after passage 4. (g) Comparison of multiple sublines from the same patient. Clonal composition across those sublines is indicated in the box. (h,i) Drawing and photograph of the sampling of 8 regions of the O-PDX tumors for analysis of regional clonal heterogeneity. (j) Clonal analysis for all 8 regions of the tumor shown in (i) showing clonal preservation across all 8 regions. Abbreviations: NB, neuroblastoma; OS, osteosarcoma; RMS, rhabdomyosarcoma; SNVs, single-nucleotide variations.
Figure 3
Figure 3. O-PDX tumors retain epigenetic and molecular signatures of their diverse cellular origins
(a) Heatmap of the chromHMM states used in this study. (b) ChIP-seq data from the neuroblastoma O-PDX for the synaptophysin (SYP) gene (RNA-seq FPKM=53 in neuroblastoma but <1.0 for other tumor types). The chromHMM states for each region of the gene are indicated below the ChIP-seq peaks, and the scale for the ChIP-seq is indicated on the right of each track. The 2 states that are the highest proportion are full-height bars, and the remaining 9 states are half height. The intensity of each bar is proportional to the percentage of each state across all samples for that gene. For the bars that are half the height, the intensity is scaled, starting at 50% of maximum intensity. (c) Stack histogram of the percentage of each of the 16 chromHMM states for the genes expressed specifically in osteosarcoma across the 3 tumor types (OS, NB, RMS). (d) ChromHMM and expression of a gene (SP7) that is specifically expressed in osteosarcoma. (e,f) ChIP-seq peaks for all 12 antibodies for the SP7 promoter in osteosarcoma and rhabdomyosarcoma O-PDXs. Abbreviations: chromHMM, chromatin Hidden Markov Modeling; NB, neuroblastoma; OS, osteosarcoma; RMS, rhabdomyosarcoma.
Figure 4
Figure 4. Preclinical phase III using O-PDX models
(a) Xenogen images showing luciferase bioluminescence for progressive disease (PD), partial response (PR), and complete response (CR). (b) Photographs of tumors for each treatment group corresponding to the images above in (a) and micrographs of corresponding hematoxylin and eosin–stained sections. (c) Line graph of tumor response for 1 of the 4 RMS O-PDX models used in the preclinical phase III study. (d) Survival curve for the mice shown in (c) for each of the 4 treatment groups. (e,f) Stack bar plots of the percentage response for each of the 4 O-PDX models in the preclinical phase III study for standard of care (IRN+VCR) (e) and the addition of AZD1775 (f). The (*) indicates those models that had a significant difference in tumor progression for the AZD1775+IRN+VCR relative to IRN+VCR. The source data are in Supplementary Tables 7,8. Abbreviations: IRN, irinotecan; VCR, vincristine; ARMS, alveolar rhabdomyosarcoma; ERMS, embryonal rhabdomyosarcoma. Scale bars: b, 50 μm.

Comment in

  • Cancer models: The next best thing.
    Murakami MA, Weinstock DM. Murakami MA, et al. Nature. 2017 Sep 7;549(7670):39-41. doi: 10.1038/nature23545. Epub 2017 Aug 30. Nature. 2017. PMID: 28854165 No abstract available.

References

    1. Chen X, Pappo A, Dyer MA. Pediatric solid tumor genomics and developmental pliancy. Oncogene. 2015;34:5207–5215. doi: 10.1038/onc.2014.474. - DOI - PMC - PubMed
    1. Smith MA, Altekruse SF, Adamson PC, Reaman GH, Seibel NL. Declining childhood and adolescent cancer mortality. Cancer. 2014;120:2497–2506. doi: 10.1002/cncr.28748. - DOI - PMC - PubMed
    1. van de Wetering M, et al. Prospective derivation of a living organoid biobank of colorectal cancer patients. Cell. 2015;161:933–945. doi: 10.1016/j.cell.2015.03.053. - DOI - PMC - PubMed
    1. Boj SF, et al. Organoid models of human and mouse ductal pancreatic cancer. Cell. 2015;160:324–338. doi: 10.1016/j.cell.2014.12.021. - DOI - PMC - PubMed
    1. Gao D, et al. Organoid cultures derived from patients with advanced prostate cancer. Cell. 2014;159:176–187. doi: 10.1016/j.cell.2014.08.016. - DOI - PMC - PubMed

Publication types

MeSH terms