Meta-Analysis
. 2017 Aug 30;12(8):e0183673.
doi: 10.1371/journal.pone.0183673. eCollection 2017.

Education of staff in preschool aged classrooms in child care centers and child outcomes: A meta-analysis and systematic review

Affiliations
Meta-Analysis

Education of staff in preschool aged classrooms in child care centers and child outcomes: A meta-analysis and systematic review

Olesya Falenchuk et al. PLoS One. .

Abstract

Staff education is considered key to quality of early childhood education and care (ECEC) programs. However, findings about associations between staff education and children's outcomes have been inconsistent. We conducted a systematic review and meta-analysis of associations between ECEC staff education and child outcomes. Searches of Medline, PsycINFO, and ERIC, websites of large datasets and reference sections of all retrieved articles were conducted. Eligible studies provided a statistical link between staff education and child outcomes for preschool-aged children in ECEC programs. Titles, abstracts and paper reviews as well as all data extraction were conducted by two independent raters. Of the 823 studies reviewed for eligibility, 39 met our inclusion criteria. Research in this area is observational in nature and subject to the inherent biases of that research design. Results from our systematic review were hampered by heterogeneity in how staff education was defined, variability in whose education was measured and the child outcomes that were assessed. However, overall the qualitative summary indicates that associations between staff education and childhood outcomes are non-existent to very borderline positive. In our meta-analysis of more homogeneous studies we identified certain positive, albeit very weak, associations between staff education and children's language outcomes (specifically, vocabulary and letter word identification) and no significant association with a mathematics outcome (WJ Applied Problems). Thus, our findings suggest that within the range of education levels found in the existing literature, education is not a key driver of child outcomes. However, since we only explored levels of education that were reported in the literature, our findings cannot be used to argue for lowering education standards in ECEC settings.


Conflict of interest statement

Competing Interests: The authors have declared that no competing interests exist.

Figures

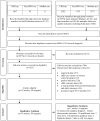
Fig 1
Fig 1. Flow diagram for study selection.
Adapted from Moher et al. [45]
Fig 2
Fig 2. Systematic review of the associations between staff education (AA or Higher; BA or Higher) and child outcomes.
a Abbreviations: AA = Associate’s Degree; BA = Bachelor’s Degree. Symbols bolded are significant and positive, symbols bolded and italicized are significant and negative, and symbols in grey are non-significant. Star = Zero Order Pearson’s Correlation, Unfilled circle = Beta, Filled square = Unstandardized Coefficient, Downward arrow = Effect Size. aTo improve the readability of this complex table, eleven papers [,,–57,61,63,67,70,71,82] that had an outcome that appeared in only that one paper were omitted from this table. Several analyses from other papers that had idiosyncratic outcomes are also excluded. For a comprehensive display of all of the data for all of the child outcomes see Tables A-H in S4 File. bThis paper is one of a series of Meta-Analyses and Systematic Reviews assessing the relationship between child care quality and children’s outcomes; therefore, superscript letters below are in reference to various large databases that samples in these papers were drawn from. These letters have been kept consistent across the series for our readers. cSamples within papers are described in more detail in Table 3 in the manuscript. dAcronyms for child outcomes are listed in S3 File and for journals, large samples and covariates are in S5 File. eIdentifying Letters (also refers to as Alphabet Recognition Test, Naming Letters, and Letter-Naming Test). ANational Center for Early Development and Learning Dataset (NCEDL, 2002, 2004); BHead Start Family and Children Experiences Survey (FACES, 2006 Cohort); KHead Start Family and Children Experiences Survey (FACES, 2000 Cohort); LHead Start Family and Children Experiences Survey (FACES, 2003 Cohort); MHead Start Family and Children Experiences Survey (FACES, 2009 Cohort).
Fig 3
Fig 3. Systematic review of the associations between staff education (Has a BA) and child outcomes.
a Abbreviations: BA = Bachelor’s Degree. Symbols bolded are significant and positive, symbols bolded and italicized are significant and negative, and symbols in grey are non-significant. Star = Zero Order Pearson’s Correlation, Unfilled circle = Beta, Filled square = Unstandardized Coefficient, Downward arrow = Effect Size, Filled circle = F-Ratio. aTo improve the readability of this complex table, eleven papers [,,–57,61,63,67,70,71,82] that had an outcome that appeared in only that one paper were omitted from this table. Several analyses from other papers that had idiosyncratic outcomes are also excluded. For a comprehensive display of all of the data for all of the child outcomes see Tables A-H in S4 File. bThis paper is one of a series of Meta-Analyses and Systematic Reviews assessing the relationship between child care quality and children’s outcomes; therefore, superscript letters below are in reference to various large databases that samples in these papers were drawn from. These letters have been kept consistent across the series for our readers. cSamples within papers are described in more detail in Table 3 in the manuscript. dAcronyms for child outcomes are listed in S3 File and for journals, large samples and covariates are in S5 File. eIdentifying Letters (also refers to as Alphabet Recognition Test, Naming Letters, and Letter-Naming Test). ANational Center for Early Development and Learning Dataset (NCEDL, 2002, 2004); FGeorgia Early Childhood Study (GECS, 2002); HEarly Head Start (EHS, 2001–2003 Cohort); LHead Start Family and Children Experiences Survey (FACES, 2003 Cohort); MHead Start Family and Children Experiences Survey (FACES, 2009 Cohort); QNational Institute of Child Health and Human Development (NICHD, 1995–1996); UPreschool Curriculum Evaluation Research (PCER, 1999–2003);YAMore is Four North Carolina Study (2002–2003 Cohort); YBMore is Four North Carolina Study (2003–2004) Cohort; ZColorado QRIS.
Fig 4
Fig 4. Systematic review of the associations between staff education (Years of Education) and child outcomes.
a Abbreviations: BA = Bachelor’s Degree. Symbols bolded are significant and positive, symbols bolded and italicized are significant and negative, and symbols in grey are non-significant. Star = Zero Order Pearson’s Correlation, Unfilled circle = Beta, Filled square = Unstandardized Coefficient, Key clover = Partial Correlation, Downward arrow = Effect Size. aTo improve the readability of this complex table, eleven papers [,,–57,61,63,67,70,71,82] that had an outcome that appeared in only that one paper were omitted from this table. Several analyses from other papers that had idiosyncratic outcomes are also excluded. For a comprehensive display of all of the data for all of the child outcomes see Tables A-H in S4 File. bThis paper is one of a series of Meta-Analyses and Systematic Reviews assessing the relationship between child care quality and children’s outcomes; therefore, superscript letters below are in reference to various large databases that samples in these papers were drawn from. These letters have been kept consistent across the series for our readers. cSamples within papers are described in more detail in Table 3 in the manuscript. dAcronyms for child outcomes are listed in S3 File and for journals, large samples and covariates are in S5 File. eIdentifying Letters (also refers to as Alphabet Recognition Test, Naming Letters, and Letter-Naming Test). ANational Center for Early Development and Learning Dataset (NCEDL, 2002, 2004); DCost, Quality and Outcomes Study (CQO, 1993–1994); NEarly Childhood Longitudinal Study (ECLS-B, 2001–2006 Birth Cohort); S8-County Region of North-Central Indiana (Year NR).
Fig 5
Fig 5. Systematic review of the associations between staff education (Level of Education, Ordinal) and child outcomes.
a Abbreviations: BA = Bachelor’s Degree. Symbols bolded are significant and positive, symbols bolded and italicized are significant and negative, and symbols in grey are non-significant. Star = Zero Order Pearson’s Correlation, Unfilled circle = Beta, Filled square = Unstandardized Coefficient, Key clover = Partial Correlation, Downward arrow = Effect Size, Filled circle = F-Ratio. aTo improve the readability of this complex table, eleven papers[,,–57,61,63,67,70,71,82] that had an outcome that appeared in only that one paper were omitted from this table. Several analyses from other papers that had idiosyncratic outcomes are also excluded. For a comprehensive display of all of the data for all of the child outcomes see Tables A-H in S4 File. bThis paper is one of a series of Meta-Analyses and Systematic Reviews assessing the relationship between child care quality and children’s outcomes; therefore, superscript letters below are in reference to various large databases that samples in these papers were drawn from. These letters have been kept consistent across the series for our readers. cSamples within papers are described in more detail in Table 3 in the manuscript. dAcronyms for child outcomes are listed in S3 File and for journals, large samples and covariates are in S5 File. eIdentifying Letters (also refers to as Alphabet Recognition Test, Naming Letters, and Letter-Naming Test). ANational Center for Early Development and Learning Dataset (NCEDL, 2002, 2004); FGeorgia Early Childhood Study (GECS, 2002); HEarly Head Start (EHS, 2001–2003 Cohort); JHead Start Family and Children Experiences Survey (FACES, 1997 Cohort); LHead Start Family and Children Experiences Survey (FACES, 2003 Cohort); QNational Institute of Child Health and Human Development (NICHD, 1995–1996); S8-County Region of North-Central Indiana (Year NR); UPreschool Curriculum Evaluation Research (PCER, 1999–2003);YAMore is Four North Carolina Study (2002–2003 Cohort); YBMore is Four North Carolina Study (2003–2004) Cohort.
Fig 6
Fig 6. Meta-analysis results for the associations between staff education measured as a dichotomy, having a BA or not, and child outcomes.
Significant findings are noted with asterisks.
Fig 7
Fig 7. Meta-analysis results for the association between staff education measured as level of education (ordinal) and child outcomes.
Significant findings are noted with asterisks.

References

    1. Capizzano J, Main R. Many young children spend long hours in child care [Internet]. Washington, DC: U.S. Urban Institute; 2005. http://www.urban.org/sites/default/files/alfresco/publication-pdfs/31115...
    1. Sinha M. Childcare in Canada [Internet]. Ottawa, ON; 2014. http://www.statcan.gc.ca/pub/89-652-x/89-652-x2014005-eng.pdf.
    1. U.S. Department of Labor, Women’s Bureau. 20 Facts on Women Workers [Internet]. Washington DC; 2000. http://babel.hathitrust.org/cgi/pt?id=uiug.30112048171083
    1. NICHD ECCRN. Early child care and children’s development prior to school entry: results from the NICHD study of early child care. Am Educ Res J. 2002;39: 133–164. doi: 10.3102/00028312039001133 - DOI
    1. Laurin J, Geoffroy M, Boivin M, Japel C, Raynault M, Tremblay R, et al. Child care services, socioeconomic inequalities, and academic performance. Pediatrics. 2015;136 doi: 10.1542/peds.2015-0419 - DOI - PubMed