

Position Matters: Network Centrality Considerably Impacts Rates of Protein Evolution in the Human Protein-Protein Interaction Network
- PMID: 28854629
- PMCID: PMC5570066
- DOI: 10.1093/gbe/evx117
Position Matters: Network Centrality Considerably Impacts Rates of Protein Evolution in the Human Protein-Protein Interaction Network
Abstract
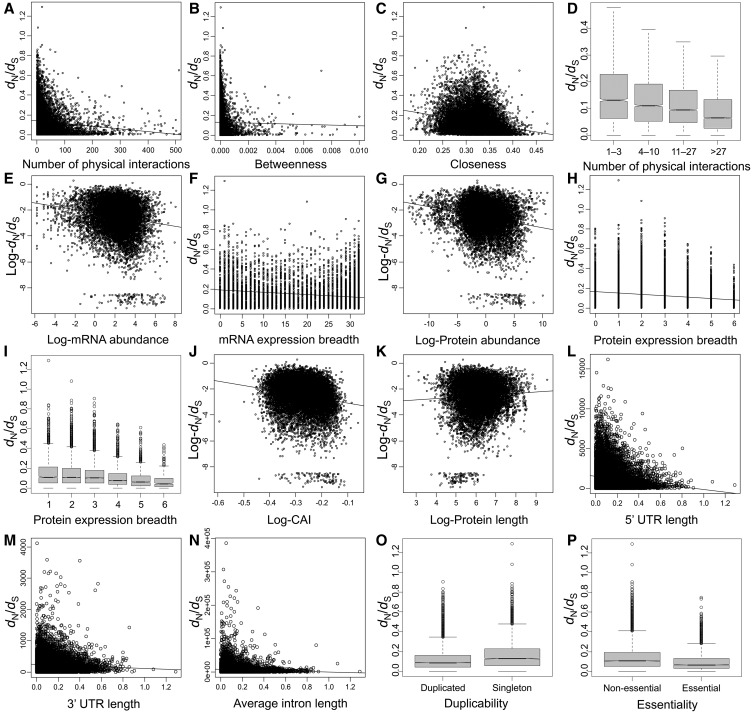
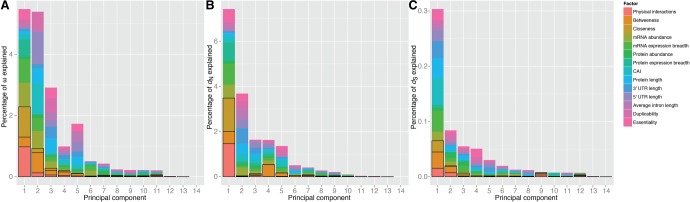
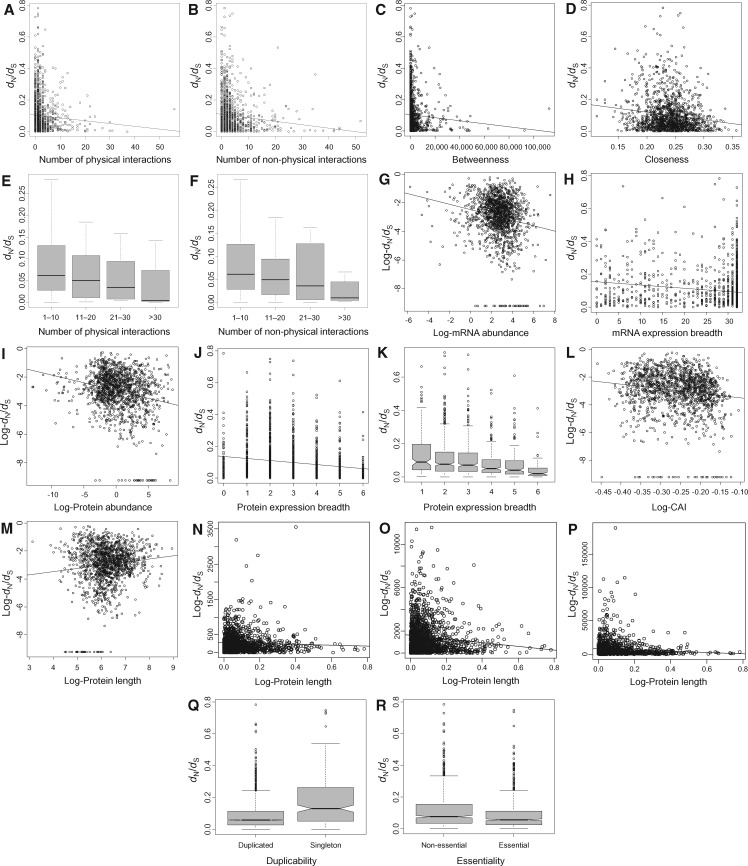
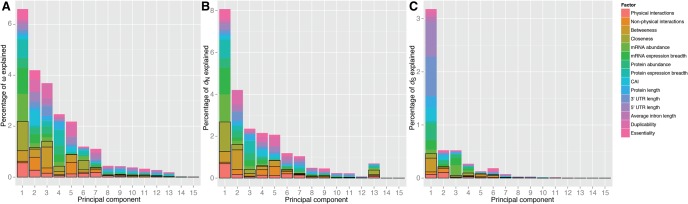
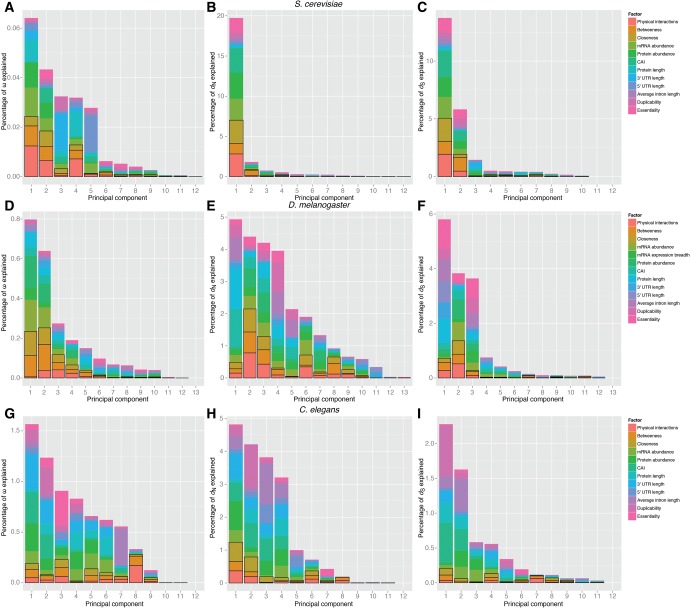
The proteins of any organism evolve at disparate rates. A long list of factors affecting rates of protein evolution have been identified. However, the relative importance of each factor in determining rates of protein evolution remains unresolved. The prevailing view is that evolutionary rates are dominantly determined by gene expression, and that other factors such as network centrality have only a marginal effect, if any. However, this view is largely based on analyses in yeasts, and accurately measuring the importance of the determinants of rates of protein evolution is complicated by the fact that the different factors are often correlated with each other, and by the relatively poor quality of available functional genomics data sets. Here, we use correlation, partial correlation and principal component regression analyses to measure the contributions of several factors to the variability of the rates of evolution of human proteins. For this purpose, we analyzed the entire human protein-protein interaction data set and the human signal transduction network-a network data set of exceptionally high quality, obtained by manual curation, which is expected to be virtually free from false positives. In contrast with the prevailing view, we observe that network centrality (measured as the number of physical and nonphysical interactions, betweenness, and closeness) has a considerable impact on rates of protein evolution. Surprisingly, the impact of centrality on rates of protein evolution seems to be comparable, or even superior according to some analyses, to that of gene expression. Our observations seem to be independent of potentially confounding factors and from the limitations (biases and errors) of interactomic data sets.
Keywords: dN/dS; network centrality; protein–protein interactions; rates of evolution.
© The Author 2017. Published by Oxford University Press on behalf of the Society for Molecular Biology and Evolution.
Figures
References
-
- Akashi H. 2001. Gene expression and molecular evolution. Curr Opin Genet Dev. 11:660–666. - PubMed
-
- Alvarez-Ponce D. 2017. Recording negative results of protein–protein interaction assays: an easy way to deal with the biases and errors of interactomic data sets. Brief Bioinform. pii: bbw075. - PubMed
-
- Alvarez-Ponce D. 2014. Why proteins evolve at different rates: the determinants of proteins’ rates of evolution In: Fares MA, editor. Natural selection: methods and applications. London: CRC Press (Taylor and Francis; ). p. 126–178.
MeSH terms
Substances
LinkOut - more resources
Full Text Sources
Other Literature Sources
