. 2017 Jun 1;9(6):1766-1780.
doi: 10.1093/gbe/evx124.

Contrasting Patterns of Nucleotide Substitution Rates Provide Insight into Dynamic Evolution of Plastid and Mitochondrial Genomes of Geranium

Affiliations

Contrasting Patterns of Nucleotide Substitution Rates Provide Insight into Dynamic Evolution of Plastid and Mitochondrial Genomes of Geranium

Seongjun Park et al. Genome Biol Evol. .

Abstract

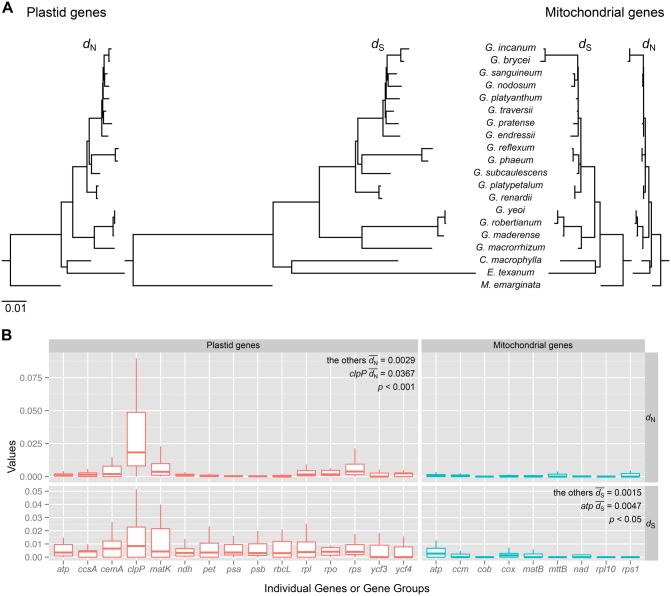
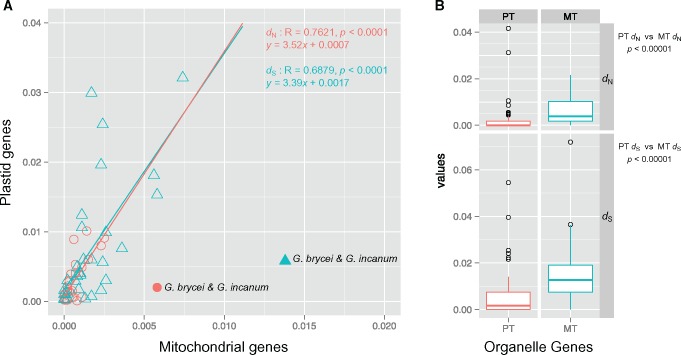
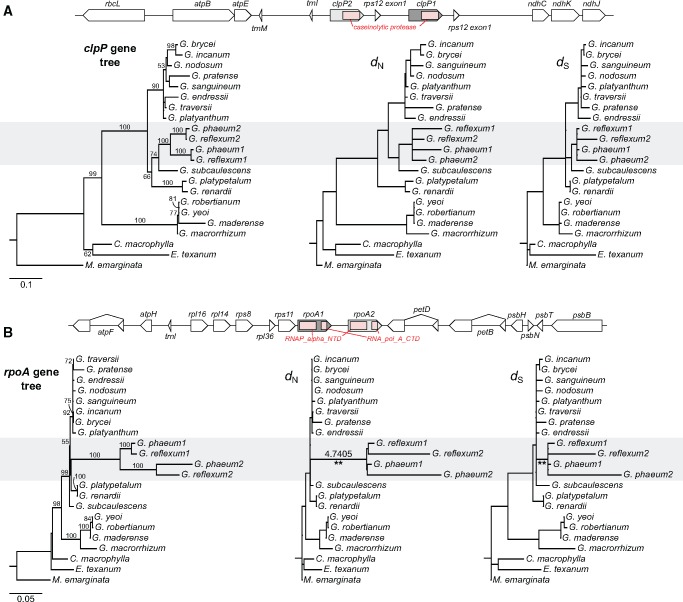
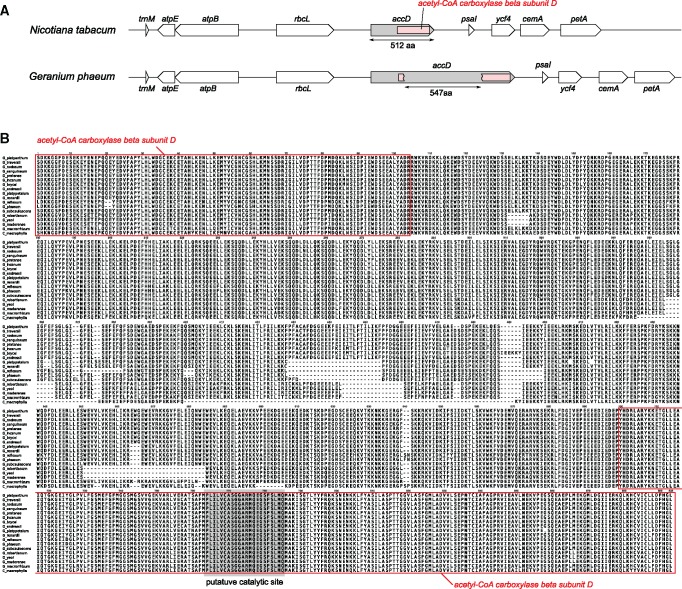
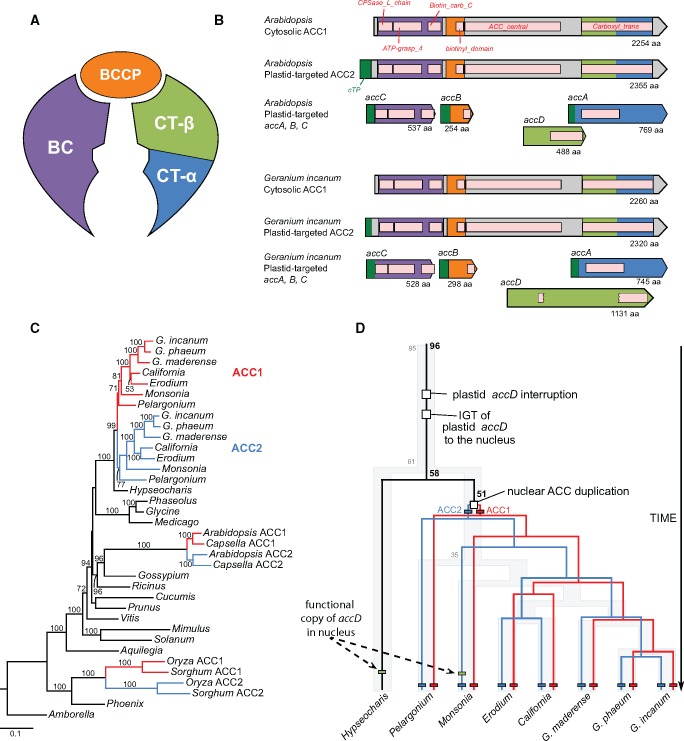
Geraniaceae have emerged as a model system for investigating the causes and consequences of variation in plastid and mitochondrial genomes. Incredible structural variation in plastid genomes (plastomes) and highly accelerated evolutionary rates have been reported in selected lineages and functional groups of genes in both plastomes and mitochondrial genomes (mitogenomes), and these phenomena have been implicated in cytonuclear incompatibility. Previous organelle genome studies have included limited sampling of Geranium, the largest genus in the family with over 400 species. This study reports on rates and patterns of nucleotide substitutions in plastomes and mitogenomes of 17 species of Geranium and representatives of other Geraniaceae. As detected across other angiosperms, substitution rates in the plastome are 3.5 times higher than the mitogenome in most Geranium. However, in the branch leading to Geranium brycei/Geranium incanum mitochondrial genes experienced significantly higher dN and dS than plastid genes, a pattern that has only been detected in one other angiosperm. Furthermore, rate accelerations differ in the two organelle genomes with plastomes having increased dN and mitogenomes with increased dS. In the Geranium phaeum/Geranium reflexum clade, duplicate copies of clpP and rpoA genes that experienced asymmetric rate divergence were detected in the single copy region of the plastome. In the case of rpoA, the branch leading to G. phaeum/G. reflexum experienced positive selection or relaxation of purifying selection. Finally, the evolution of acetyl-CoA carboxylase is unusual in Geraniaceae because it is only the second angiosperm family where both prokaryotic and eukaryotic ACCases functionally coexist in the plastid.

Keywords: accD; accelerated substitution rate; clpP; cytonuclear incompatibility; gene duplication; positive selection; rpoA.


Figures

<sc>Fig</sc>. 1.
Fig. 1.
—Organelle gene divergence among 17 species of Geranium. (A) Plastid and mitochondrial phylograms of nonsynonymous (dN) or synonymous (dS) substitution rates based on 72 plastid and 26 mitochondrial genes, respectively. All trees are drawn to the same scale and scale bar indicates the number of substitutions per site. C., California; E., Erodium; G., Geranium; M., Monsonia. (B) Box plots of the values of dN and dS for Geranium plastid (red) and mitochondrial (blue) individual genes or functional groups of genes (see supplementary table S2, Supplementary Material online). The box represents values between quartiles, solid lines extend to minimum and maximum values, horizontal lines in boxes show median values but outliers were eliminated (see supplementary fig. S4 for outlier information, Supplementary Material online). Significance of fit was evaluated by pairwise Wilcoxon rank sum tests in the R package.
<sc>Fig</sc>. 2.
Fig. 2.
—Plastid and mitochondrial sequence divergence among Geranium species. (A) Correlation of nonsynonymous (dN, red circles) and synonymous (dS, blue triangles) substitution rates between each shared branch in the phylogram shown in supplementary fig. S3A, Supplementary Material online. Linear regression analyses included all branches except for the branch leading to G. brycei and G. incanum (closed circle and triangle). (B) Boxplot distribution of the dN and dS values for all individual organelle genes from G. brycei and G. incanum. The box represents values between quartiles, solid lines extend to minimum and maximum values, outliers are shown as circles and horizontal lines in boxes show median values. Significance of fit was evaluated by Pearson’s correlation and pairwise Wilcoxon rank sum tests in the R package. PT, plastid; MT, mitochondrion.
<sc>Fig</sc>. 3.
Fig. 3.
—Duplication of plastid-encoded clpP and rpoA genes in G. phaeum and G. reflexum. (A) Schematic diagram of the genomic regions surrounding the plastid clpP homologs from G. phaeum and G. reflexum. Pink box indicates conserved domain (caseinolytic protease). Maximum likelihood (ML) gene tree (left) based on clpP nucleotide sequences. ML phylograms used the constraint tree in supplementary fig. S3B, Supplementary Material online to show nonsynonymous (dN) or synonymous (dS) substitution rates of clpP (middle, right, respectively). (B) Schematic diagram of the genomic regions surrounding the rpoA homologs from G. phaeum and G. reflexum plastomes. Pink box indicates two conserved domains (RNA_alpha_NTD and RNA_pol_A_CTD). ML gene tree (left) based on rpoA nucleotide sequences. ML phylograms used the constraint tree in supplementary fig. S3B, Supplementary Material online to show dN and dS of rpoA (middle, right, respectively). Branches with significantly higher dN/dS (4.7405) detected by likelihood ratio test (LRT) are marked with two asterisks (P < 0.001 after Bonferroni correction; supplementary table S9, Supplementary Material online). Clade A2 within Geranium (supplementary fig. S3A, Supplementary Material online) that has duplication events is highlighted in gray. The numbers “1” and “2” after each species in the phylograms represent paralogs for clpP and rpoA. Bootstrap support values >50% are shown on the branches.
<sc>Fig</sc>. 4.
Fig. 4.
—Characterization of the plastid-encoded acetyl-CoA carboxylase beta subunit (accD) genes of Geranium. (A) Schematic diagram of the genomic region surrounding accD in the G. phaeum plastome compared with Nicotiana tabacum. Boxes inside accD gene (gray) indicate the conserved domain (acetyl-CoA carboxylase beta subunit; pink). (B) Amino acid sequence alignment of plastid-encoded acetyl-CoA carboxylase beta subunit conserved domain including the insertion regions from 17 Geranium species and California macrophylla. Red boxes indicate the conserved domain of acetyl-CoA carboxylase beta subunit and shaded gray box indicates well-known putative catalytic site (Lee et al. 2004).
<sc>Fig</sc>. 5.
Fig. 5.
—Evolutionary implications of acetyl-CoA carboxylase variation in Geraniaceae. (A) Schematic diagram of Acetyl-coenzyme A carboxylase (ACCase) composed of four subunits. BC = Biotin carboxylase (purple), BCCP = Biotin carboxyl carrier protein (orange), CT = Carboxyl transferase (alpha: blue, beta: green). (B) Architecture of ACCase from Geranium incanum compared with Arabidopsis thaliana. Colors indicate subunits of ACCase corresponding to the schematic diagram in (A). Pink boxes indicate the conserved domains of ACCase. Dark green boxes in N-terminus indicate a transit peptide. (C) Maximum likelihood (ML) gene tree based on nuclear-encoded ACC homologs among angiosperms. The numbers “1” and “2” after each species in the phylogram represents paralogs for ACC (red and blue). Bootstrap support values >50% are shown on the branches. (D) Summary of gene duplication and intracellular gene transfer (IGT) events with divergence times. See supplementary fig. S19, Supplementary Material online for more detailed divergence time estimates for Geraniaceae. The evolutionary events are marked with squares and are shown in colored boxes. Numbers at nodes indicate divergence time estimates in Ma. Background tree with numbers (gray) adapted from Park et al. (2015a). Color branches correspond to each ortholog (red, ACC1; blue, ACC2).

Similar articles

Cited by

References

    1. Adams KL, Palmer JD.. 2003. Evolution of mitochondrial gene content: gene loss and transfer to the nucleus. Mol Phylogen Evol. 29:380–395. - PubMed
    1. Aedo C, Garmenia FM, Pando F.. 1998. World checklist of Geranium L. (Geraniaceae). Anal Jard Bot Madrid. 56:211–252.
    1. Babiychuk E, et al.2011. Plastid gene expression and plant development require a plastidic protein of the mitochondrial transcription termination factor family. Proc Natl Acad Sci U S A. 108:6674–6679. - PMC - PubMed
    1. Bakker FT, Breman F, Merckx V.. 2006. DNA sequence evolution in fast evolving mitochondrial DNA nad1 exons in Geraniaceae and Plantaginaceae. Taxon 55:887–896.
    1. Barnard-Kubow KB, Sloan DB, Galloway LF.. 2014. Correlation between sequence divergence and polymorphism reveals similar evolutionary mechanisms acting across multiple timescales in a rapidly evolving plastid genome. BMC Evol Biol. 14:268. - PMC - PubMed

Publication types