

Variation in DNA Methylation Is Not Consistently Reflected by Sociality in Hymenoptera
- PMID: 28854636
- PMCID: PMC5522706
- DOI: 10.1093/gbe/evx128
Variation in DNA Methylation Is Not Consistently Reflected by Sociality in Hymenoptera
Abstract
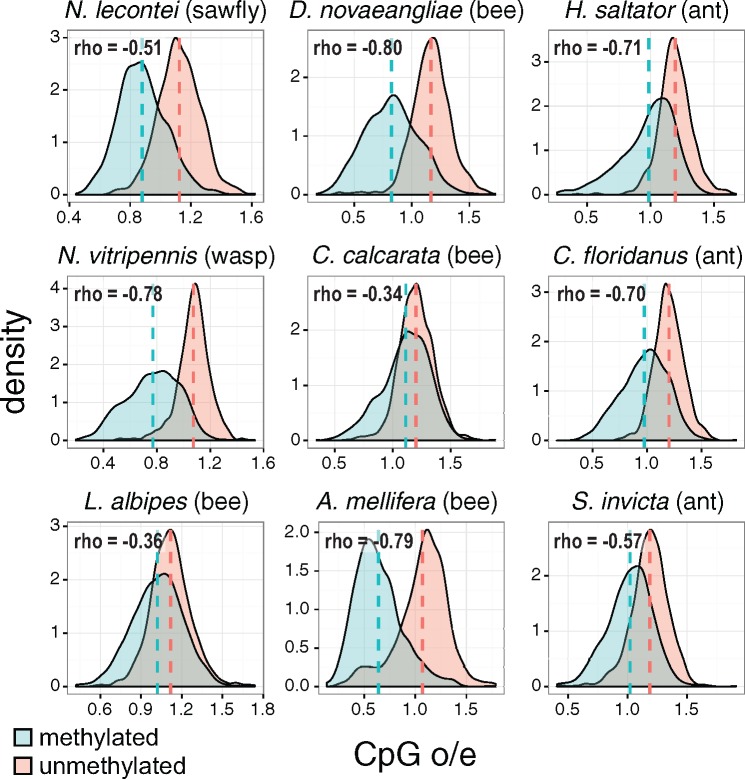
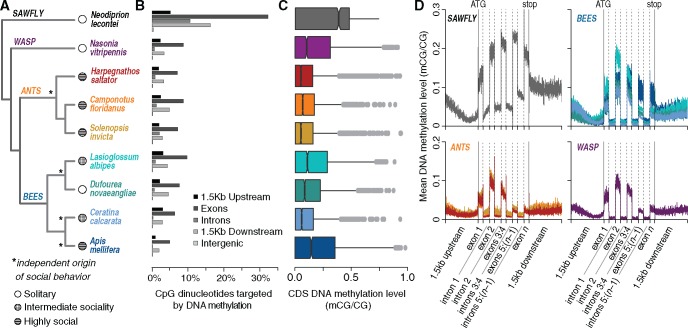
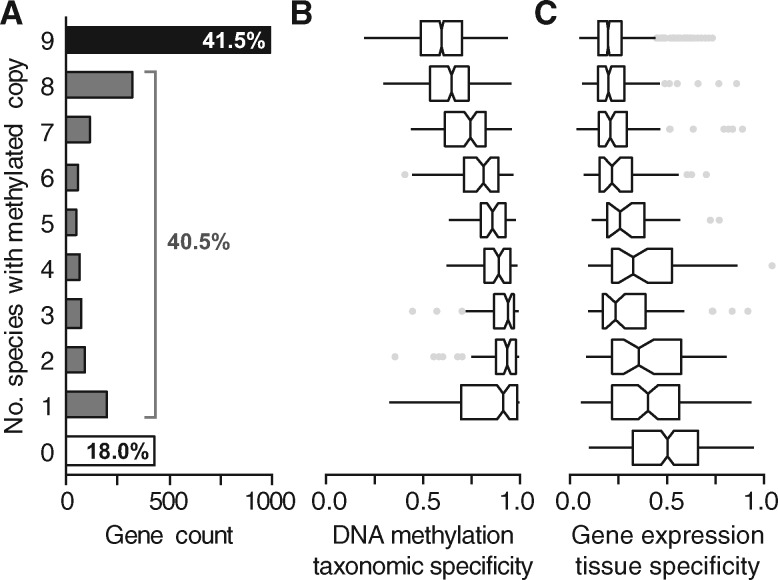
Changes in gene regulation that underlie phenotypic evolution can be encoded directly in the DNA sequence or mediated by chromatin modifications such as DNA methylation. It has been hypothesized that the evolution of eusocial division of labor is associated with enhanced gene regulatory potential, which may include expansions in DNA methylation in the genomes of Hymenoptera (bees, ants, wasps, and sawflies). Recently, this hypothesis garnered support from analyses of a commonly used metric to estimate DNA methylation in silico, CpG content. Here, we test this hypothesis using direct, nucleotide-level measures of DNA methylation across nine species of Hymenoptera. In doing so, we generated new DNA methylomes for three species of interest, including one solitary and one facultatively eusocial halictid bee and a sawfly. We demonstrate that the strength of correlation between CpG content and DNA methylation varies widely among hymenopteran taxa, highlighting shortcomings in the utility of CpG content as a proxy for DNA methylation in comparative studies of taxa with sparse DNA methylomes. We observed strikingly high levels of DNA methylation in the sawfly relative to other investigated hymenopterans. Analyses of molecular evolution suggest the relatively distinct sawfly DNA methylome may be associated with positive selection on functional DNMT3 domains. Sawflies are an outgroup to all ants, bees, and wasps, and no sawfly species are eusocial. We find no evidence that either global expansions or variation within individual ortholog groups in DNA methylation are consistently associated with the evolution of social behavior.
Keywords: CpG o/e; Neodiprion lecontei; epigenetics; eusociality; social insects; whole genome bisulfite sequencing.
© The Author 2017. Published by Oxford University Press on behalf of the Society for Molecular Biology and Evolution.
Figures
References
-
- Alvarado S, Rajakumar R, Abouheif E, Szyf M.. 2015. Epigenetic variation in the Egfr gene generates quantitative variation in a complex trait in ants. Nat Commun. 6:6513. - PubMed
-
- Baubec T, et al.2015. Genomic profiling of DNA methyltransferases reveals a role for DNMT3B in genic methylation. Nature 520:243–247. - PubMed
-
- Bell O, Tiwari VK, Thomä NH, Schubeler D.. 2011. Determinants and dynamics of genome accessibility. Nat Rev Genet. 12:554–564. - PubMed
-
- Benjamini Y, Hochberg Y.. 1995. Controlling the false discovery rate: a practical and powerful approach to multiple testing. J Roy Stat Soc B 57:289–300.
Publication types
MeSH terms
LinkOut - more resources
Full Text Sources
Other Literature Sources
Molecular Biology Databases
