

Comparison of spinocerebellar ataxia type 3 mouse models identifies early gain-of-function, cell-autonomous transcriptional changes in oligodendrocytes
- PMID: 28854700
- PMCID: PMC5886175
- DOI: 10.1093/hmg/ddx224
Comparison of spinocerebellar ataxia type 3 mouse models identifies early gain-of-function, cell-autonomous transcriptional changes in oligodendrocytes
Abstract
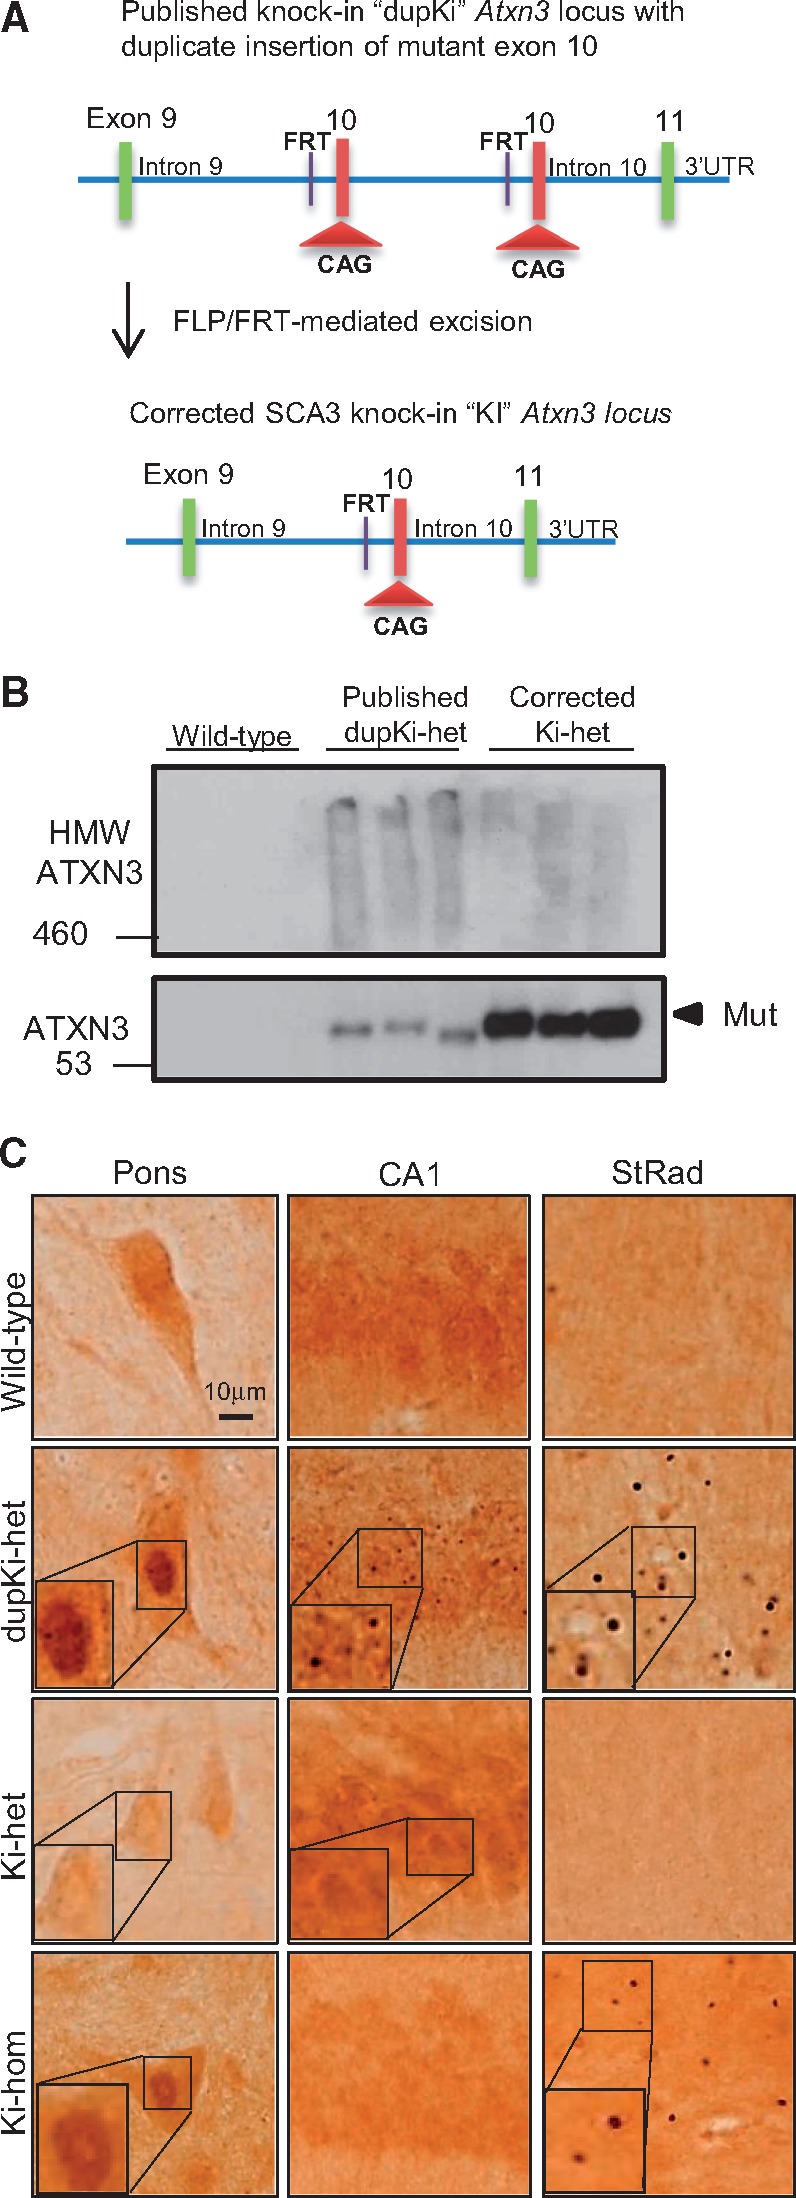
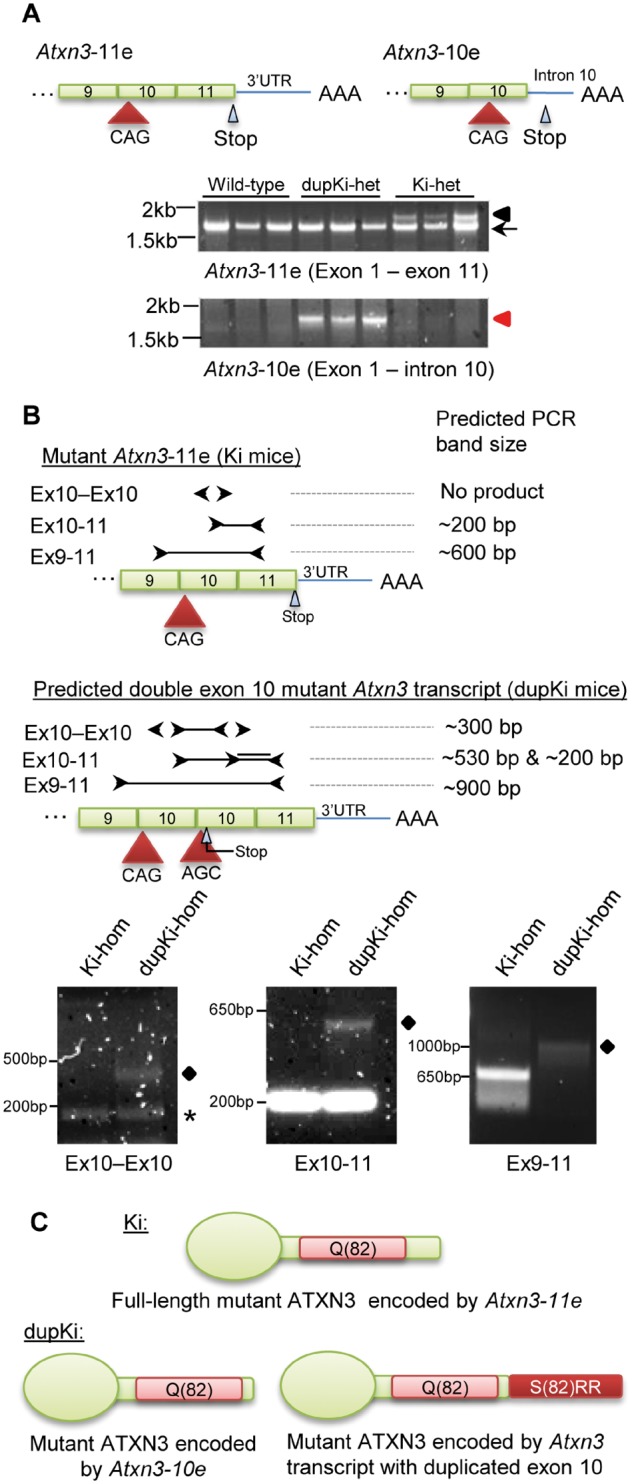
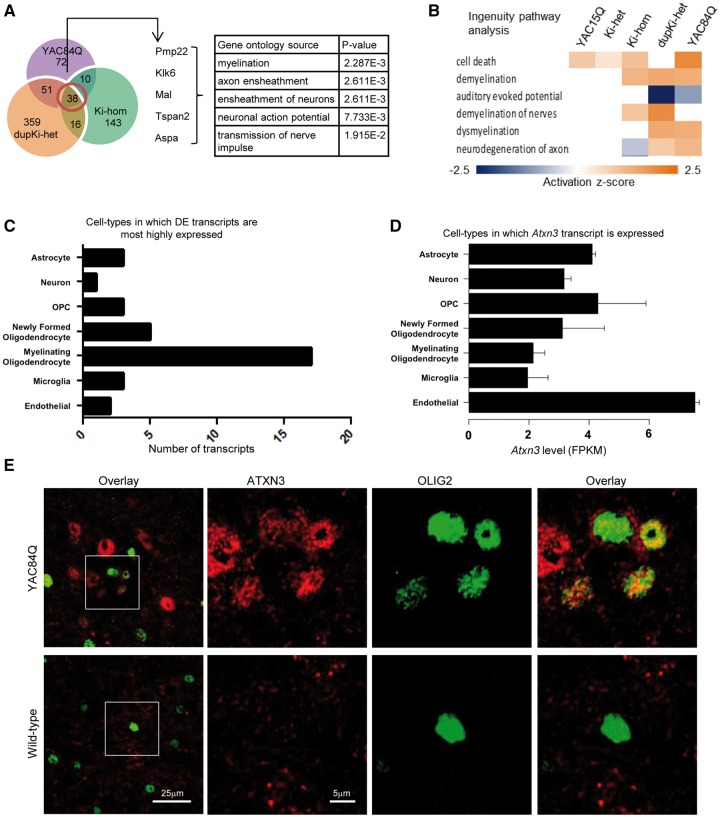
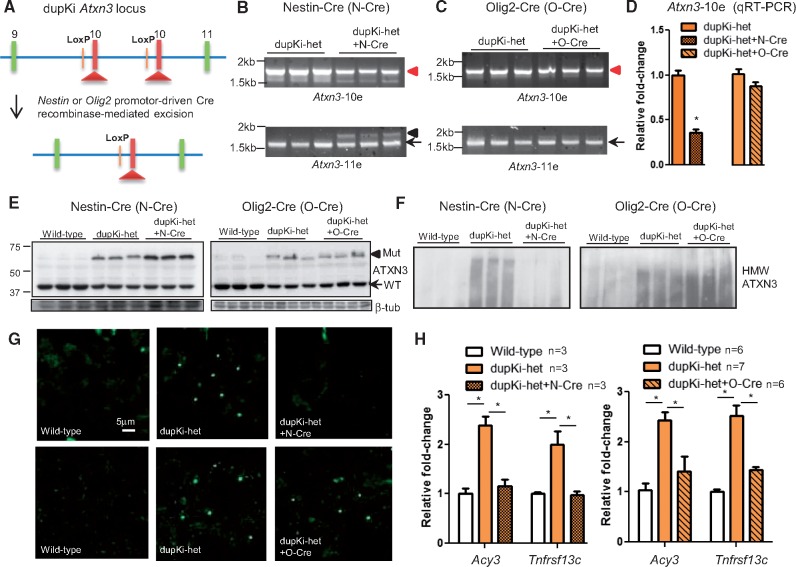
Spinocerebellar ataxia type 3 (SCA3) is a neurodegenerative disorder caused by a polyglutamine-encoding CAG repeat expansion in the ATXN3 gene. This expansion leads to misfolding and aggregation of mutant ataxin-3 (ATXN3) and degeneration of select brain regions. A key unanswered question in SCA3 and other polyglutamine diseases is the extent to which neurodegeneration is mediated through gain-of-function versus loss-of-function. To address this question in SCA3, we performed transcriptional profiling on the brainstem, a highly vulnerable brain region in SCA3, in a series of mouse models with varying degrees of ATXN3 expression and aggregation. We include two SCA3 knock-in mouse models: our previously published model that erroneously harbors a tandem duplicate of the CAG repeat-containing exon, and a corrected model, introduced here. Both models exhibit dose-dependent neuronal accumulation and aggregation of mutant ATXN3, but do not exhibit a behavioral phenotype. We identified a molecular signature that correlates with ATXN3 neuronal aggregation yet is primarily linked to oligodendrocytes, highlighting early white matter dysfunction in SCA3. Two robustly elevated oligodendrocyte transcripts, Acy3 and Tnfrsf13c, were confirmed as elevated at the protein level in SCA3 human disease brainstem. To determine if mutant ATXN3 acts on oligodendrocytes cell-autonomously, we manipulated the repeat expansion in the variant SCA3 knock-in mouse by cell-type specific Cre/LoxP recombination. Changes in oligodendrocyte transcripts are driven cell-autonomously and occur independent of neuronal ATXN3 aggregation. Our findings support a primary toxic gain of function mechanism and highlight a previously unrecognized role for oligodendrocyte dysfunction in SCA3 disease pathogenesis.
© The Author 2017. Published by Oxford University Press. All rights reserved. For Permissions, please email: journals.permissions@oup.com.
Figures

Similar articles
-
Druggable genome screen identifies new regulators of the abundance and toxicity of ATXN3, the Spinocerebellar Ataxia type 3 disease protein.Neurobiol Dis. 2020 Apr;137:104697. doi: 10.1016/j.nbd.2019.104697. Epub 2019 Nov 26. Neurobiol Dis. 2020. PMID: 31783119 Free PMC article.
-
Impaired Oligodendrocyte Maturation Is an Early Feature in SCA3 Disease Pathogenesis.J Neurosci. 2022 Feb 23;42(8):1604-1617. doi: 10.1523/JNEUROSCI.1954-20.2021. Epub 2022 Jan 18. J Neurosci. 2022. PMID: 35042771 Free PMC article.
-
A new humanized ataxin-3 knock-in mouse model combines the genetic features, pathogenesis of neurons and glia and late disease onset of SCA3/MJD.Neurobiol Dis. 2015 Jan;73:174-88. doi: 10.1016/j.nbd.2014.09.020. Epub 2014 Oct 7. Neurobiol Dis. 2015. PMID: 25301414
-
From Pathogenesis to Novel Therapeutics for Spinocerebellar Ataxia Type 3: Evading Potholes on the Way to Translation.Neurotherapeutics. 2019 Oct;16(4):1009-1031. doi: 10.1007/s13311-019-00798-1. Neurotherapeutics. 2019. PMID: 31691128 Free PMC article. Review.
-
ATXN3: a multifunctional protein involved in the polyglutamine disease spinocerebellar ataxia type 3.Expert Rev Mol Med. 2024 Sep 25;26:e19. doi: 10.1017/erm.2024.10. Expert Rev Mol Med. 2024. PMID: 39320846 Free PMC article. Review.
Cited by
-
Druggable genome screen identifies new regulators of the abundance and toxicity of ATXN3, the Spinocerebellar Ataxia type 3 disease protein.Neurobiol Dis. 2020 Apr;137:104697. doi: 10.1016/j.nbd.2019.104697. Epub 2019 Nov 26. Neurobiol Dis. 2020. PMID: 31783119 Free PMC article.
-
Consensus Paper: Strengths and Weaknesses of Animal Models of Spinocerebellar Ataxias and Their Clinical Implications.Cerebellum. 2022 Jun;21(3):452-481. doi: 10.1007/s12311-021-01311-1. Epub 2021 Aug 10. Cerebellum. 2022. PMID: 34378174 Free PMC article.
-
Glutamatergic Synapse Dysfunction in Drosophila Neuromuscular Junctions Can Be Rescued by Proteostasis Modulation.Front Mol Neurosci. 2022 Jul 15;15:842772. doi: 10.3389/fnmol.2022.842772. eCollection 2022. Front Mol Neurosci. 2022. PMID: 35909443 Free PMC article.
-
Pathogenetic Mechanisms Underlying Spinocerebellar Ataxia Type 3 Are Altered in Primary Oligodendrocyte Culture.Cells. 2022 Aug 22;11(16):2615. doi: 10.3390/cells11162615. Cells. 2022. PMID: 36010688 Free PMC article.
-
Molecular chaperones in the brain endothelial barrier: neurotoxicity or neuroprotection?FASEB J. 2019 Nov;33(11):11629-11639. doi: 10.1096/fj.201900895R. Epub 2019 Jul 26. FASEB J. 2019. PMID: 31348679 Free PMC article. Review.
References
-
- Rüb U., Schöls L., Paulson H., Auburger G., Kermer P., Jen J.C., Seidel K., Korf H.-W., Deller T. (2013) Clinical features, neurogenetics and neuropathology of the polyglutamine spinocerebellar ataxias type 1, 2, 3, 6 and 7. Prog. Neurobiol., 104, 38–66. - PubMed
-
- Arrasate M., Mitra S., Schweitzer E.S., Segal M.R., Finkbeiner S. (2004) Inclusion body formation reduces levels of mutant huntingtin and the risk of neuronal death. Nature, 431, 805–810. - PubMed
-
- Saudou F., Finkbeiner S., Devys D., Greenberg M.E. (1998) Huntingtin acts in the nucleus to induce apoptosis but death does not correlate with the formation of intranuclear inclusions. Cell, 95, 55–66. - PubMed
-
- Kurosawa M., Matsumoto G., Kino Y., Okuno M., Kurosawa-Yamada M., Washizu C., Taniguchi H., Nakaso K., Yanagawa T., Warabi E.. et al. (2014) Depletion of p62 reduces nuclear inclusions and paradoxically ameliorates disease phenotypes in Huntington’s model mice. Hum. Mol. Genet., 24, 1092–1105. - PubMed
Publication types
MeSH terms
Substances
Grants and funding
LinkOut - more resources
Full Text Sources
Other Literature Sources
Molecular Biology Databases
