Combined androgen excess and Western-style diet accelerates adipose tissue dysfunction in young adult, female nonhuman primates
- PMID: 28854720
- PMCID: PMC6074799
- DOI: 10.1093/humrep/dex244
Combined androgen excess and Western-style diet accelerates adipose tissue dysfunction in young adult, female nonhuman primates
Abstract
Study question: What are the separate and combined effects of mild hyperandrogenemia and consumption of a high-fat Western-style diet (WSD) on white adipose tissue (WAT) morphology and function in young adult female nonhuman primates?
Summary answer: Combined exposure to mild hyperandrogenemia and WSD induces visceral omental (OM-WAT) but not subcutaneous (SC-WAT) adipocyte hypertrophy that is associated with increased uptake and reduced mobilization of free fatty acids.
What is known already: Mild hyperandrogenemia in females, principally in the context of polycystic ovary syndrome, is often associated with adipocyte hypertrophy, but the mechanisms of associated WAT dysfunction and depot specificity remain poorly understood.
Study design, size and duration: Female rhesus macaques were randomly assigned at 2.5 years of age (near menarche) to receive either cholesterol (C; n = 20) or testosterone (T; n = 20)-containing silastic implants to elevate T levels 5-fold above baseline. Half of each of these groups was then fed either a low-fat monkey chow diet or WSD, resulting in four treatment groups (C, control diet; T alone; WSD alone; T + WSD; n = 10/group) that were maintained until the current analyses were performed at 5.5 years of age (3 years of treatment, young adults).
Participants/materials, setting and methods: OM and SC-WAT biopsies were collected and analyzed longitudinally for in vivo changes in adipocyte area and blood vessel density, and ex vivo basal and insulin-stimulated fatty acid uptake and basal and isoproterenol-stimulated lipolysis.
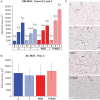
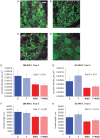
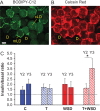
Main results and the role of chance: In years 2 and 3 of treatment, the T + WSD group exhibited a significantly greater increase in OM adipocyte size compared to all other groups (P < 0.05), while the size of SC adipocytes measured at the end of the study was not significantly different between groups. In year 3, both WAT depots from the WSD and T + WSD groups displayed a significant reduction in local capillary length and vessel junction density (P < 0.05). In year 3, insulin-stimulated fatty acid uptake in OM-WAT was increased in the T + WSD group compared to year 2 (P < 0.05). In year 3, basal lipolysis was blunted in the T and T + WSD groups in both WAT depots (P < 0.01), while isoproterenol-stimulated lipolysis was significantly blunted in the T and T + WSD groups only in SC-WAT (P < 0.01).
Limitations, reasons for caution: At this stage of the study, subjects were still relatively young adults, so that the effects of mild hyperandrogenemia and WSD may become more apparent with increasing age.
Wider implications of the findings: The combination of mild hyperandrogenemia and WSD accelerates the development of WAT dysfunction through T-specific (suppression of lipolytic response by T), WSD-dependent (reduced capillary density) and combined T + WSD (increased fatty acid uptake) mechanisms. These data support the idea that combined hyperandrogenemia and WSD increases the risk of developing obesity in females.
Study funding/competing interest(s): Research reported in this publication was supported by the Eunice Kennedy Shriver National Institute of Child Health and Human Development of the National Institutes of Health under award number P50 HD071836 to C.T.R. and award number OD 011092 from the Office of the Director, National Institutes of Health, for operation of the Oregon National Primate Research Center. The content is solely the responsibility of the authors and does not necessarily represent the official views of the National Institutes of Health.
Keywords: PCOS; Western-style diet; adipose tissue; androgen; fatty acid; hyperandrogenemia; lipolysis; nonhuman primates; obesity; testosterone.
© The Author 2017. Published by Oxford University Press on behalf of the European Society of Human Reproduction and Embryology. All rights reserved. For Permissions, please e-mail: journals.permissions@oup.com
Figures


Similar articles
-
Chronic hyperandrogenemia in the presence and absence of a western-style diet impairs ovarian and uterine structure/function in young adult rhesus monkeys.Hum Reprod. 2018 Jan 1;33(1):128-139. doi: 10.1093/humrep/dex338. Hum Reprod. 2018. PMID: 29190387 Free PMC article.
-
Chronic combined hyperandrogenemia and western-style diet in young female rhesus macaques causes greater metabolic impairments compared to either treatment alone.Hum Reprod. 2017 Sep 1;32(9):1880-1891. doi: 10.1093/humrep/dex246. Hum Reprod. 2017. PMID: 28854721 Free PMC article.
-
Chronic hyperandrogenemia and western-style diet beginning at puberty reduces fertility and increases metabolic dysfunction during pregnancy in young adult, female macaques.Hum Reprod. 2018 Apr 1;33(4):694-705. doi: 10.1093/humrep/dey013. Hum Reprod. 2018. PMID: 29401269 Free PMC article.
-
The regulation of adipose tissue distribution in humans.Int J Obes Relat Metab Disord. 1996 Apr;20(4):291-302. Int J Obes Relat Metab Disord. 1996. PMID: 8680455 Review.
-
Understanding androgen action in adipose tissue.J Steroid Biochem Mol Biol. 2014 Sep;143:277-84. doi: 10.1016/j.jsbmb.2014.04.008. Epub 2014 Apr 28. J Steroid Biochem Mol Biol. 2014. PMID: 24787657 Review.
Cited by
-
Utilizing Contrast-Enhanced Ultrasonography with Phosphatidylserine Microbubbles to Detect Placental Inflammation in Rhesus Macaques.Molecules. 2023 Mar 23;28(7):2894. doi: 10.3390/molecules28072894. Molecules. 2023. PMID: 37049657 Free PMC article.
-
Mitochondria in Sex Hormone-Induced Disorder of Energy Metabolism in Males and Females.Front Endocrinol (Lausanne). 2021 Dec 20;12:749451. doi: 10.3389/fendo.2021.749451. eCollection 2021. Front Endocrinol (Lausanne). 2021. PMID: 34987473 Free PMC article. Review.
-
Western-style diet in the presence of elevated circulating testosterone induces adipocyte hypertrophy without proinflammatory responses in rhesus macaques.Am J Reprod Immunol. 2023 Oct;90(4):e13773. doi: 10.1111/aji.13773. Am J Reprod Immunol. 2023. PMID: 37766405 Free PMC article.
-
Maternal diet alters long-term innate immune cell memory in fetal and juvenile hematopoietic stem and progenitor cells in nonhuman primate offspring.Cell Rep. 2023 Apr 25;42(4):112393. doi: 10.1016/j.celrep.2023.112393. Epub 2023 Apr 13. Cell Rep. 2023. PMID: 37058409 Free PMC article.
-
Menstrual dysfunction in polycystic ovary syndrome: association with dynamic state insulin resistance rather than hyperandrogenism.Fertil Steril. 2021 Jun;115(6):1557-1568. doi: 10.1016/j.fertnstert.2020.12.015. Epub 2021 Feb 15. Fertil Steril. 2021. PMID: 33602559 Free PMC article.
References
-
- Azziz R, Carmina E, Dewailly D, Diamanti-Kandarakis E, Escobar-Morreale HF, Futterweit W, Janssen OE, Legro RS, Norman RJ, Taylor AE et al. . The Androgen Excess and PCOS Society criteria for the polycystic ovary syndrome: the complete task force report. Fertil Steril 2009;91:456–488. - PubMed
-
- Barber TM, Franks S. Adipocyte biology in polycystic ovary syndrome. Mol Cell Endocrinol 2013;373:68–76. - PubMed
-
- Caldwell AS, Middleton LJ, Jimenez M, Desai R, McMahon AC, Allan CM, Handelsman DJ, Walters KA. Characterization of reproductive, metabolic, and endocrine features of polycystic ovary syndrome in female hyperandrogenic mouse models. Endocrinology 2014;155:3146–3159. - PubMed
Publication types
MeSH terms
Substances
Grants and funding
LinkOut - more resources
Full Text Sources
Other Literature Sources
Research Materials

