. 2017 Aug 21;45(14):8448-8462.
doi: 10.1093/nar/gkx582.

ATP hydrolysis provides functions that promote rejection of pairings between different copies of long repeated sequences

Affiliations

ATP hydrolysis provides functions that promote rejection of pairings between different copies of long repeated sequences

Claudia Danilowicz et al. Nucleic Acids Res. .

Abstract

During DNA recombination and repair, RecA family proteins must promote rapid joining of homologous DNA. Repeated sequences with >100 base pair lengths occupy more than 1% of bacterial genomes; however, commitment to strand exchange was believed to occur after testing ∼20-30 bp. If that were true, pairings between different copies of long repeated sequences would usually become irreversible. Our experiments reveal that in the presence of ATP hydrolysis even 75 bp sequence-matched strand exchange products remain quite reversible. Experiments also indicate that when ATP hydrolysis is present, flanking heterologous dsDNA regions increase the reversibility of sequence matched strand exchange products with lengths up to ∼75 bp. Results of molecular dynamics simulations provide insight into how ATP hydrolysis destabilizes strand exchange products. These results inspired a model that shows how pairings between long repeated sequences could be efficiently rejected even though most homologous pairings form irreversible products.


Figures

Figure 1.
Figure 1.
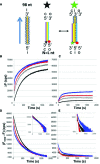
Progression of strand exchange for different N = L dsDNAs. (A) Schematic representation of experiments that measure the fluorescence change due to the separation between the fluorescein (star) labeled complementary strand (purple line) and rhodamine (red circle) labeled outgoing strand (blue line). Base-pairing is indicated in yellow. The initiating strand and the RecA monomers are illustrated by the orange line and grey ovals, respectively. The big black and green stars represent quenched and unquenched fluorescence. (B) ΔF versus time curves for 98 nt filaments and dsDNAs of increasing length in ATPγS showing the change in cps from the initial value measured for a solution containing each dsDNA in the absence of ssDNA-RecA filaments; N = 15 (black), 20 (gray), 50 (red) and 75 (blue) bp. (C) Same as (B) but in the presence of ATP. The y-axis label for Figure 1B also applies to Figure 1C. (D) Each value of the change in fluorescence in ATPγS was subtracted to the final value averaged over the last 10 s; the inset is the same data on a logarithmic y-scale. (E) Same as (D) but in ATP. The y-axis label for Figure 1D also applies to Figure 1E.
Figure 2.
Figure 2.
Effect of heterologous tails on strand exchange. (A) Schematic representation of product formation along the entire matched region of the dsDNA with the heterologous tail. (B) ΔF versus time for 98 nt filaments and dsDNAs: N = 15 bp, M = 0 (black), N =15 + M = 5 (brown), N = 20 bp, M = 0 (gray), N = 20 + M = 30 (pink), N = 50 + M = 0 (red) and N = 50 + M = 25 (orange) in ATPγS. (C) Same as (B) but in the presence of ATP. (D) ΔF1800 versus N for 98 nt filaments in ATPγS (green), ATP (cyan) and dATP (magenta), and Exp[0.13*N](black dotted line). The solid and dashed lines correspond to the same N values, but the dashed lines include tails with M > 20 bp. (E) Same as (D) but the y-axis is in logarithmic scale. The dotted black line shows the in vivo results (17) scaled to match the ΔF1800 values for in vitro results when N = 75 bp. (F) Summary of the ratio of the ΔF1800 values with and without a tail as a function of N. The green, cyan and magenta points correspond to experiments with ATPγS, ATP and dATP as cofactors, respectively, where the square and triangular points represent results for 98 nt and 75 nt filaments, respectively.
Figure 3.
Figure 3.
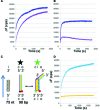
Effect of heterologous tails on strand exchange for shorter filaments or including nicks. (A) ΔF versus time curves for 75 nt filaments in ATPγS where blue and purple curves represent the results for L = 75 and L = 98 bp dsDNA, respectively. (B) Same as (A) but with dATP as the cofactor. (C) Schematic representation of experiments for 75 nt filaments and 98 bp dsDNA. The product is shown extending along the entire length of the filament, leaving a B-form tail at the end. (D) ΔF versus time curves for 98 nt filaments interacting with 98 bp dsDNA with N = 50 in dATP, where a nick separates the homologous region from the heterologous tail. The light blue curve shows the result in the presence of the nick, and the orange curve shows the result for nicked dsDNA which was ligated before the experiment.
Figure 4.
Figure 4.
Competition experiments measuring ΔF versus time in the presence or absence of unlabeled dsDNA for various dsDNA lengths. (A) Strand exchange experiments with 98 nt filaments incubated with 50 bp (i), 75 bp (ii) and 98 bp (iii) dsDNAs in ATPγS in the absence (gray) and presence (black) of 1× concentration of identical unlabeled dsDNA; filament : total dsDNA ratio = 1:2. (B) Same as (A) in ATP. (C) Strand exchange experiments with 98 nt filaments and 50 bp (i), 75 bp (ii) and 98 bp (iii) dsDNA in ATPγS in the absence (gray) and presence (black) of 6x concentration of identical unlabeled dsDNA; filament : total dsDNA ratio = 1:7. (D) Same as (C) in ATP. (E) Summary of the ratio of ΔF1800 values in the presence and absence of competition as a function of dsDNA length. The green, cyan and magenta points represent results for ATPγS, ATP and dATP as cofactors, respectively. The triangles and circles correspond to dsDNA samples with the fluorescein label on the complementary and outgoing strands relative to the ssDNA incoming strand, respectively. The squares represent results obtained with internal labels. The asterisk and the cross are nearly superimposed and represent labels on the complementary strand positioned 10 and 36 bp from the 5′ end. The empty square and the square with the plus sign correspond to internal labels on the outgoing strand positioned 10 and 36 bp from the 3′ end. (F) Same as (E) but for 6x concentration of unlabeled dsDNA competitor. (G) Interactions showing that when the heteroduplex cannot unbind from the filament it leads to intermediate three-strand exchange products that only allow for filament recycling if the heteroduplex dsDNA unbinds.
Figure 5.
Figure 5.
Progression of strand exchange for 98 nt –RecA filaments and 98 bp dsDNA. (A) Average of change in fluorescence for 10 curves in ATPγS (green), dATP (magenta) and ATP (cyan) and standard deviation values for ATPγS (orange), dATP (blue) and ATP (purple). (B) Bar graph for the curves shown in (A).
Figure 6.
Figure 6.
Results with experiments with fluorescent labels at various positions along the dsDNA. (A) Schematic representation of the 90 bp dsDNAs showing the position of the internal labels fluorescein (F) and rhodamine (Rho). (B) Normalized ΔF versus time curves for 98 nt ssDNA-RecA filament, 90 bp dsDNAs with internal labels at position d, and ATP; orange, green, blue, and purple lines correspond to labels d = 10, 20, 36 and 56, respectively. The inset shows the fit obtained with a simplified model (dashed lines); for details, see Supplementary Data. (C) Same as (B) for 75 nt ssDNA-RecA filament. (D) Total fluorescence for 98 nt ssDNA-RecA filament, 90 bp dsDNA containing internal labels at position d, and ATP; orange and blue lines correspond to labels d = 10 (average of five curves) and 36 (average of three curves). (E) Total fluorescence for 75 nt ssDNA-RecA filament, 90 bp dsDNA containing internal labels at position d, and ATP; orange and blue lines correspond to labels d = 10 (average of three curves) and 36 (average of three curves).
Figure 7.
Figure 7.
Structure for three dsDNA strands bound to a RecA filament with ATP bound at five consecutive protein interfaces and ADP occupying the remaining ATP binding site. (A) The cyan, purple and orange DNA strands correspond to the outgoing, complementary and initiating strands, respectively. The two black bases are the complementary strand bases that have returned to pair with the outgoing strand bases shown in dark blue. The black arrow points to the region where strand exchange has reversed. The two gray bases in the complementary strand and the two gray bases in the initiating strand are not paired. The ADP is indicated in red. (B) Schematic representation of the structure shown in (A).

Similar articles

Cited by

References

    1. Roca A.I., Cox M.M.. RecA protein: Structure, function, and role in recombinational DNA repair. Prog. Nucleic Acid Res. Mol. Biol. 1997; 56:129–223. - PubMed
    1. Kowalczykowski S.C. An overview of the molecular mechanisms of recombinational DNA repair. Cold Spring Harb. Perspect. Biol. 2015; 7:a016410. - PMC - PubMed
    1. Kowalczykowski S.C., Eggleston A.K.. Homologous pairing and DNA strand exchange. Annu. Rev. Biochem. 1994; 63:991–1043. - PubMed
    1. Roca A.I., Cox M.M.. The RecA protein: structure and function. Crit. Rev. Biochem. Mol. Biol. 1990; 25:415–456. - PubMed
    1. Taylor A.F., Amundsen S.K., Guttman M., Lee K.K., Luo J., Ranish J., Smith G.R.. Control of RecBCD enzyme activity by DNA binding- and chi hotspot-dependent conformational changes. J. Mol. Biol. 2014; 426:3479–3499. - PMC - PubMed

MeSH terms

LinkOut - more resources