

Magnetic Resonance Elastography to Assess Fibrosis in Kidney Allografts
- PMID: 28855238
- PMCID: PMC5628708
- DOI: 10.2215/CJN.01830217
Magnetic Resonance Elastography to Assess Fibrosis in Kidney Allografts
Abstract
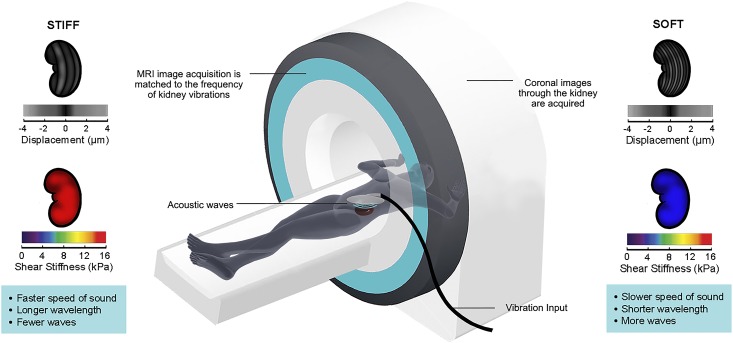
Background and objectives: Fibrosis is a major cause of kidney allograft injury. Currently, the only means of assessing allograft fibrosis is by biopsy, an invasive procedure that samples <1% of the kidney. We examined whether magnetic resonance elastography, an imaging-based measure of organ stiffness, could noninvasively estimate allograft fibrosis and predict progression of allograft dysfunction.
Design, setting, participants, & measurements: Kidney allograft recipients >1 year post-transplant undergoing an allograft biopsy first underwent free-breathing, flow-compensated magnetic resonance elastography on a 3.0-T magnetic resonance imaging scanner. Each patient had serial eGFR measurements after the elastography scan for a follow-up period of up to 1 year. The mean stiffness value of the kidney allograft was compared with both the histopathologic Banff fibrosis score and the rate of eGFR change during the follow-up period.
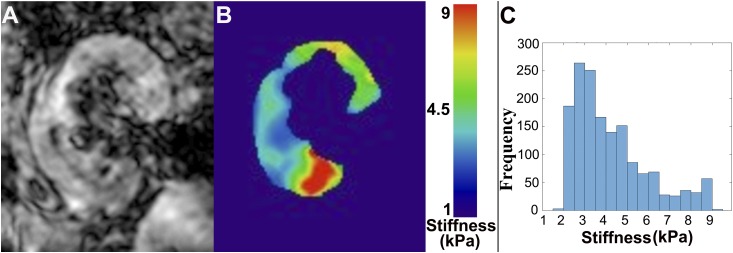
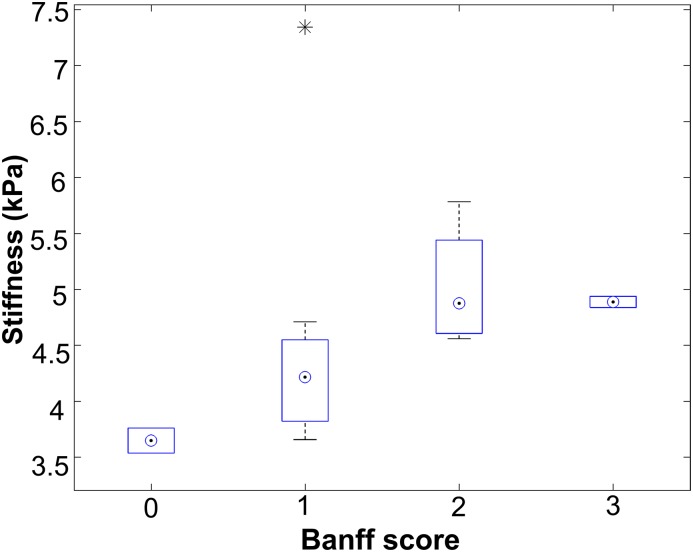
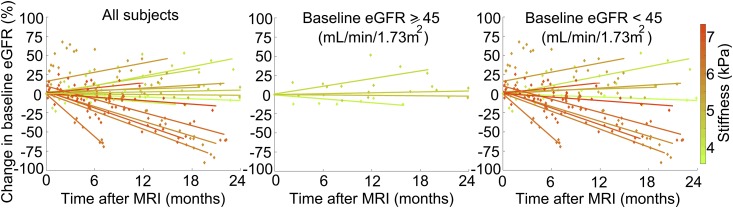
Results: Sixteen patients who underwent magnetic resonance elastography and biopsy were studied (mean age: 54±9 years old). Whole-kidney mean stiffness ranged between 3.5 and 7.3 kPa. Whole-kidney stiffness correlated with biopsy-derived Banff fibrosis score (Spearman rho =0.67; P<0.01). Stiffness was heterogeneously distributed within each kidney, providing a possible explanation for the lack of a stronger stiffness-fibrosis correlation. We also found negative correlations between whole-kidney stiffness and both baseline eGFR (Spearman rho =-0.65; P<0.01) and eGFR change over time (Spearman rho =-0.70; P<0.01). Irrespective of the baseline eGFR, increased kidney stiffness was associated with a greater eGFR decline (regression r2=0.48; P=0.03).
Conclusions: Given the limitations of allograft biopsy, our pilot study suggests the potential for magnetic resonance elastography as a novel noninvasive measure of whole-allograft fibrosis burden that may predict future changes in kidney function. Future studies exploring the utility and accuracy of magnetic resonance elastography are needed.
Copyright © 2017 by the American Society of Nephrology.
Figures
References
-
- Solez K, Colvin RB, Racusen LC, Sis B, Halloran PF, Birk PE, Campbell PM, Cascalho M, Collins AB, Demetris AJ, Drachenberg CB, Gibson IW, Grimm PC, Haas M, Lerut E, Liapis H, Mannon RB, Marcus PB, Mengel M, Mihatsch MJ, Nankivell BJ, Nickeleit V, Papadimitriou JC, Platt JL, Randhawa P, Roberts I, Salinas-Madriga L, Salomon DR, Seron D, Sheaff M, Weening JJ: Banff ’05 meeting report: Differential diagnosis of chronic allograft injury and elimination of chronic allograft nephropathy (‘CAN’). Am J Transplant 7: 518–526, 2007 - PubMed
-
- Naesens M, Kuypers DR, De Vusser K, Evenepoel P, Claes K, Bammens B, Meijers B, Sprangers B, Pirenne J, Monbaliu D, Jochmans I, Lerut E: The histology of kidney transplant failure: A long-term follow-up study. Transplantation 98: 427–435, 2014 - PubMed
-
- Muthupillai R, Lomas DJ, Rossman PJ, Greenleaf JF, Manduca A, Ehman RL: Magnetic resonance elastography by direct visualization of propagating acoustic strain waves. Science 269: 1854–1857, 1995 - PubMed
MeSH terms
LinkOut - more resources
Full Text Sources
Other Literature Sources
Medical
Research Materials
Miscellaneous
