. 2017 Oct 2;214(10):2915-2932.
doi: 10.1084/jem.20170521. Epub 2017 Aug 30.

Reduced generation of lung tissue-resident memory T cells during infancy

Affiliations

Reduced generation of lung tissue-resident memory T cells during infancy

Kyra D Zens et al. J Exp Med. .

Abstract

Infants suffer disproportionately from respiratory infections and generate reduced vaccine responses compared with adults, although the underlying mechanisms remain unclear. In adult mice, lung-localized, tissue-resident memory T cells (TRMs) mediate optimal protection to respiratory pathogens, and we hypothesized that reduced protection in infancy could be due to impaired establishment of lung TRM. Using an infant mouse model, we demonstrate generation of lung-homing, virus-specific T effectors after influenza infection or live-attenuated vaccination, similar to adults. However, infection during infancy generated markedly fewer lung TRMs, and heterosubtypic protection was reduced compared with adults. Impaired TRM establishment was infant-T cell intrinsic, and infant effectors displayed distinct transcriptional profiles enriched for T-bet-regulated genes. Notably, mouse and human infant T cells exhibited increased T-bet expression after activation, and reduction of T-bet levels in infant mice enhanced lung TRM establishment. Our findings reveal that infant T cells are intrinsically programmed for short-term responses, and targeting key regulators could promote long-term, tissue-targeted protection at this critical life stage.


Figures

Figure 1.
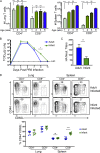
Figure 1.
Primary response to influenza infection in infant and adult mice. (A) Analysis of T cell numbers at various postnatal ages. Total numbers of lung (left) and spleen (right) CD4+ and CD8+ T cells ± SEM in naive infant mice 1–3 wk old and in adult mice 8 wk old (n = 6–17 mice/group compiled from six independent experiments; significance was determined by one-way ANOVA comparing each infant group to adult controls with Dunn’s multiple comparisons test). ns, P > 0.05; *, P < 0.05; **, P < 0.01; ****, P < 0.0001. (B) Infant (2 wk old) and adult (10–16 wk old) mice were infected with weight-adjusted, sublethal doses of PR8 influenza, and lung viral titers were assessed at the indicated times. Graph shows kinetics of lung viral clearance in adult and infant mice expressed as TCID50/g of lung tissue (±SEM) at the indicated times after infection (n = 3–5 mice per time point, per group compiled from two independent experiments; significance was determined by multiple Student’s t tests comparing infant to adult; *, P < 0.05). (C) Serum HA neutralizing (Neut.) Ab titers, in hemagglutination inhibition assay units (means ± SEM) to whole PR8 viral particles obtained from adult and infant mice at 10 d after infection (n = 8–10 mice/group compiled from two independent experiments; significance was determined by two-tailed Student’s t test with Welch’s correction; **, P < 0.01). (D) Lung and spleen CD4+ and CD8+ T cells in adult and infant mice 15 d after infection. (Top) Representative plots showing percentages of CD4+ and CD8+ T cells with an effector/memory (CD44hiCD62Llo) phenotype (top number). (Bottom) Individual percentages (±SEM) of effector/memory populations (n = 4–8 mice/group compiled from two independent experiments; significance was determined by two-tailed Student’s t test with Welch’s correction; ns, P > 0.05; ***, P < 0.001).
Figure 2.
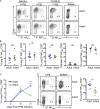
Figure 2.
Comparable primary virus-specific lung T cell responses in infants and adults after influenza infection. Infant (2 wk old) and adult (10–16 wk old) mice were infected as shown in Fig. 1. (A) Representative plots showing percentages of influenza-specific CD8+ T cells in the lungs and spleens at 12–15 d after infection in adult and infant BALB/c and C57BL/6 mice, as indicated. (Left) Lung HA533–541–specific CD8+ T cells; (Middle) Lung PB1703–711–specific CD8+ T cells; (Right two columns) Lung and spleen NP366–374–specific CD8+ T cells in infected adult and infant mice. (B) Individual percentages of lung or spleen virus-specific CD8+ T cells or total numbers of lung NP366-374-specific CD8+ T cells as shown in A for infected infant and adult mice ± SEM (n = 4–8 mice-group compiled from three independent experiments; significance was determined by two-tailed Student’s t test with Welch’s correction; ns, P > 0.05). (C) Frequencies of HA533–541–specific lung CD8+ T cell in adult or infant mice at indicated times after infection ± SEM (n = 5 mice/group, representative of two experiments; significance was determined by multiple Student’s t tests with Welch’s correction; ***, P < 0.001). (D) Persistence of influenza-specific CD8+ T cells 6 wk after infection of infant and adult mice. (Left) Representative flow cytometry plots showing frequencies of NP366–374–specific CD8+ T cells in lung and spleen. (Right) Absolute numbers of NP366–374–specific CD8+T cells (±SEM) in the lungs of mice infected as adults or infants 6 wk previously (n = 7–10 mice/group, compiled from three independent experiments; significance was determined by Student’s t test with Welch’s correction; *, P < 0.05).
Figure 3.
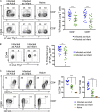
Figure 3.
Infants generate reduced lung TRM compared with adults after influenza infection. Infant and adult mice were infected with PR8 influenza as in Fig. 1 and lung T cell populations were assessed 6 wk after infection. (A) Lung CD4+ or CD8+ T cells labeled by, or protected from, i.v. anti-Thy1 Abs in mice infected 6 wk previously as infants (2 wk old) or adults (10-16 wk old) or in uninfected (naive) adult controls (10–16 wk old). (Left) Representative flow cytometry plots showing percentages of labeled (right number) and protected (left number) lung CD4+ or CD8+ T cells. (Right) Individual percentages (±SEM) of protected lung CD4+ or CD8+ T cells (n = 15–18 mice/group, compiled from four independent experiments; significance was determined by two-way ANOVA with Holm-Sidak’s multiple comparisons test; ***, P < 0.001). (B) Lung NP366–374–specific memory CD8+ T cells in mice infected 6 wk previously as infants or adults. (Left) Representative flow plots. (Right) Individual percentages of protected lung NP366–374–specific CD8+ T cells from previously infected adult or infant mice ± SEM (n = 15–18 mice/group, compiled from four independent experiments; significance was determined by Student’s t test with Welch’s correction; **, P < 0.01). (C) Expression of TRM phenotype markers (CD11a, CD69, CD103) by protected lung CD4+ or CD8+ T cells in mice infected 6 wk previously as infants or adults or in uninfected, naive, adult-littermate controls. (Left) Representative flow plots. (Right) Individual percentages (±SEM) of lung CD4+ TRM (CD69+CD11a+) or CD8+ TRM (CD69+CD103+) in mice previously infected as adults or infants compared with uninfected mice (n = 5–15 mice/group, compiled from three independent experiments; significance was determined by two-way ANOVA with Holm-Sidak’s multiple comparisons test; ****, P < 0.0001).
Figure 4.
Figure 4.
Reduced lung TRM-mediated heterosubtypic protection in mice previously infected during infancy versus adulthood. Mice were infected with PR8 influenza as infants (2 wk old) or as adults (10–16 wk old) as in Fig. 2, and 6 wk later, groups were challenged with the heterosubtypic strain X31 strain in the presence of treatment with FTY720 or PBS control. Naive mice were littermate controls of PR8-infected adult mice that were similarly challenged with X31. (A) Morbidity after heterosubtypic challenge expressed as mean percentage of weight retention (±SEM) after infection in mice treated daily with PBS (left) or FTY720 (right; n = 4–9 mice/group compiled from two independent experiments; significance was determined by multiple Student’s t tests comparing infected-as-adult to infected-as-infant mice; *, P < 0.05). (B) Lung viral titers 5 d after heterosubtypic challenge in mice previously infected as adults or infants as in A. Individual lung viral titers (TCID50/lung ± SEM) are shown for mice receiving daily PBS treatment (left) or FTY720 treatment (right; n = 4–9 mice/group, compiled from two independent experiments; significance was determined by one-way ANOVA with Holm-Sidak’s multiple comparisons test; *, P < 0.05).
Figure 5.
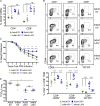
Figure 5.
Reduced TRM generation and TRM-mediated heterosubtypic protection in LAIV-vaccinated infants compared with adults. Infant and adult mice were vaccinated i.p. with IIV or i.n. with LAIV (littermate controls were used for the different vaccinations) and lung T cell responses were analyzed 10 d or 6 wk later. (A) Frequency of lung effector/memory (CD44+CD62Llo) CD4+ and CD8+ T cells in adult or infant mice vaccinated 10 d prior with IIV or LAIV (individual data ± SEM, n = 4–5 mice/group, representative of two experiments; significance determined by two-way ANOVA with Holm-Sidak’s multiple comparisons test; ns, P > 0.05; ****, P < 0.0001). (B) Lung CD4+ and CD8+ TRM in mice vaccinated 6 wk previously with IIV or LAIV as adults or infants. (Top) Representative flow cytometry plots. (Bottom) Individual frequencies of protected lung CD4+ and CD8+ T cells expressing CD69 or CD103 ± SEM (n = 4–5 mice/group, representative of 2 experiments; significance determined by multiple Student’s t tests with Holm-Sidak’s comparison correction; ****, P < 0.0001). (C) Mice vaccinated as in B were challenged i.n. with the heterosubtypic strain PR8 (H1N1) influenza in the presence of FTY720. Graph shows morbidity expressed as mean percentage weight retention ± SEM (n = 5 mice/group, representative of two experiments; significance determined by multiple Student’s t tests comparing adult to infant LAIV vaccinated; *, P < 0.05; **, P < 0.01). (D) Lung viral titers 7 d after PR8 infection in mice challenged as in C (individual data ± SEM; n = 4–5 mice/group, representative of two experiments; significance determined by one-way ANOVA with Holm-Sidak’s multiple comparisons test; ns, P > 0.05; *, P < 0.05 between IIV- and LAIV-vaccinated groups).
Figure 6.
Figure 6.
Reduced lung TRM generation by infants is intrinsic to T cells. Influenza HA–specific CD4+ T cells isolated from adult or infant TS1-transgenic mice (Thy1.1+) were transferred to adult or infant congenic hosts, respectively, resulting in four groups ([1] adult to adult; [2] adult to infant; [3] infant to adult; and [4] infant to infant) which were subsequently infected with PR8 influenza and assessed 72 h (A), 13 d (B), or 6 wk (C) after infection. (A) Mean frequencies (±SEM) of transferred adult or infant HA-specific T cells (Thy1.1+) in the lungs or mediastinal LNs (Med LN) of adult recipient mice 72 h after infection (n = 10–15 mice/group compiled from three independent experiments; significance was determined by Student’s t test with Welch’s correction; ns, P > 0.05). (B) Representative flow cytometry plots with frequencies of transferred adult or infant HA-specific T cells (Thy1.1+) in the lungs of infant or adult recipient mice 13 d (top row) or 6 wk (bottom row) after infection. (C) Mean frequencies (±SEM) of transferred adult or infant, HA-specific T cells (Thy1.1+) in the lungs of infant or adult recipient mice 13 d (left) or 6 wk (right) after infection (n = 4–11 mice/group, per time point, compiled from six independent experiments; significance was determined by one-way ANOVA with a Holm-Sidak’s multiple comparisons test; ns, P > 0.05; *, P < 0.05).
Figure 7.
Figure 7.
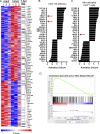
Gene expression analysis of infant versus adult lung CD4 effectors reveals a T-bet signature. Influenza HA-specific CD4+ T cells isolated from infant or adult TS1 mice (Thy1.1+) were transferred to adult congenic hosts, which were subsequently infected with PR8 influenza as in Fig. 6, and lung Thy1.1+ cells ("HA effectors") were sorted 13 d later for whole-transcriptome profiling by RNA-Seq. (A) Heat map of genes (634 total) significantly (P < 0.05) differentially expressed between adult and infant lung HA effectors showing relative gene expression from three independent isolates (designated 1, 2, and 3) of adult and infant HA effectors pooled from 5–10 mice/experiment. (Farthest right column) Genes within the heat map (n = 78) regulated by the transcription factor T-bet (“T-bet reg.”). (B) Top predicted, upstream transcriptional regulators, determined using the IPA tool, based on differential gene expression patterns between adult and infant lung HA effectors as displayed in A. Top 30 upstream regulators as assessed by P value, sorted by z-score. Arrows indicate values for T-bet and STAT4. (C) Top IPA-predicted upstream transcriptional regulators based on differential gene expression patterns between adult and infant, spleen-derived, naive (CD44lo) CD4+ T cells stimulated with anti–CD3 and anti–CD28 for 24 h (see Materials and methods). Top 30 transcriptional regulators, as assessed by P value, sorted by z-score. Arrow indicates values for T-bet. Data are representative of gene expression from two independent isolations of adult and infant spleen CD44loCD4+ T cells pooled from 2–10 mice/experiment. (D) GSEA comparing genes significantly differentially expressed between adult and infant lung HA effectors as in A with independently identified T-bet–regulated genes.
Figure 8.
Figure 8.
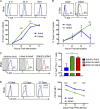
Increased T-bet expression by mouse and human infant T cells in vivo and after in vitro activation. (A) T-bet expression after in vitro activation of mouse infant or adult, naive (CD44lo) CD4+ T cells isolated from spleen. (Top) Representative flow cytometry histograms of T-bet expression after anti-CD3/anti-CD28 activation from 0 to 48 h. (Bottom) Percentages of stimulated adult or infant CD4+ T cells expressing T-bet over unstimulated cells at indicated times ± SEM (n = 3 replicate samples/group/time point, derived from the spleens of 4–10 mice; representative of two experiments; significance determined by multiple Student’s t tests with Welch’s correction; *, P < 0.05; ***, P < 0.001). (B) T-bet expression in human infant and adult, naive (CD45RO) CD4+ T cells from spleen (see Materials and methods) with or without stimulation. (Top) Representative flow cytometry histograms with percentages of T-bethi T cells (expression over unstimulated) 72 h after activation with anti-CD3/anti-CD28 Abs by adult (blue) or infant (green) and unstimulated (Unstim.; black) cells at the indicated times. (Bottom) Percentages of stimulated adult or infant CD4+ T cells expressing T-bet over unstimulated cells at indicated times ± SEM (n = 4 replicate samples/group/time point compiled from two independent experiments, with each group derived from a different spleen sample; significance determined by Student’s t test; **, P < 0.01). (C) Augmented T-bet expression by infant influenza-specific CD4+ T cells in vivo. (Left) Representative flow cytometry histograms with percentages of T-bethi adult or infant HA T cells in the lungs of recipients at day 13 after PR8 influenza infection as in Fig. 6. (Right) Compiled percentages of adult or infant HA T cells in adult or infant recipient lung with a T-bethi (expression over naive) phenotype ± SEM (n = 3–4 mice/group, compiled from two independent experiments; significance determined by one-way ANOVA with Holm-Sidak’s multiple comparisons test; *, P < 0.05). (D) CD127 is reduced in infant compared with adult lung CD4+ T cells after PR8 influenza infection. (Left) Representative flow cytometry histograms of CD127 expression by adult (blue) or infant (green) lung CD4+ T cells at the indicated times after infection. (Right) Mean fluorescence intensity (MFI) values for CD127 expression by adult or infant lung CD4+ T cells at the indicated times ± SEM (n = 5 mice/group per time point, compiled from three experiments; significance was determined by multiple Student’s t tests with Welch’s correction; ****, P < 0.0001).
Figure 9.
Figure 9.
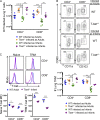
Reduced T-bet expression in infant mice results in enhanced lung TRM establishment after influenza infection. Adult and infant WT or age-matched T-bet+/− mice were infected with PR8 influenza, and lung T cells were analyzed 6–8 wk after infection. (A) Absolute numbers (±SEM) of lung CD4+ and CD8+ T cells protected from i.v. anti–Thy1 Abs (“protected”; Fig. 2) in WT or T-bet+/− mice infected 6–8 wk previously as adults (10–16 wk old) or as infants (2 wk old; n = 4–7 mice/group compiled from two independent experiments; significance was determined by multiple Student’s t tests with Welch’s correction; **, P < 0.01; ***, P < 0.001). (B) Expression of TRM phenotype markers (CD11a, CD69, CD103) by protected lung CD4+ or CD8+ T cells in WT or T-bet+/− mice previously infected as adults or infants as in A. (Top) Representative flow cytometry plots with percentages of CD11a and CD69 expression by CD4+ (left) and CD69 and CD103 expression by CD8+ (right) protected lung T cells. (Bottom) Absolute numbers (±SEM) of lung CD4+ TRM (CD69+CD11a+) or CD8+ TRM (CD69+CD103+) in WT and T-bet+/− mice previously infected as adults or infants (n = 4–7 mice/group compiled from two independent experiments; significance determined by multiple Student’s t tests with Welch’s correction; *, P < 0.05; **, P < 0.01; ***, P < 0.001). (C) T-bet expression by CD4+ and CD8+ naive and TRM subsets in previously infected WT adult mice or T-bet+/− infant mice. Graph (bottom) displays individual T-bet mean fluorescence intensity (MFI) values ± SEM for lung CD4+ or CD8+ naive or TRM T cells (n = 3–4 mice/group, representative of two independent experiments; significance determined by Student’s t test with Welch’s correction; *, P < 0.05; ***, P < 0.001).

References

    1. Anderson K.G., Sung H., Skon C.N., Lefrancois L., Deisinger A., Vezys V., and Masopust D.. 2012. Cutting edge: Intravascular staining redefines lung CD8 T cell responses. J. Immunol. 189:2702–2706. 10.4049/jimmunol.1201682 - DOI - PMC - PubMed
    1. Anderson K.G., Mayer-Barber K., Sung H., Beura L., James B.R., Taylor J.J., Qunaj L., Griffith T.S., Vezys V., Barber D.L., and Masopust D.. 2014. Intravascular staining for discrimination of vascular and tissue leukocytes. Nat. Protoc. 9:209–222. 10.1038/nprot.2014.005 - DOI - PMC - PubMed
    1. Banerjee A., Gordon S.M., Intlekofer A.M., Paley M.A., Mooney E.C., Lindsten T., Wherry E.J., and Reiner S.L.. 2010. Cutting edge: The transcription factor eomesodermin enables CD8+ T cells to compete for the memory cell niche. J. Immunol. 185:4988–4992. 10.4049/jimmunol.1002042 - DOI - PMC - PubMed
    1. Belshe R.B., Edwards K.M., Vesikari T., Black S.V., Walker R.E., Hultquist M., Kemble G., and Connor E.M.. CAIV-T Comparative Efficacy Study Group . 2007. Live attenuated versus inactivated influenza vaccine in infants and young children. N. Engl. J. Med. 356:685–696. 10.1056/NEJMoa065368 - DOI - PubMed
    1. Bevan M.J. 2004. Helping the CD8+ T-cell response. Nat. Rev. Immunol. 4:595–602. 10.1038/nri1413 - DOI - PubMed

MeSH terms

Substances