. 2017 Nov;27(11):1916-1929.
doi: 10.1101/gr.218032.116. Epub 2017 Aug 30.

The Mobile Element Locator Tool (MELT): population-scale mobile element discovery and biology

Affiliations

The Mobile Element Locator Tool (MELT): population-scale mobile element discovery and biology

Eugene J Gardner et al. Genome Res. 2017 Nov.

Abstract

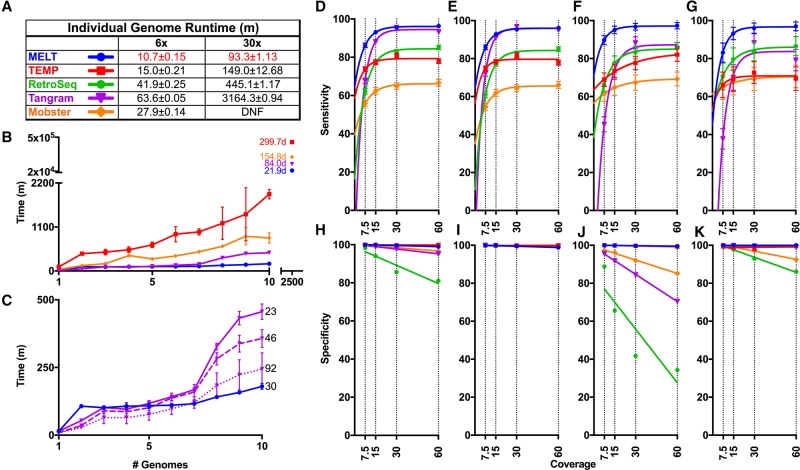
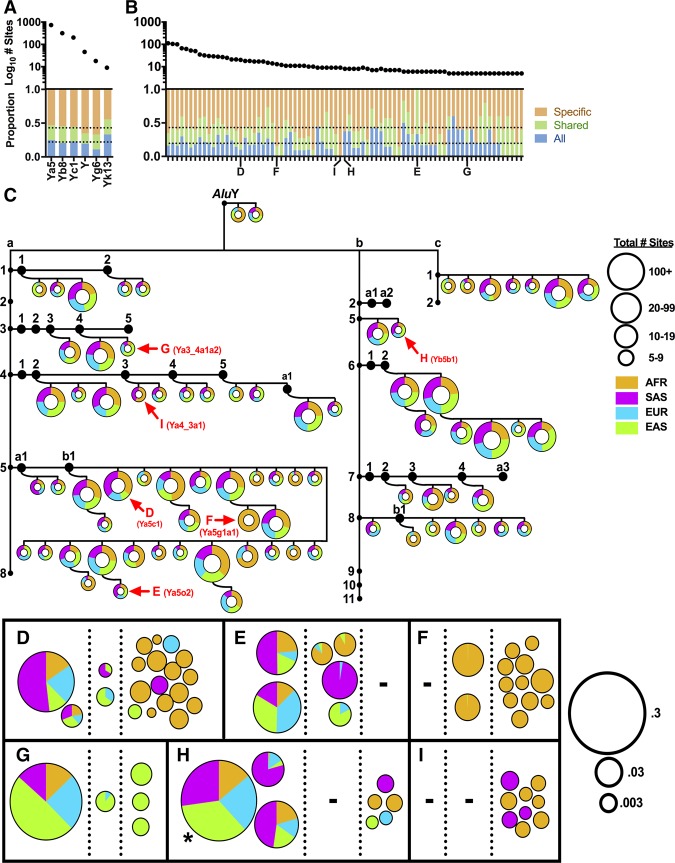
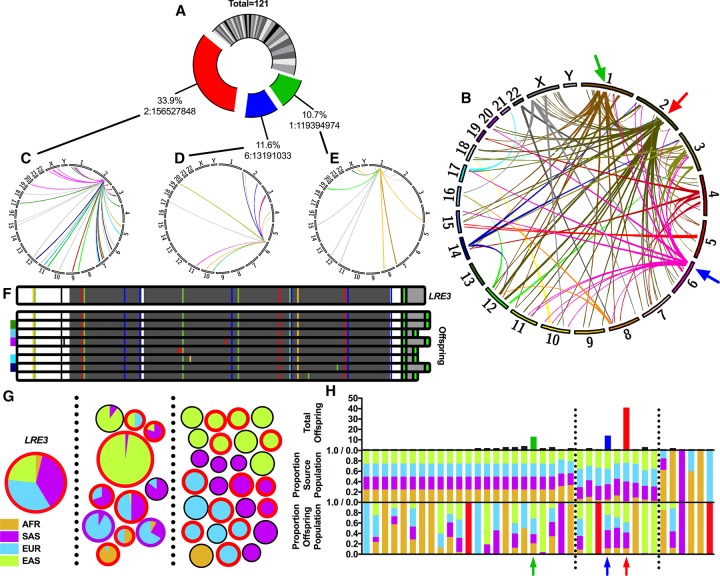
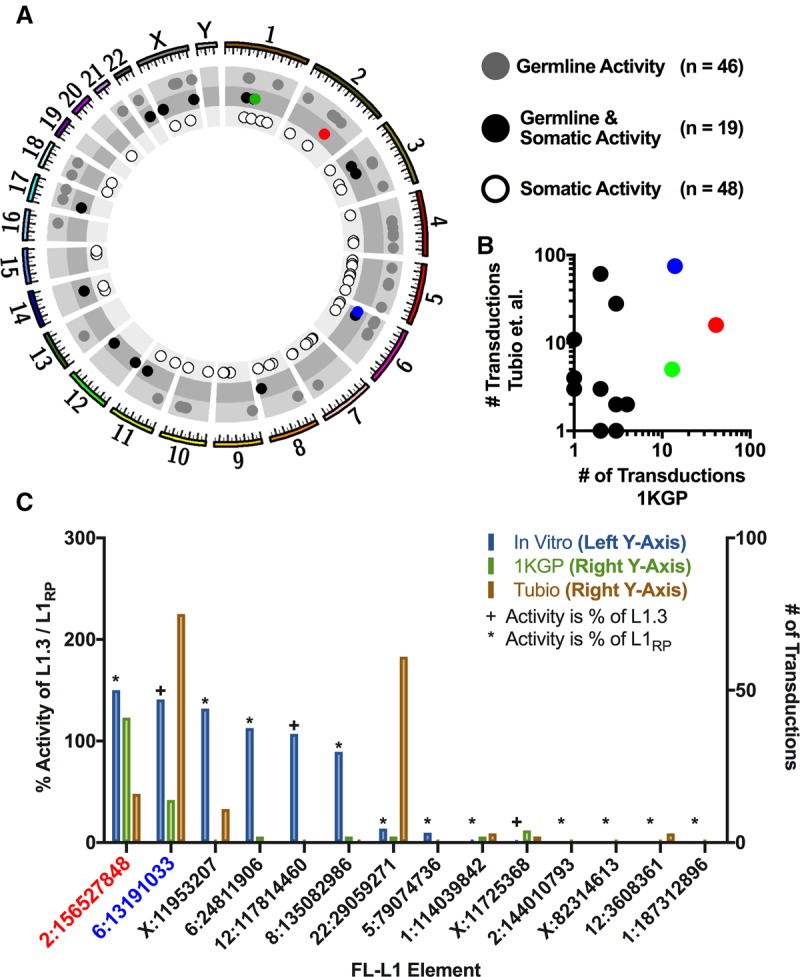
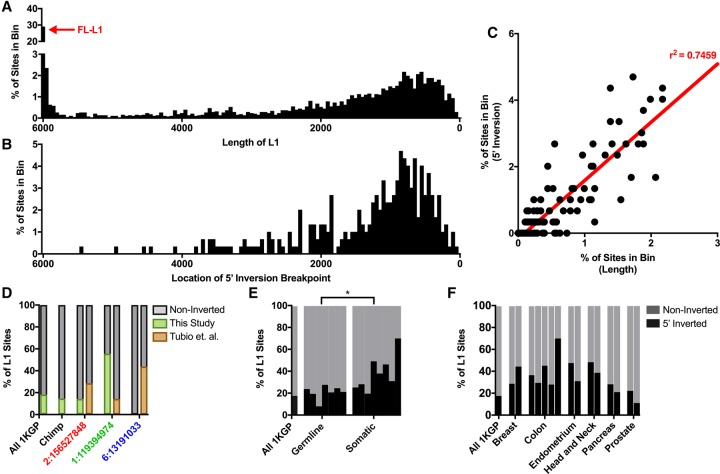
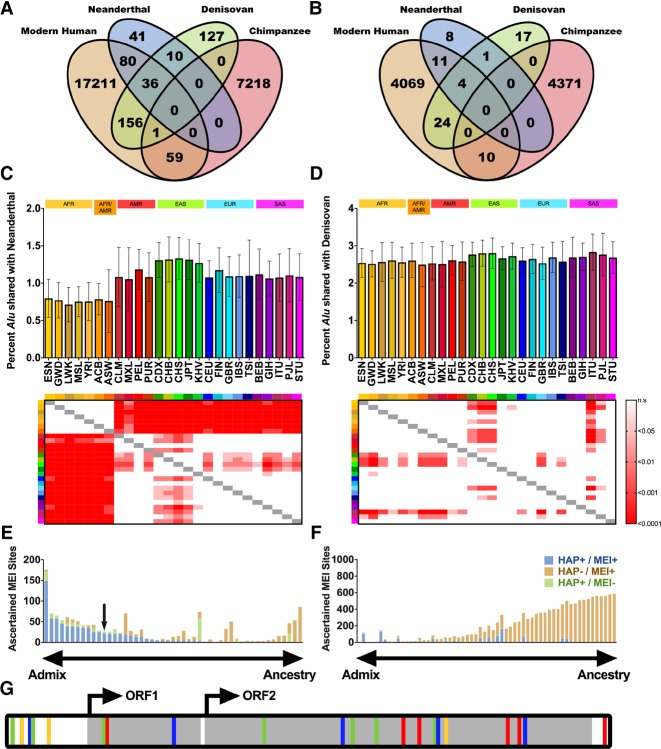
Mobile element insertions (MEIs) represent ∼25% of all structural variants in human genomes. Moreover, when they disrupt genes, MEIs can influence human traits and diseases. Therefore, MEIs should be fully discovered along with other forms of genetic variation in whole genome sequencing (WGS) projects involving population genetics, human diseases, and clinical genomics. Here, we describe the Mobile Element Locator Tool (MELT), which was developed as part of the 1000 Genomes Project to perform MEI discovery on a population scale. Using both Illumina WGS data and simulations, we demonstrate that MELT outperforms existing MEI discovery tools in terms of speed, scalability, specificity, and sensitivity, while also detecting a broader spectrum of MEI-associated features. Several run modes were developed to perform MEI discovery on local and cloud systems. In addition to using MELT to discover MEIs in modern humans as part of the 1000 Genomes Project, we also used it to discover MEIs in chimpanzees and ancient (Neanderthal and Denisovan) hominids. We detected diverse patterns of MEI stratification across these populations that likely were caused by (1) diverse rates of MEI production from source elements, (2) diverse patterns of MEI inheritance, and (3) the introgression of ancient MEIs into modern human genomes. Overall, our study provides the most comprehensive map of MEIs to date spanning chimpanzees, ancient hominids, and modern humans and reveals new aspects of MEI biology in these lineages. We also demonstrate that MELT is a robust platform for MEI discovery and analysis in a variety of experimental settings.


Figures

Figure 1.
Figure 1.
Comparisons of MEI discovery algorithms. (AC) Runtime comparisons between MELT and four other MEI discovery algorithms: RetroSeq Mobster, Tangram, and TEMP. (A) Runtime in minutes on either a 6× or 30× coverage genome using a single processor (numbers are mean ± SD), with the best time for each coverage indicated in red. (B) Time required for each algorithm to analyze between one and 10 genomes using a distributed computing cluster. Shown to the right of experimental data are extrapolated estimates of the total runtimes for 2504 genomes with each algorithm. (C) Identical to B but depicting the median runtime for only MELT and Tangram. Tangram was run with 23, 46, or 92 threads (numbers to the right of lines). (DG) Comparison of sensitivities for MELT and the MEI detection algorithms outlined above. False negative rates (FNRs) are plotted for (D) Aggregate, (E) Alu, (F) L1, and (G) SVA. (HK) Comparison of specificities for MELT and the MEI detection algorithms outlined above. False discovery rates (FDRs) are plotted for (H) Aggregate, (I) Alu, (J) L1, and (K) SVA (Supplemental Table S5).
Figure 2.
Figure 2.
Complex patterns of Alu subfamily expansion in diverse human populations. Six known Alu subfamilies (A) and 79 novel Alu subfamilies (B) that were identified using interior sequence changes were analyzed for sharing among the 1000 Genomes Project nonadmixed continental populations. Plotted are: (top) log10 total sites in each subfamily; (bottom) proportion of sites shared among all continental populations (blue); proportion of sites shared by two or three continental populations (green); proportion of sites that are specific to one continental population (brown). The average proportion for each category is indicated by a horizontal dotted line. (C) Tree of 79 novel AluY subfamilies. We required at least five independent copies with a novel set of interior mutations (excluding CpG sites) to establish new subfamilies. This threshold is fairly conservative and eliminates errors introduced by Illumina sequencing. After CAlu classification (Supplemental Fig. S9), novel Alu subfamilies were placed on a tree of known AluY families (a, b, and c shown) and subfamilies (small black circles). Each pie chart represents the sum of allele counts for all constituent sites of a particular novel subfamily with the total number of identical loci represented by the diameter of the pie (see Supplemental Fig. S10 for figure key). (AFR) African; (SAS) South Asian; (EUR) European; (EAS) East Asian. (DI) Families with unique population sharing are shown, with each pie representing the proportion of total alleles from each of the four major continental populations of the 1000 Genomes Project. Each site is placed into one of three categories based on population sharing: present in all four continental populations (left); in two or three continental populations (middle); or in one continental population (right). Pies are sized based on the log10 allele frequency of each site. (*) Actual AF is 0.52446. Alu subfamilies were named as outlined in Batzer et al. 1996 (Supplemental Table S8).
Figure 3.
Figure 3.
Analysis of L1 source-offspring relationships using 3′ transductions. (A) Pie chart depicting the proportion of offspring attributable to each of the 38 FL-L1 source elements identified in this study. One hundred twenty-one out of 4118 (2.9%) of the L1s identified had 3′ transductions that could be used to identify the FL-L1 source elements that produced these offspring insertions (Supplemental Table S9). Note that this method can only be used to track source/offspring relationships for L1′s that produce 3′ transductions. The LRE3, Chr 6: 13191033, and Chr 1: 119394974 FL-L1 source elements are indicated in red, blue, and green, respectively. (B) Circos plot (Krzywinski et al. 2009) depicting the genomic landscape of source-offspring relationships summarized in A. Red, blue, and green arrows indicate the three FL-L1 source elements highlighted in A. (CE) Individual Circos plots tracking offspring for the three most active FL-L1 source elements from A. Each source-offspring relationship is colored based on the population in which the offspring element is found (gray if found in multiple populations). (F) LRE3 was sequenced from an individual of European descent (top), along with eight FL-L1 LRE3 offspring. Sequence changes compared to the L1.3 FL-L1 element (Dombroski et al. 1993) are shown as blue, green, yellow, red, or black vertical lines representing C, A, G, T, or deletion mutations, respectively. All eight sequenced FL-L1 offspring of LRE3 have two intact ORFs (dark gray bars). The first poly(A) tail is shown in bright green, with transduced sequence shown in light gray. Offspring elements that have a 3′ transduction also have a second poly(A) tail (bright green). The five population-specific FL-L1 elements are indicated by the 1000 Genomes Project population colors next to the elements. (G) LRE3 transduction family, displayed in a similar manner to Figure 2 (American [AMR]-specific offspring not shown; n = 3). Each pie chart represents either LRE3 (labeled) or one LRE3 offspring locus from C. Borders of each pie are colored red if the element is a FL-L1 (n = 20), or purple if it has a 5′ inversion (n = 2). (H) Source and offspring element population distributions. Shown for each source element is the total number of offspring (top), the population distribution of the source element (middle), and the aggregate population distribution of all offspring (bottom). Highlighted with colored arrows are source elements from A. Red bars indicate where offspring were only found in the American continental population. Vertical black dotted lines separate source elements into one of three classes: found in all populations (left), found predominantly in OOA populations (middle), and found in a subset of other populations (right).
Figure 4.
Figure 4.
Recently-active FL-L1 source elements in human populations and cancers. (A) Circos plot of the human genome with coordinates of known active FL-L1 source elements producing 3′ transductions (circles) (Supplemental Table S9). FL-L1s are further separated into one of three categories based on the tissue type(s) in which activity was recorded. The three most active FL-L1 source elements identified in this study are represented as circles corresponding to the colors in Figure 3A. (B) Log-log plot depicting 14 L1 source elements that were active in the germline (this study) and somatic tumors (Tubio et al. 2014). The three most active germline elements (this study) are highlighted according to the colors in Figure 3A and are active in somatic cancers as well. Note that one of the dots represents two separate L1 source elements, as both have the same number of germline and somatic offspring. (C) Comparison of FL-L1 element activity in the cell culture-based retrotransposition assay (percent of L1.3 or L1RP activity, light blue) (Brouha et al. 2002, 2003; Beck et al. 2010) with the total number of offspring identified in this study (light green) and the Tubio et al. study (light orange) (Tubio et al. 2014). Only elements that were active in the germline (this study), cancers (Tubio et al. 2014), and the cell culture-based assay were displayed.
Figure 5.
Figure 5.
L1 5′ inversions in germline and somatic tissues. (A) L1 length distribution among sites discovered in the 1000 Genomes Project Phase III samples. (B) 5′ inversion positions discovered in the 1000 Genomes Project Phase III samples (Supplemental Table S10). (C) Correlation between the distributions shown in A and B, with the linear trend line and r2 correlation shown in red. FL-L1 (red arrow in A) sites were excluded from this comparison because no correlation was observed in the first ∼590 bp of FL-L1 elements. (D) 5′ inversion rates among all L1 sites in the 1000 Genomes Project, chimpanzee, and among particularly active 3′ transducers highlighted in Figure 3, C–E. (E) Total number of 5′ inverted sites from 1000 Genomes Project MEIs (this study) compared with other germline and somatic studies. The proportion of 5′ inverted sites is significantly different ([*] P = 0.0207) between germline and somatic insertions (Supplemental Table S10). (F) Comparison of germline 5′ inversion rates (1000 Genomes Project MEIs) and several different tumor types analyzed by various studies (Supplemental Table S10).
Figure 6.
Figure 6.
Mobile element activity in ancient human genomes and introgression of ancient MEIs into modern humans. (A,B) Sharing of (A) Alu and (B) L1 MEIs between Neanderthal, Denisovan, modern humans, and chimpanzees (Supplemental Table S11). (C,D) Sharing of Neanderthal and Denisovan Alu MEIs in each of the 26 1000 Genomes Project Phase III populations. For each population, we determined the average percentage per individual of Alu MEIs shared with (C) Neanderthal or (D) Denisovan. Heat maps represent multiple comparison ANOVA P-values between each population (key at right). (E) Analysis of Neanderthal MEI introgression in non-African individuals. Each bar represents one MEI site that was shared between Neanderthal and non-African individuals (i.e., the site was found only in SAS, EUR, and/or EAS). Bars are colored by MEI overlap with Neanderthal haplotypes (Supplemental Methods; Sankararaman et al. 2014), with sites to the left of the chart likely contributed to modern humans by introgression from Neanderthals and sites to the right likely due to common ancestry. “HAP” indicates whether the Neanderthal haplotype is present at the site (HAP+ or HAP−). “MEI” indicates whether the MEI is present at the site (MEI+ or MEI−). Blue bars indicate a high degree of linkage disequilibrium (LD) between the Neanderthal haplotype and the MEI (HAP+/MEI+), and brown bars indicate little or no correlation between the Neanderthal haplotype and the MEI (HAP-/MEI+). Blue sites have r2 values for HAP+/MEI+ of >0.5, whereas brown sites segregate independently (Supplemental Table S11; Supplemental Methods). The black arrow indicates the FL-L1 element described in G. (F) Analysis of Neanderthal MEI introgression in all individuals. Identical analysis to E but for sites with an AFR allele frequency greater than zero. (G) Cartoon of an FL-L1 element sequenced from a GBR individual, with differences shown as in Figure 3F. The quality of ancient MEI calls was comparable to those called in modern humans (Supplemental Fig. S12).

References

    1. The 1000 Genomes Project Consortium. 2010. A map of human genome variation from population-scale sequencing. Nature 467: 1061–1073. - PMC - PubMed
    1. The 1000 Genomes Project Consortium. 2012. An integrated map of genetic variation from 1092 human genomes. Nature 491: 56–65. - PMC - PubMed
    1. The 1000 Genomes Project Consortium. 2015. A global reference for human genetic variation. Nature 526: 68–74. - PMC - PubMed
    1. Baillie JK, Barnett MW, Upton KR, Gerhardt DJ, Richmond TA, De Sapio F, Brennan PM, Rizzu P, Smith S, Fell M, et al. 2011. Somatic retrotransposition alters the genetic landscape of the human brain. Nature 479: 534–537. - PMC - PubMed
    1. Batzer MA, Deininger PL. 2002. Alu repeats and human genomic diversity. Nat Rev Genet 3: 370–379. - PubMed

Publication types

Substances