IL-23 drives differentiation of peripheral γδ17 T cells from adult bone marrow-derived precursors
- PMID: 28855306
- PMCID: PMC5666615
- DOI: 10.15252/embr.201744200
IL-23 drives differentiation of peripheral γδ17 T cells from adult bone marrow-derived precursors
Abstract
Pro-inflammatory interleukin (IL)-17-producing γδ (γδ17) T cells are thought to develop exclusively in the thymus during fetal/perinatal life, as adult bone marrow precursors fail to generate γδ17 T cells under homeostatic conditions. Here, we employ a model of experimental autoimmune encephalomyelitis (EAE) in which hematopoiesis is reset by bone marrow transplantation and demonstrate unequivocally that Vγ4+ γδ17 T cells can develop de novo in draining lymph nodes in response to innate stimuli. In vitro, γδ T cells from IL-17 fate-mapping reporter mice that had never activated the Il17 locus acquire IL-17 expression upon stimulation with IL-1β and IL-23. Furthermore, IL-23R (but not IL-1R1) deficiency severely compromises the induction of γδ17 T cells in EAE, demonstrating the key role of IL-23 in the process. Finally, we show, in a composite model involving transfers of both adult bone marrow and neonatal thymocytes, that induced γδ17 T cells make up a substantial fraction of the total IL-17-producing Vγ4+ T-cell pool upon inflammation, which attests the relevance of this novel pathway of peripheral γδ17 T-cell differentiation.
Keywords: IL‐17; IL‐23; T‐cell differentiation; experimental autoimmune encephalomyelitis; γδ T cells.
© 2017 The Authors. Published under the terms of the CC BY 4.0 license.
Figures

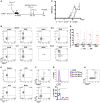
Experimental setup: bone marrow chimeras (BMCs) were generated by injecting total bone marrow cells from wild‐type (WT) Thy1.1+ donor mice into TCRδ−/− (Thy1.2+) hosts. After 8 weeks, these BMCs were immunized s.c. in both flanks with 125 μg of MOG(35–55) peptide emulsified in CFA solution; additionally, BMCs were given 200 ng of PTx i.v. on days 0 and 2 p.i. for additional adjuvant effect. Mice were sacrificed at day 14 p.i., and brain, draining lymph nodes (dLN), cervical lymph nodes (cLN), and spleen were harvested.
Flow cytometry analysis of intracellular IL‐17A and IFN‐γ expression in Thy1.1+CD3+TCRδ+ cells isolated from naïve or EAE‐induced Thy1.1:TCRδ−/− BMCs.
Mice were observed daily and scored for clinical signs of EAE.
Frequencies of IL‐17A+ cells within the Thy1.1+CD3+TCRδ+ population in the different organs analyzed. Each symbol represents an individual BMC.
Flow cytometry analysis of TCR‐Vγ4 and TCR‐Vγ1 expression in Thy1.1+CD3+TCRδ+IL‐17A+ cells isolated from EAE‐induced Thy1.1:TCRδ−/− BMC.
Flow cytometry analysis of intracellular RORγt (top panel) and T‐bet (bottom panel) expression in Thy1.1+CD3+TCRδ+IL‐17A+ cells isolated from the spleen of EAE‐induced Thy1.1:TCRδ−/− BMC.
Flow cytometry analysis of IL‐1RI expression in IL‐17A+ (blue), IFN‐γ+ (red) or IL‐17A−IFN‐γ− (purple) cells within Thy1.1+CD3+TCRδ+Vγ4+ cells isolated from the spleen of EAE‐induced Thy1.1:TCRδ−/− BMC. FMO refers to Fluorescence Minus One (FMO) controls (without anti‐IL‐1R1 antibody) on the same cell population.
Flow cytometry analysis of CD44 and IL‐17A expression in Thy1.1+CD3+TCRδ+ cells isolated from the spleen of EAE‐induced Thy1.1:TCRδ−/− BMC.


Flow cytometry analysis of intracellular IL‐17A and IFN‐γ expression in Thy1.1+CD3+TCRδ+ cells isolated from naïve or EAE‐induced Thy1.1:TCRδ−/− BMCs (n = 5–6 mice per group), established as in Fig 1A.
Frequencies of IL‐17A+ cells within the Thy1.1+CD3+TCRδ+ population in the draining LN of the BMCs in (A).
Flow cytometry analysis of intracellular IL‐17A and Ki67 expression in Thy1.1+CD3+TCRδ+ cells isolated from EAE‐induced Thy1.1:TCRδ−/− BMCs (as in A).
Frequencies of IL‐17A+ cells within the Thy1.1+CD3+TCRδ+ population in the organs of the BMCs depicted in (A).

- A
Flow cytometry analysis of intracellular IL‐17A and IFN‐γ expression in Thy1.1+CD3+TCRδ+ cells isolated from the dLN of Thy1.1:TCRδ−/− BMCs injected subcutaneously with IFA or CFA followed or not by PTx administration.
- B
Frequencies of Thy1.1+CD3+TCRδ+IL‐17A+ cells within the Thy1.1+CD3+TCRδ+ population in the dLN of the BMCs in (A).
- C, D
Thy1.1:TCRδ−/− or MyD88−/−:TCRδ−/− BMCs were injected subcutaneously with CFA and given 200 ng of PTx i.v. on days 0 and 2 p.i. for additional adjuvant effect. (C) Flow cytometry analysis of intracellular IL‐17A and IFN‐γ expression in CD3+TCRδ+ cells isolated at day 7 p.i. Data are representative of two independent experiments. (D) Frequencies of IL‐17A+ cells within the CD3+TCRδ+ population in the dLN.

- A
Flow cytometry analysis of intracellular IL‐17A and IFN‐γ expression in Thy1.1+CD3+TCRδ+ cells isolated from the dLN of Thy1.1:TCRδ−/− BMCs injected subcutaneously with IFA or CFA followed or not by PTx administration.
- B
Flow cytometry analysis of intracellular IL‐17A and IFN‐γ expression in Thy1.1+CD3+TCRδ+ cells isolated at day 7 p.i. from the spleens of Thy1.1:TCRδ−/− or MyD88−/−:TCRδ−/− BMCs immunized subcutaneously with CFA and given 200 ng of PTx i.v. on days 0 and 2 p.i.
- C, D
Flow cytometry analysis and frequencies of intracellular IL‐17A and IFN‐γ expression in Thy1.1+CD3+TCRδ+ cells isolated at day 3 p.i. from the dLN and spleens of Thy1.1:TCRδ−/− BMCs injected subcutaneously 50 μg of each individual TLR agonist (Pam3CSK4, Poly(I:C), LPS or CpG).

- A–C
CD3+TCRδ+eYFP− cells were FACS‐sorted from the peripheral LN and spleen of Il17a Cre R26R eYFP mice and cultured in vitro for 72 h in the presence of IL‐1β (10 ng/ml), IL‐23 (10 ng/ml), IL‐6 (10 ng/ml), TGF‐β (10 ng/ml), and plate‐bound anti‐CD3 mAb (10 μg/ml) combined as shown in (A). All conditions also included IL‐7 and IL‐21 (10 ng/ml each), except condition I, which contained IL‐7 (10 ng/ml) only. Data pooled from two independent experiments (n = 7 mice per experiment). (A) Flow cytometry analysis of eYFP expression in CD3+TCRδ+ cells after 72 h under the conditions depicted. Data are representative of two independent experiments. (B) Frequency and (C) mean fluorescence intensity (MFI) of eYFP+ in CD3+TCRδ+ cells (as in A).
- D
WT (Thy1.1+) and IL‐23R−/− (Thy1.2+) or IL‐1R1−/− (Thy1.2+) bone marrow total cells were mixed at 1:1 ratio to reconstitute lethally irradiated TCRδ−/− hosts. After 8 weeks, mice were injected subcutaneously with CFA and given 200 ng of PTx i.v. on days 0 and 2 p.i. for additional adjuvant effect. “Naïve” refers to non‐immunized BMCs.
- E
Flow cytometry analysis of intracellular IL‐17A and IFN‐γ expression in CD3+TCRδ+ cells isolated at day 7 p.i. from the dLN of the Thy1.1:IL‐23R−/− mixed BMCs (D).
- F
Frequencies of IL‐17A+ cells within the CD3+TCRδ+ population in the dLN of naïve (white bar) or CFA‐immunized (gray bar) Thy1.1:IL‐23R−/− mixed BMCs (as in D).
- G
Flow cytometry analysis and frequencies of IL‐23R+/+ (Thy1.1+Thy1.2−; white bar) and IL‐23R−/− (Thy1.1−Thy1.2+; black bar) within CD3+TCRδ+IL‐17A+ cells from the dLN of CFA‐immunized Thy1.1:IL‐23R−/− mixed BMCs (as in D).
- H
Flow cytometry analysis of intracellular IL‐17A and IFN‐γ expression in CD3+TCRδ+ cells isolated at day 7 p.i. from the dLN of Thy1.1:IL‐1R1−/− mixed BMCs (D).
- I
Frequencies of IL‐17A+ cells within the CD3+TCRδ+ population in the dLN of naïve (white bar) or CFA‐immunized (gray bar) Thy1.1:IL‐1R1−/− mixed BMCs (as in D).
- J
Flow cytometry analysis and frequencies of IL‐1R1+/+ (Thy1.1+Thy1.2−; white bar) and IL‐1R1−/− (Thy1.1−Thy1.2+; black bar) within CD3+TCRδ+IL‐17A+ cells from the dLN of CFA‐immunized Thy1.1:IL‐1R1−/− mixed BMCs (as in D).

Flow cytometry analysis of IL‐23R+/+ (Thy1.1+Thy1.2−) and IL‐23R−/− (Thy1.1−Thy1.2+) within total CD3+TCRδ+ cells. Data are representative of two independent experiments.
Frequencies of IL‐23R+/+ (Thy1.1+Thy1.2−; white bar) and IL.23R−/− (Thy1.1−Thy1.2+; black bar) within CD3+TCRδ+ cells from the dLN of naïve or CFA‐immunized BMCs.
Flow cytometry analysis of IL‐1RI+/+ (Thy1.1+Thy1.2−) and IL‐1RI−/− (Thy1.1−Thy1.2+) within total CD3+TCRδ+ cells. Data are representative of two independent experiments.
Frequencies of IL‐231+/+ (Thy1.1+Thy1.2−; white bar) and IL.1RI−/− (Thy1.1−Thy1.2+; black bar) within CD3+TCRδ+ cells from the dLN of naïve or CFA‐immunized BMCs.

- A
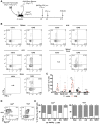
Neonatal thymocytes (NeoThy; Thy1.1+Thy1.2+) and bone marrow cells (BM; Thy1.1+Thy1.2−) were injected into lethally irradiated TCRδ−/− hosts (Thy1.1−Thy1.2+). After 8 weeks, these NeoThy+BM chimeras were immunized s.c. in both flanks with 125 μg of MOG(35–55) peptide emulsified in CFA solution; additionally, BMCs were given 200 ng of PTx i.v. on days 0 and 2 p.i. for additional adjuvant effect. Mice were sacrificed on day 14 p.i., at the peak of the disease, and brain, spinal cord, dLN, cLN, and spleen were harvested.
- B
Flow cytometry analysis of intracellular IL‐17A and IFN‐γ expression in CD3+TCRδ+ cells isolated from naïve or EAE‐induced NeoThy+BM chimeras.
- C
Frequencies of IL‐17A+ cells within the CD3+TCRδ+ population in the different organs analyzed from naïve (black bar) and EAE‐immunized (red bar) NeoThy+BM chimeras.
- D, E
Flow cytometry analysis (D) and frequencies (E) of NeoThy (Thy1.1+Thy1.2+)‐ versus BM (Thy1.1+Thy1.2−)‐derived cells within CD3+TCRδ+IL‐17A+Vγ4+CD44hi (left panels) and CD3+TCRδ+IL‐17A+Vγ4−CD44hi (right panels) cells.

Flow cytometry analysis of the fraction of Thy1.1+Thy1.2− (BM; white) or Thy1.1+Thy1.2+ (NeoThy; gray) cells among Vγ4+ (left) or Vγ4− (right) subsets of CD3+TCRδ+IL‐17A+ lymph node cells from lethally irradiated mice transplanted with both neonatal thymocytes and bone marrow (n = 7 mice). *P < 0.05 (Student's t‐test). Data are representative of two independent experiments.
Mice were observed daily and scored for clinical signs of EAE.
Pie chart distribution of TCR‐Vγ chain usage of γδ17 T cells from different organs of naïve (left) or EAE‐immunized (right) NeoThy+BM chimeras, as determined by flow cytometry analysis of TCR‐Vγ1 and TCR‐Vγ4 expression within the CD3+TCRδ+IL‐17A+ population.
Frequencies of Vγ4+CD44hi cells within the CD3+TCRδ+IL‐17A+ population determined by flow cytometry in different organs of naïve (black bar) or EAE‐immunized (red bar) NeoThy + BM chimeras.
Similar articles
-
Interleukin-17-producing γδ T (γδ17) cells in inflammatory diseases.Immunology. 2018 Dec;155(4):418-426. doi: 10.1111/imm.12993. Epub 2018 Sep 10. Immunology. 2018. PMID: 30133701 Free PMC article. Review.
-
IL-7-dependent compositional changes within the γδ T cell pool in lymph nodes during ageing lead to an unbalanced anti-tumour response.EMBO Rep. 2019 Aug;20(8):e47379. doi: 10.15252/embr.201847379. Epub 2019 Jul 8. EMBO Rep. 2019. PMID: 31283095 Free PMC article.
-
Interleukin-1 and IL-23 induce innate IL-17 production from gammadelta T cells, amplifying Th17 responses and autoimmunity.Immunity. 2009 Aug 21;31(2):331-41. doi: 10.1016/j.immuni.2009.08.001. Epub 2009 Aug 13. Immunity. 2009. PMID: 19682929
-
Innately versatile: γδ17 T cells in inflammatory and autoimmune diseases.J Autoimmun. 2018 Feb;87:26-37. doi: 10.1016/j.jaut.2017.11.006. Epub 2017 Dec 6. J Autoimmun. 2018. PMID: 29203226 Review.
-
Caspase-1-processed cytokines IL-1beta and IL-18 promote IL-17 production by gammadelta and CD4 T cells that mediate autoimmunity.J Immunol. 2011 May 15;186(10):5738-48. doi: 10.4049/jimmunol.1003597. Epub 2011 Apr 6. J Immunol. 2011. PMID: 21471445
Cited by
-
Spleen tyrosine kinase mediates the γδTCR signaling required for γδT cell commitment and γδT17 differentiation.Front Immunol. 2023 Jan 12;13:1045881. doi: 10.3389/fimmu.2022.1045881. eCollection 2022. Front Immunol. 2023. PMID: 36713401 Free PMC article.
-
Decoding IL-23 Signaling Cascade for New Therapeutic Opportunities.Cells. 2020 Sep 7;9(9):2044. doi: 10.3390/cells9092044. Cells. 2020. PMID: 32906785 Free PMC article. Review.
-
γδ T cells respond directly and selectively to the skin commensal yeast Malassezia for IL-17-dependent fungal control.PLoS Pathog. 2024 Jan 12;20(1):e1011668. doi: 10.1371/journal.ppat.1011668. eCollection 2024 Jan. PLoS Pathog. 2024. PMID: 38215167 Free PMC article.
-
T cell receptor signaling for γδT cell development.Inflamm Regen. 2019 Mar 28;39:6. doi: 10.1186/s41232-019-0095-z. eCollection 2019. Inflamm Regen. 2019. PMID: 30976362 Free PMC article. Review.
-
Ontogenic timing, T cell receptor signal strength, and Notch signaling direct γδ T cell functional differentiation in vivo.Cell Rep. 2021 Jun 8;35(10):109227. doi: 10.1016/j.celrep.2021.109227. Cell Rep. 2021. PMID: 34107257 Free PMC article.
References
-
- Isailovic N, Daigo K, Mantovani A, Selmi C (2015) Interleukin‐17 and innate immunity in infections and chronic inflammation. J Autoimmun 60: 1–11 - PubMed
-
- Bettelli E, Carrier Y, Gao W, Korn T, Strom TB, Oukka M, Weiner HL, Kuchroo VK (2006) Reciprocal developmental pathways for the generation of pathogenic effector TH17 and regulatory T cells. Nature 441: 235–238 - PubMed
-
- Ivanov II, McKenzie BS, Zhou L, Tadokoro CE, Lepelley A, Lafaille JJ, Cua DJ, Littman DR (2006) The orphan nuclear receptor RORgammat directs the differentiation program of proinflammatory IL‐17+ T helper cells. Cell 126: 1121–1133 - PubMed
-
- Veldhoen M, Hocking RJ, Atkins CJ, Locksley RM, Stockinger B (2006) TGFbeta in the context of an inflammatory cytokine milieu supports de novo differentiation of IL‐17‐producing T cells. Immunity 24: 179–189 - PubMed
Publication types
MeSH terms
Substances
Grants and funding
LinkOut - more resources
Full Text Sources
Other Literature Sources

