. 2017 Sep 19;114(38):E8053-E8061.
doi: 10.1073/pnas.1703331114. Epub 2017 Aug 30.

Methylation-dependent DNA discrimination in natural transformation of Campylobacter jejuni

Affiliations

Methylation-dependent DNA discrimination in natural transformation of Campylobacter jejuni

Jessica M Beauchamp et al. Proc Natl Acad Sci U S A. .

Abstract

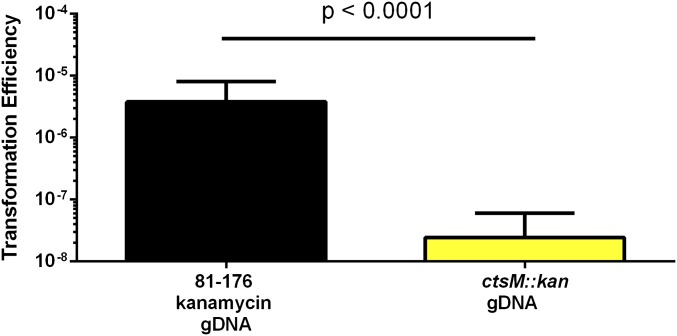
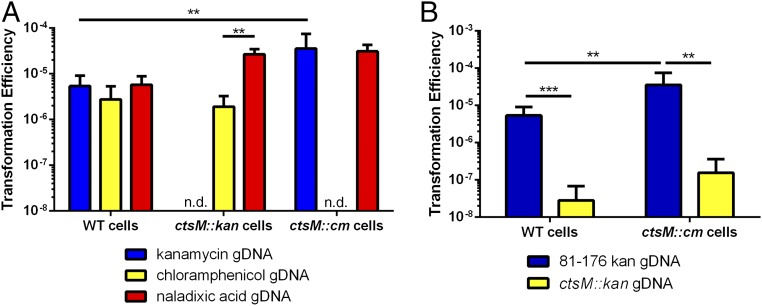
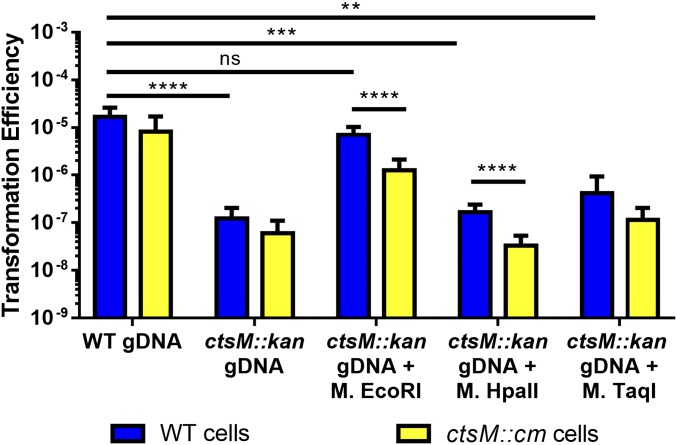
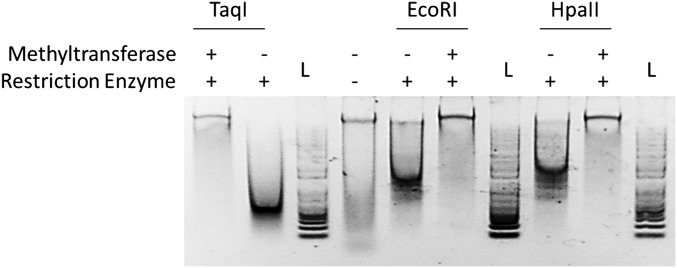
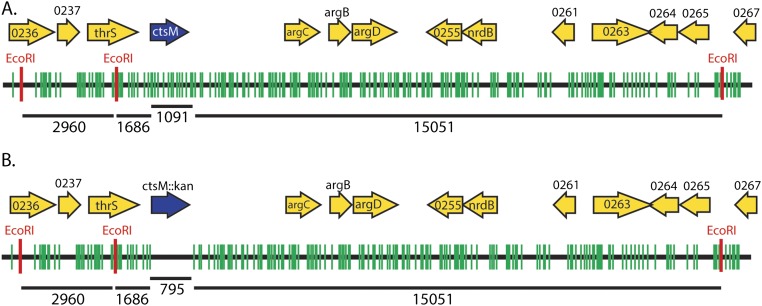
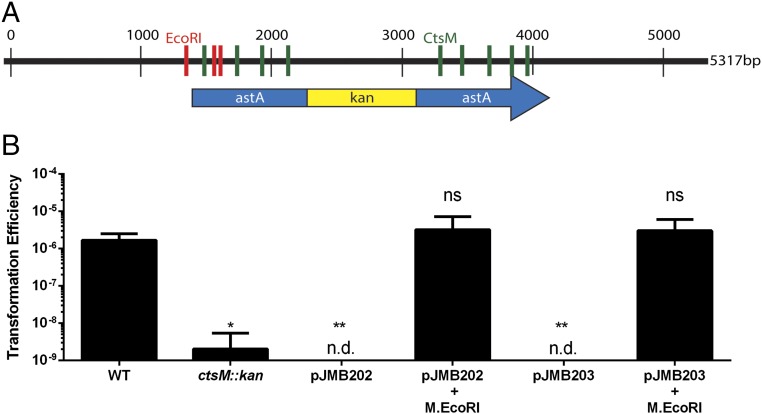
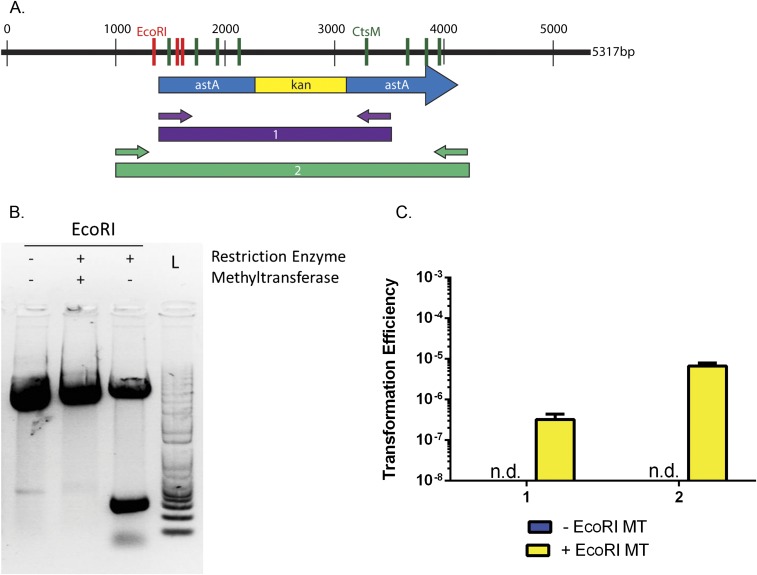
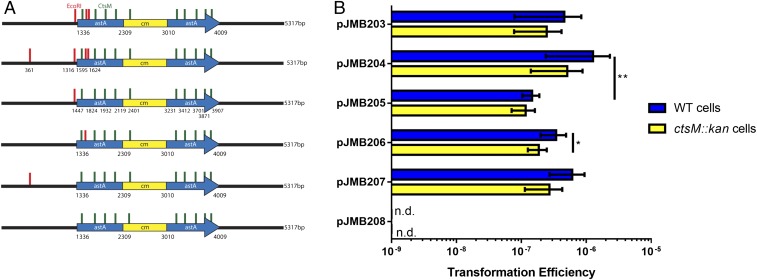
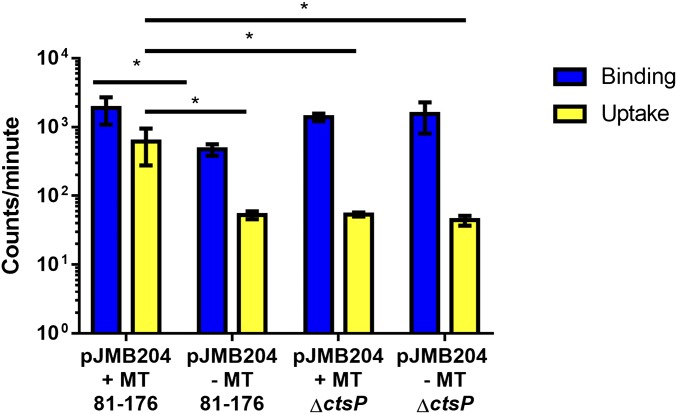
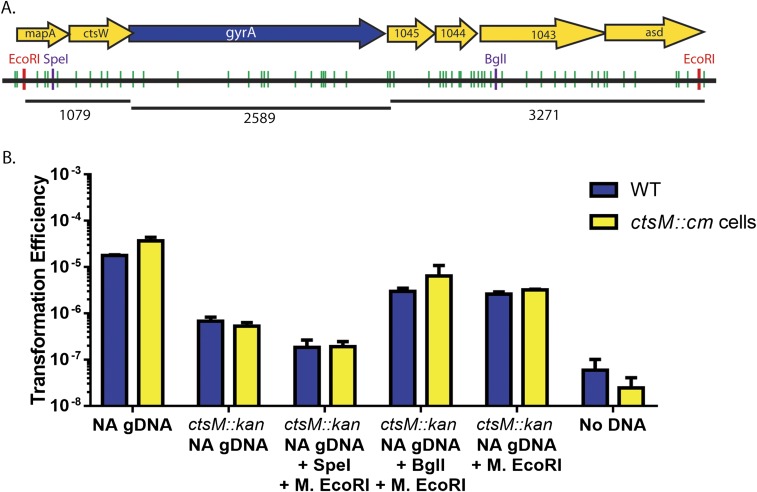
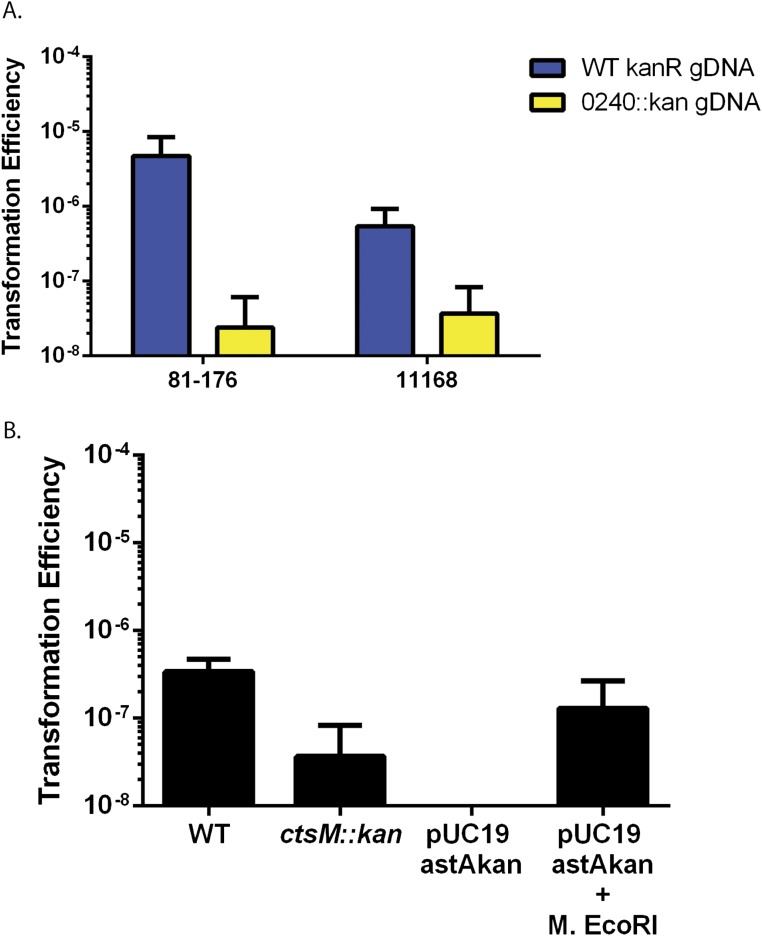
Campylobacter jejuni, a leading cause of bacterial gastroenteritis, is naturally competent. Like many competent organisms, C. jejuni restricts the DNA that can be used for transformation to minimize undesirable changes in the chromosome. Although C. jejuni can be transformed by C. jejuni-derived DNA, it is poorly transformed by the same DNA propagated in Escherichia coli or produced with PCR. Our work indicates that methylation plays an important role in marking DNA for transformation. We have identified a highly conserved DNA methyltransferase, which we term Campylobacter transformation system methyltransferase (ctsM), which methylates an overrepresented 6-bp sequence in the chromosome. DNA derived from a ctsM mutant transforms C. jejuni significantly less well than DNA derived from ctsM+ (parental) cells. The ctsM mutation itself does not affect transformation efficiency when parental DNA is used, suggesting that CtsM is important for marking transforming DNA, but not for transformation itself. The mutant has no growth defect, arguing against ongoing restriction of its own DNA. We further show that E. coli plasmid and PCR-derived DNA can efficiently transform C. jejuni when only a subset of the CtsM sites are methylated in vitro. A single methylation event 1 kb upstream of the DNA involved in homologous recombination is sufficient to transform C. jejuni, whereas otherwise identical unmethylated DNA is not. Methylation influences DNA uptake, with a slight effect also seen on DNA binding. This mechanism of DNA discrimination in C. jejuni is distinct from the DNA discrimination described in other competent bacteria.

Keywords: Campylobacter jejuni; DNA discrimination; DNA methyltransferase; competence; natural transformation.


Conflict of interest statement

The authors declare no conflict of interest.

Figures

Fig. 1.
Fig. 1.
Distribution of all possible methylation motifs in 81–176. CtsM (RAATTY) sites are indicated in green. For comparison (in order toward the center), EcoRI (GAATTC) sites are in red, M.CjeFIII (GCAAGG) sites are in black, M.CjeFII (CAAYN6ACT) sites are in dark blue, M.CjeFIV (TAAYN5TGC) sites are in light blue, and M.CjeFV (GGRCA) sites are in fuschia. The chromosome is in black. Small black boxes indicate the ribosomal gene clusters.
Fig. 2.
Fig. 2.
DNA from ctsM::kan is degraded by ApoI and EcoRI. gDNA was purified from either WT C. jejuni strain DRH153 (kanR) or ctsM::kan mutants. The DNA was then either mock-digested (lanes 1 and 2) or digested (lanes 3 and 4) with the restriction enzymes EcoRI (Left) or ApoI (Right). The DNA was then electrophoresed on an agarose gel and visualized using ethidium bromide. ApoI (RAATTY) should cut approximately four times as frequently as EcoRI (GAATTC).
Fig. 3.
Fig. 3.
DNA lacking CtsM methylation is a poor substrate for transformation. DNA was purified from either DRH153 or the ctsM::kan mutant. This DNA was then used to transform WT cells. Transformation efficiency was calculated as described in Materials and Methods. Results are the compilation of three biological replicates, each of which included three technical replicates. Error bars indicate SD. Significance was determined using the Mann–Whitney U test.
Fig. 4.
Fig. 4.
ctsM mutants are transformed with WT frequency by WT gDNA, but not by their own gDNA. (A) WT DNA with varying antibiotic resistance [kanamycin (DRH153), chloramphenicol (DRH154), and naladixic acid (JMB202)] was purified and used to transform WT, ctsM::kan, and ctsM::cm cells. Transformation efficiency was calculated as described previously. n.d. indicates that transformation efficiency was not determined because the cells already contained the antibiotic resistance used to transform cells. (B) DRH154 cells or ctsM::cm cells were transformed with either WT kanR gDNA or DNA from the ctsM::kan gDNA, and transformation efficiency was measured as described previously. Data represent three biological replicates, each of which contained three technical replicates. Error bars indicate SD. **P < 0.01; ***P < 0.001, Mann–Whitney U test.
Fig. 5.
Fig. 5.
In vitro methylation at the CtsM site RAATTY, but not at other sites, significantly enhances gDNA substrate capability. DNA was purified from either DRH153 (kanr) or ctsM::kan cells. ctsM::kan DNA was then either mock-methylated or in vitro methylated with EcoRI MTase, TaqI MTase, or HpaII MTase. EcoRI MTase methylates GAm6ATTC, TaqI methylates TCG m6A, and HpaII methylates C m6CGG. WT cells (blue) or ctsM::cm cells (yellow) were transformed with the methylated DNA. Transformation efficiency was calculated as described previously. Data represent three biological replicates, each of which contained three technical replicates. Error bars indicate SD. *P < 0.05; **P < 0.01; ***P < 0.001; ****P < 0.0001, Kruskal–Wallis test with Dunn’s multiple-comparisons test. ns, not significant.
Fig. S1.
Fig. S1.
Digest of gDNA treated with methyltransferases. ctsM::kan gDNA was treated as indicated. The DNA was then electrophoresed on an agarose gel and visualized using Gel Red. L, marker ladder.
Fig. S2.
Fig. S2.
Chromosome location of ctsM with methylation RAATTY and GAATTC sites. (A) WT chromosome with RAATTY sites (green) and EcoRI sites (red) shown for DNA surrounding ctsM. ORFs are indicated by yellow arrows; those smaller than 200 aa are not shown. ctsM is shown in blue. Numbers under chromosomes indicate bases. (B) RAATTY sites and EcoRI sites in a ctsM::kan mutant.
Fig. 6.
Fig. 6.
In vitro methylation by M.EcoRI allows for transformation of plasmid DNA. (A) Plasmid map of pJMB202 with pertinent features denoted. KanR refers to a kanamycin resistance cassette. It is inserted in astA. Red lines indicate EcoRI sites (GAATTC) that are methylated by M.EcoRI. Green lines indicate CtsM sites (RAATTY) that cannot be methylated by M.EcoRI. (B) WT cells were transformed with various types of DNA as indicated. These DNA fragments were then used to transform WT cells. Transformation efficiency was calculated as described previously. The data represent three biological replicates, each of which contained three technical replicates. n.d. indicates that colonies were not detected. Error bars indicate SD. *P < 0.001; **P < 0.001, one-way ANOVA with Tukey’s posttest. ns, not significant.
Fig. S3.
Fig. S3.
Digests of plasmids treated with M. EcoRI and PCR transformation data. (A) Diagram of pJMB202 and PCR products generated from this plasmid. GAATTC (M.EcoRI sites) are shown in red, and other RAATTY sites are shown in green. Small arrows indicate primers. (B) pJMB202 was treated as indicated. DNA was then electrophoresed and visualized using Gel Red. (C) PCR fragments derived from pJMB202 as indicated in A were methylated in vitro using M.EcoRI. ctsM+ cells were then transformed with DNA that either had not been methylated (blue) or had been methylated (yellow). Transformation efficiency was calculated as described in Materials and Methods. The dashed line indicates the limit of detection. n.d. indicates that colonies were not detected. Error bars indicate SD.
Fig. 7.
Fig. 7.
One methylated EcoRI site is sufficient for transformation. (A) Diagram of the plasmids used. EcoRI sites (GAATTC) are in red, and CtsM sites (RAATTY) that are not methylated by M.EcoRI are shown in green. The exact sites of the EcoRI sites are indicated for pJMB204. The plasmids are identical except for the location and number of EcoRI sites. The plasmid backbone is indicated in black, and regions homologous to C. jejuni are indicated in blue. The antibiotic cassette is in yellow. (B) WT cells (blue) or ctsM::kan cells (yellow) were transformed with different plasmids as indicated, and transformation efficiency was measured as before. n.d. indicates that colonies were not detected. Error bars indicate SD. *P < 0.01; **P < 0.01, Kruskal–Wallis test with Dunn’s multiple-comparison posttest.
Fig. 8.
Fig. 8.
Methylated RAATTY promotes DNA uptake. DRH212 cells were incubated with radiolabled pJMB204 that had been methylated with M.EcoRI (+MT) or mock-methylated (−MT) for 1 h. The methyltransferase experiments were initiated with 5 ng/µL of DNA. Cells were centrifuged, washed, split, and either mock-treated or treated with DNase. Mock-treated cells contain the bound DNA (blue), and DNase-treated cells contain DNA that has been transported into the cells (yellow); 100 ng of DNA was used in each experiment. After treatment, cells were washed and resuspended in scintillation fluid. Total cpm was measured using a scintillation counter. Data are representative of the experiment repeated three times. Error bars indicate SD of three technical replicates. *P < 0.05, two-way ANOVA and Tukey’s posttest.
Fig. S4.
Fig. S4.
Sites 3.2 kb away from an antibiotic cassette are not sufficient for transformation. (A) Chromosome locations of GAATTC and RAATTY sites at gyrA. WT chromosome with RAATTY sites (green) and EcoRI sites (red) shown for DNA surrounding ctsM. ORFs are indicated by yellow arrows; those smaller than 200 aa are not shown. gyrA is shown in blue. Numbers under chromosomes indicate bases. SpeI and BglI sites are indicated in purple. A point mutation in gyrA confers naladixic acid (NA) resistance. (B) gDNA was purified from either WT NAR cells or ctsM::kan NAR cells. The DNA was then digested with either SpeI or BglI and in vitro methylated with M.EcoRI. The treated DNA was used to transform WT (blue) or ctsM::kan (yellow) cells. Transformation efficiency was measured as described in Materials and Methods. Error bars indicate SD. Data are the results of three biological replicates.
Fig. S5.
Fig. S5.
Transformation efficiencies of 11168. (A) 11168 and 81–176 were transformed with gDNA derived from WT 81–176 or 81–176 ctsM::kan. (B) 11168 was transformed by the indicated DNA. WT and ctsM::kan are from 81–176. Transformation efficiency was calculated as before. Error bars indicate SD.

References

    1. Johnsborg O, Eldholm V, Håvarstein LS. Natural genetic transformation: Prevalence, mechanisms and function. Res Microbiol. 2007;158:767–778. - PubMed
    1. Guschinskaya N, et al. Random mutagenesis of the hyperthermophilic archaeon Pyrococcus furiosus using in vitro mariner transposition and natural transformation. Sci Rep. 2016;6:36711. - PMC - PubMed
    1. Young KT, Davis LM, Dirita VJ. Campylobacter jejuni: Molecular biology and pathogenesis. Nat Rev Microbiol. 2007;5:665–679. - PubMed
    1. de Boer P, et al. Generation of Campylobacter jejuni genetic diversity in vivo. Mol Microbiol. 2002;44:351–359. - PubMed
    1. Wassenaar TM, Fry BN, van der Zeijst BA. Genetic manipulation of Campylobacter: Evaluation of natural transformation and electro-transformation. Gene. 1993;132:131–135. - PubMed

Publication types

MeSH terms