. 2017 Aug 30;8(1):328.
doi: 10.1038/s41467-017-00322-z.

Nucleolar expansion and elevated protein translation in premature aging

Affiliations

Nucleolar expansion and elevated protein translation in premature aging

Abigail Buchwalter et al. Nat Commun. .

Abstract

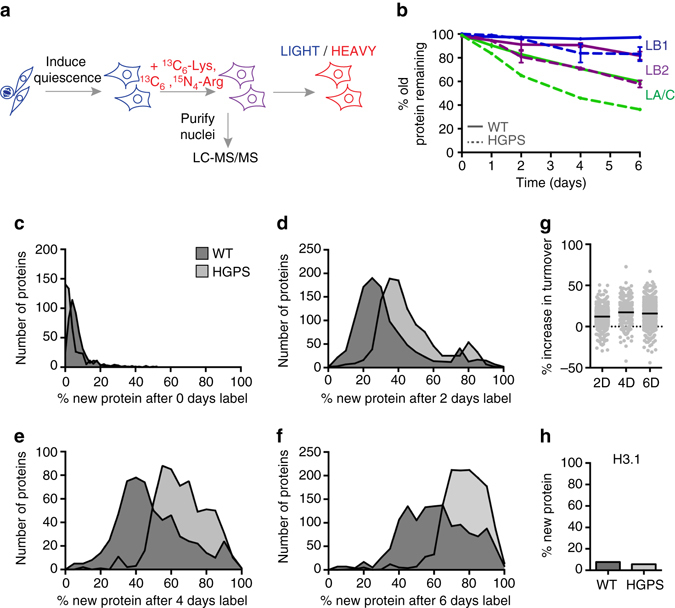
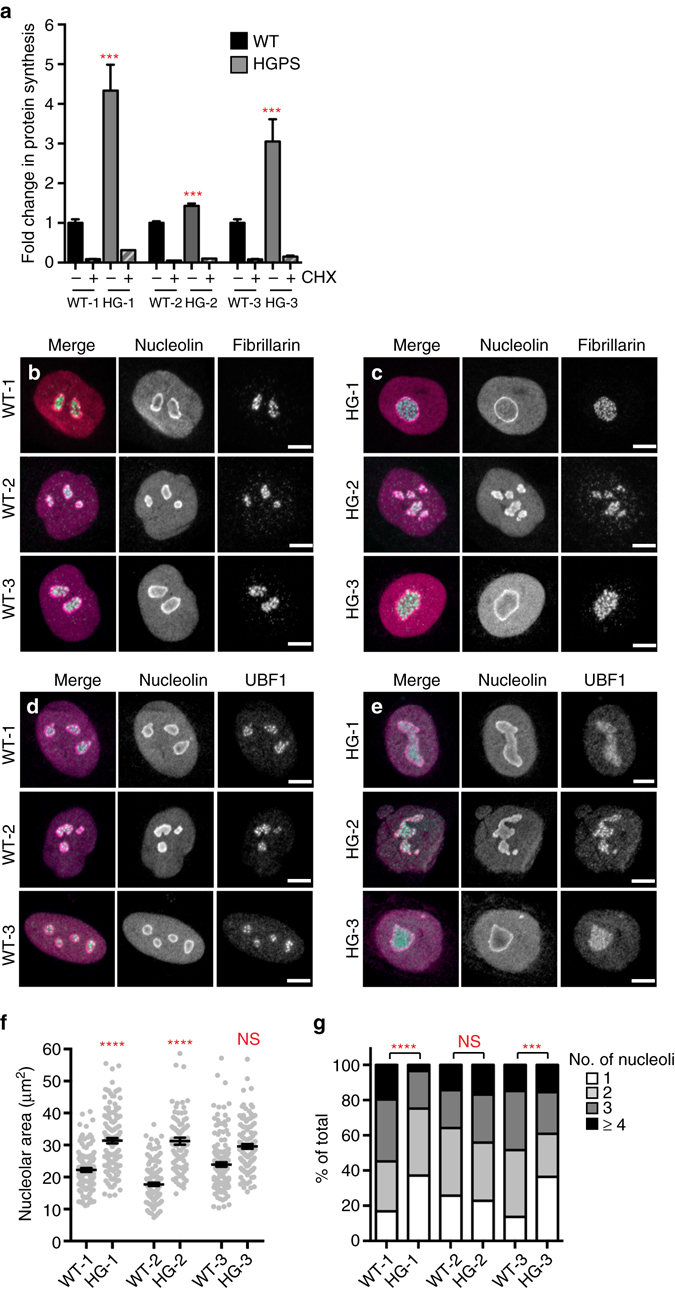
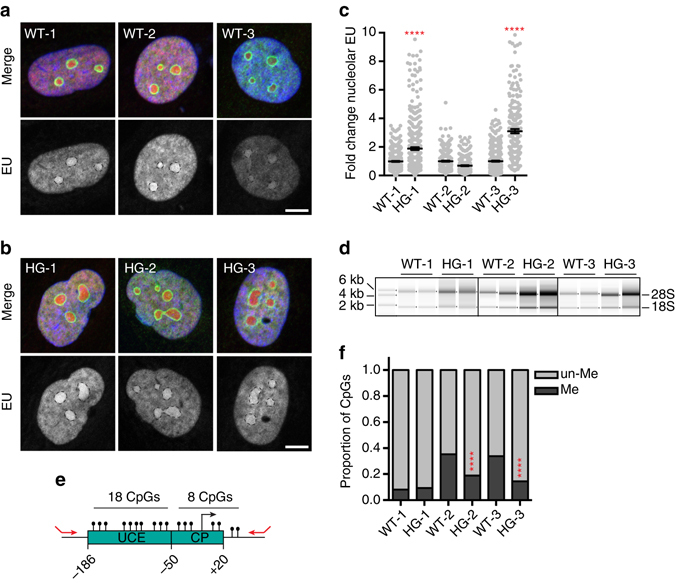
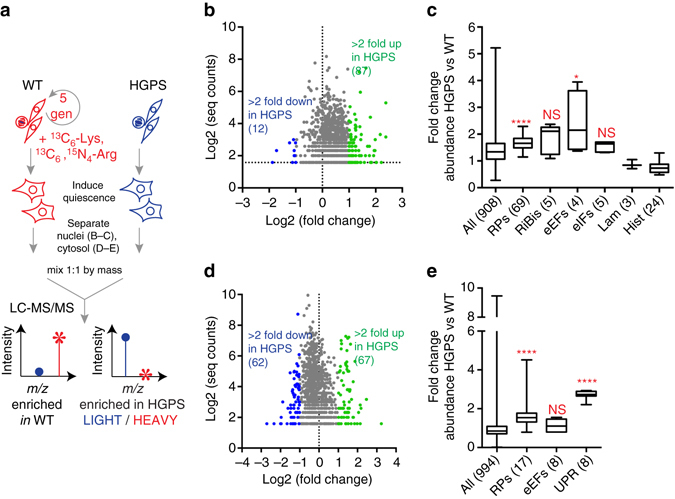
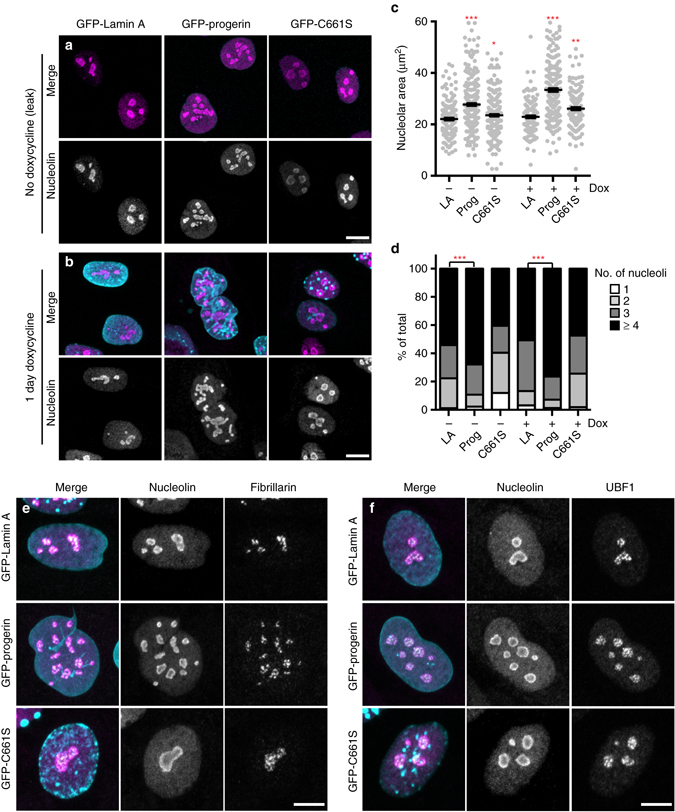
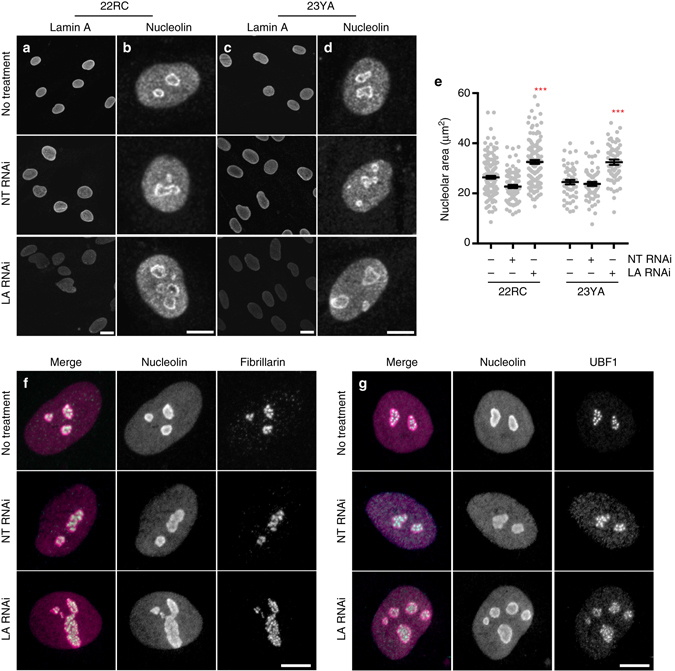
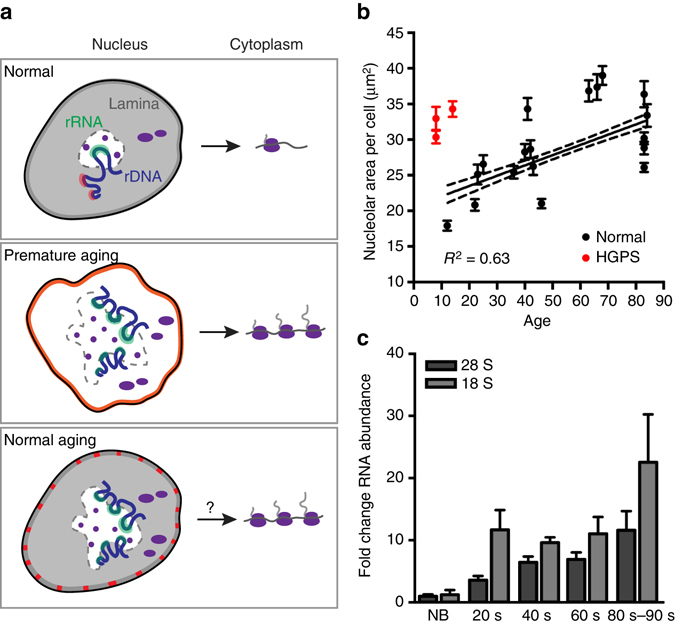
Premature aging disorders provide an opportunity to study the mechanisms that drive aging. In Hutchinson-Gilford progeria syndrome (HGPS), a mutant form of the nuclear scaffold protein lamin A distorts nuclei and sequesters nuclear proteins. We sought to investigate protein homeostasis in this disease. Here, we report a widespread increase in protein turnover in HGPS-derived cells compared to normal cells. We determine that global protein synthesis is elevated as a consequence of activated nucleoli and enhanced ribosome biogenesis in HGPS-derived fibroblasts. Depleting normal lamin A or inducing mutant lamin A expression are each sufficient to drive nucleolar expansion. We further show that nucleolar size correlates with donor age in primary fibroblasts derived from healthy individuals and that ribosomal RNA production increases with age, indicating that nucleolar size and activity can serve as aging biomarkers. While limiting ribosome biogenesis extends lifespan in several systems, we show that increased ribosome biogenesis and activity are a hallmark of premature aging.HGPS is a premature aging disease caused by mutations in the nuclear protein lamin A. Here, the authors show that cells from patients with HGPS have expanded nucleoli and increased protein synthesis, and report that nucleoli also expand as aging progresses in cells derived from healthy individuals.


Conflict of interest statement

The authors declare no competing financial interests.

Figures

Fig. 1
Fig. 1
SILAC analysis of protein stability in HGPS. a Overview of SILAC experiment strategy in quiescent fibroblasts. Sub-confluent fibroblast cultures were cultured in low serum to induce quiescence for 3 days before initiating a 6-day 13C6-Lys, 13C6 / 15N4-Arg pulse-labeling timecourse. b Extent of lamin protein turnover quantified by % 12C6-Lys, 12C6 / 14N4-Arg-labeled proteins remaining (“old”) in WT cells (solid lines) and HGPS cells (dashed lines). LA/C, Lamin A/C; LB1, Lamin B1; LB2, Lamin B2. Mean ± SEM of all detected peptides shown. Peptide coverage was as follows: WT, LA/C 0D, n = 262; LA/C 1D, n = 41; LA/C 2D, n = 245; LA/C 4D, n = 140; LA/C 6D, n = 294. LB1 0D, n = 52; LB1 2D, n = 29; LB1 4D, n = 8; LB1 6D, n = 22. LB2 0D, n = 59; LB2 2D, n = 21; LB2 4D, n = 8; LB2 6D, n = 25. HGPS, LA/C 0D, n = 16; 1D, n = 114; 2D, n = 234; 4D, n = 80; 6D, n = 239. LB1 0D, n = 2; 1D, n = 7; 2D, n = 21; 4D, n = 6; 6D, n = 14. LB2 0D, n = 2; 1D, n = 9; 2D, n = 17; 4D, n = 1; 6D, n = 22. cf Extent of protein turnover quantified by %protein labeled with 13C6-Lys and 13C6,15N4-Arg (“new”) after no label (c, 473 proteins); 2 days label (d, 1102 proteins), 4 days label (e, 603 proteins), or 6 days label (f, 1343 proteins). Turnover values were plotted for proteins detected by LC-MS/MS in both wild type (AG3258) and HGPS (AG11498) cells with at least two peptides at each time point shown. Distributions were significantly different at each time point (p < 0.0001); significance determined by unpaired t-test with Welch’s correction. g %increase in protein turnover in HGPS cells proteome-wide after 2 days labeling (median increase 12.1%), 4 days labeling (median increase 17.3%), or 6 days labeling (median increase 15.8%). Black bars indicate median. h %new Histone H3.1 detected after 2 days labeling in WT and HGPS cells based on the single tryptic peptide unique to H3.1. See also Supplementary Data 1
Fig. 2
Fig. 2
Global translation is increased and nucleoli are enlarged in HGPS. a Analysis of global translation rates by 35S-Met/Cys incorporation in WT and HGPS fibroblasts in the absence or presence of cycloheximide (CHX). Mean ± SEM of four independent experiments shown, each containing two technical replicates. *** indicates p < 0.001 by t-test. be Immunofluorescence of nucleolar proteins nucleolin (magenta) and fibrillarin (cyan) b, c or UBF1 (cyan) d, e in WT b, d) and HGPS c, e fibroblasts. Scale bar, 10 μm. f Total nucleolar cross-sectional area per cell, determined by boundaries of nucleolin immunofluorescence. **** indicates p < 0.0001 by t-test. Bars indicate mean ± SEM. g Number of nucleoli per cell. Significance determined by χ 2-test of indicated samples. f, g N > 111 cells per condition from six independent experiments with two technical replicates
Fig. 3
Fig. 3
Increased rDNA transcription in HGPS. a, b Visualization of rRNA synthesis by a 4-h pulse of EU labeling (magenta) followed by immunostaining for nucleolin (cyan) in WT a or HGPS b fibroblasts. Scale bar, 10 μm. c Quantification of EU fluorescence intensity per nucleolus. **** indicates p < 0.0001 determined by t-test. N > 142 nucleoli analyzed per condition in two independent experiments with two technical replicates. Black bars indicate mean ± SEM. d Total RNA extracted from equal numbers of WT and HGPS fibroblasts. In all, 28 S (5 kb) and 18 S (1.9 kb) rRNAs are indicated. Representative images from one of three independent experiments shown. e Schematic map of the rDNA promoter. UCE, upstream control element; CP, core promoter. Black knobs, CpG methylation. In all, 18 CpGs in the UCE and 8 CpGs in the CP were analyzed. Red arrows indicate primers used for bisulfite sequencing. f Quantification of total CpG promoter methylation on rDNA promoters in WT and HGPS fibroblasts. See also Table 1. In 2 of 3 pairs, methylation is significantly decreased in HGPS (****, p < 0.0001, determined by χ 2-test). N > 270 CpGs analyzed per condition in two independent experiments
Fig. 4
Fig. 4
Elevated production of ribosomal proteins in HGPS. a Overview of SILAC abundance analysis strategy. Proliferating WT fibroblasts were cultured for five generations in media containing stable heavy isotopes to completely label cellular proteins. Parallel cultures of HGPS fibroblasts were expanded in normal media. Quiescence was induced; crude nuclear and cytosolic fractions were prepared, and equal masses of fractions were mixed and analyzed by LC-MS/MS. b, d Number of peptides detected vs. fold change in abundance on a logarithmic scale for b 908 proteins identified in nuclei and d 994 proteins identified in cytosol prepared from SILAC-labeled wild type (AG3258) and HGPS (AG11498) cells. c, e) Analysis of relative c nuclear and e cytosolic protein abundance by functional class. Subunits of the small and large ribosome (RPs); ribosome biogenesis proteins (RiBis); translation elongation factors (eEFs); translation initiation factors (eIFs); lamins (lam); histones (hist); UPR target genes (UPR). Boxes indicate 25th–75th percentile, lines indicate median values, and bars indicate range of values. Significance determined by Mann–Whitney U-test. See also Supplementary Data 2
Fig. 5
Fig. 5
Progerin expression drives nucleolar expansion. a, b Human fibroblasts expressing GFP-tagged lamin A, progerin, or progerin C661S (cyan) under a doxycycline-inducible promoter stained for nucleolin (magenta) either in absence of doxycycline a or after 1-day treatment with doxycycline b. Scale bar = 10 μm. c Total nucleolar area per cell, determined by boundaries of nucleolin immunofluorescence. Significance determined by t-test. Black bars indicate mean ± SEM. d Number of nucleoli per cell. c, d N > 70 cells per condition from three independent experiments with two technical replicates. Significance determined by χ 2-test. e, f Staining for nucleolin (magenta) and fibrillarin (gray) e or UBF1 (gray) f in cells expressing the indicated GFP-tagged lamin proteins (cyan) after 1 day of doxycycline induction. Scale bar = 10 μm
Fig. 6
Fig. 6
Lamin A depletion drives nucleolar expansion. ae Normal human fibroblasts (22RC and 23YA) transfected as indicated with non-targeting (NT) or Lamin A/C-targeting (LA) RNAi for 72 h before staining for Lamin A/C a, c or nucleolin b, d. Scale bar = 20 μm a, c; 10 μm b, d. e Total nucleolar area per cell, determined by boundaries of nucleolin immunofluorescence. Significance determined by t-test. Black bars indicate mean ± SEM for N > 52 cells per condition from two independent experiments with two technical replicates. f, g Normal human fibroblasts (22RC) transfected as indicated with NT or LA RNAi for 72 h before staining for nucleolin (magenta) and fibrillarin (cyan) f or UBF1 (cyan) g. Scale bar = 10 μm
Fig. 7
Fig. 7
Nucleolar size and rRNA production increase during normal aging. a Total nucleolar area per cell, determined by boundaries of nucleolin immunofluorescence, in cells from healthy individuals of varying ages (black) or cells from HGPS patients (red). Dots and bars indicate mean ± SEM for N > 34 cells per condition from 1–2 independent experiments with two technical replicates. Pearson correlation coefficient 0.6, p < 0.005. See also Supplementary Fig. 11 and Supplementary Table 4. b Abundance of 28 S and 18 S rRNAs determined by qPCR in 2–3 samples each from healthy individuals of varying ages. Normalized to GAPDH mRNA. NB, newborn. Bars, SEM. Representative data from 1 of 2 independent experiments shown. See also Supplementary Fig. 12 and Supplementary Table 5. c Model. In normal cells (top panel), the nucleoplasmic lamin network represses nucleolar activity. In HGPS (middle panel), the nucleoplasmic lamin network is lost. Loss of rDNA repression leads to elevated rRNA transcription, enlarged nucleoli, increased expression of ribosomal proteins, and increased translation output. In normal aging (bottom panel), progerin is sporadically expressed and incorporates into the lamina (red). Nucleoli expand, produce more rRNA, and possibly produce more translating ribosomes

Comment in

  • Ageing: Live longer with small nucleoli.
    Zlotorynski E. Zlotorynski E. Nat Rev Mol Cell Biol. 2017 Nov;18(11):651. doi: 10.1038/nrm.2017.100. Epub 2017 Sep 27. Nat Rev Mol Cell Biol. 2017. PMID: 28951566 No abstract available.

References

    1. Eriksson M, et al. Recurrent de novo point mutations in lamin A cause Hutchinson–Gilford progeria syndrome. Nature. 2003;423:293–298. doi: 10.1038/nature01629. - DOI - PMC - PubMed
    1. Gordon LB, Rothman FG, López-Otín C, Misteli T. Progeria: a paradigm for translational medicine. Cell. 2014;156:400–407. doi: 10.1016/j.cell.2013.12.028. - DOI - PMC - PubMed
    1. Burke B, Stewart CL. The nuclear lamins: flexibility in function. Nat. Rev. Mol. Cell Biol. 2013;14:13–24. doi: 10.1038/nrm3488. - DOI - PubMed
    1. Zullo JM, et al. DNA sequence-dependent compartmentalization and silencing of chromatin at the nuclear lamina. Cell. 2012;149:1474–1487. doi: 10.1016/j.cell.2012.04.035. - DOI - PubMed
    1. Gesson K, et al. A-type lamins bind both hetero- and euchromatin, the latter being regulated by lamina-associated polypeptide 2 alpha. Genome Res. 2016;26:462–473. doi: 10.1101/gr.196220.115. - DOI - PMC - PubMed

Publication types