. 2017 Aug 30;7(1):9995.
doi: 10.1038/s41598-017-10599-1.

Dysfunction of the circadian transcriptional factor CLOCK in mice resists chemical carcinogen-induced tumorigenesis

Affiliations

Dysfunction of the circadian transcriptional factor CLOCK in mice resists chemical carcinogen-induced tumorigenesis

Ken-Ichi Hashikawa et al. Sci Rep. .

Abstract

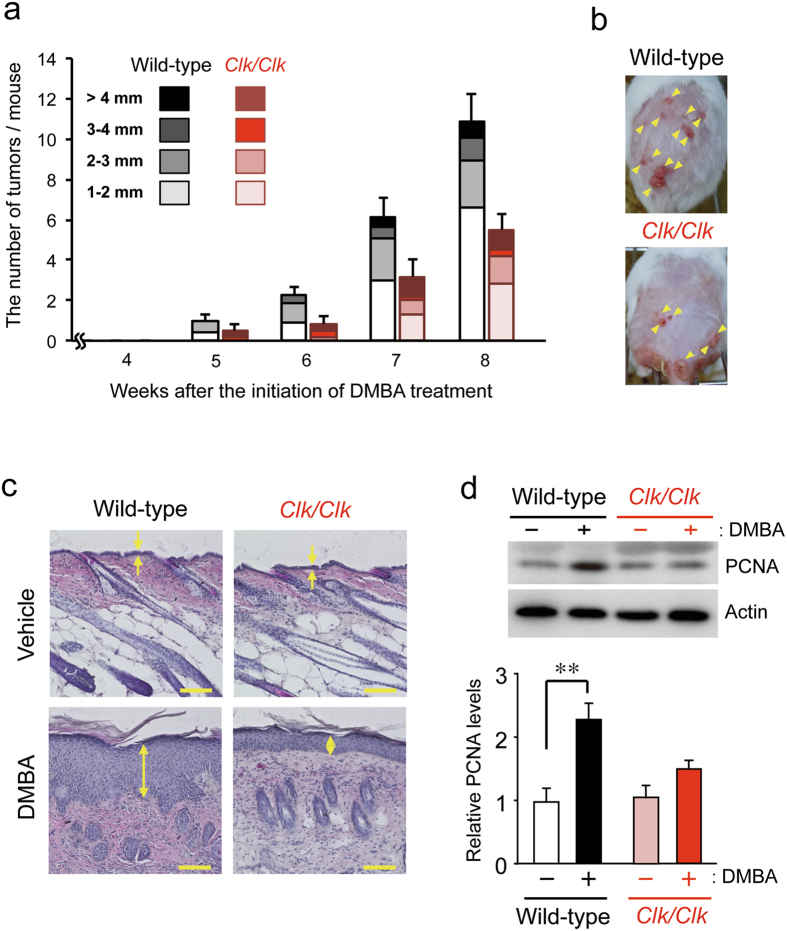
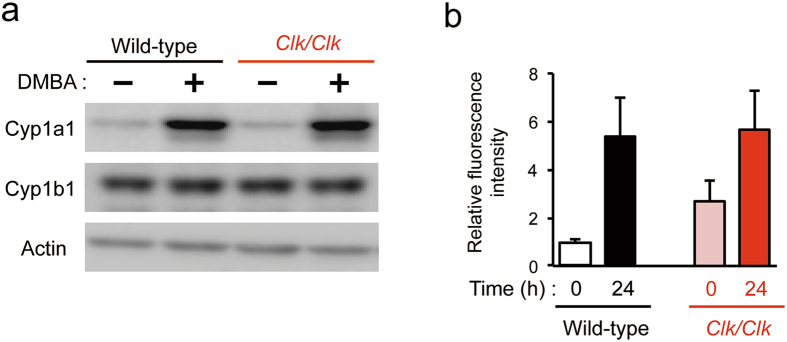
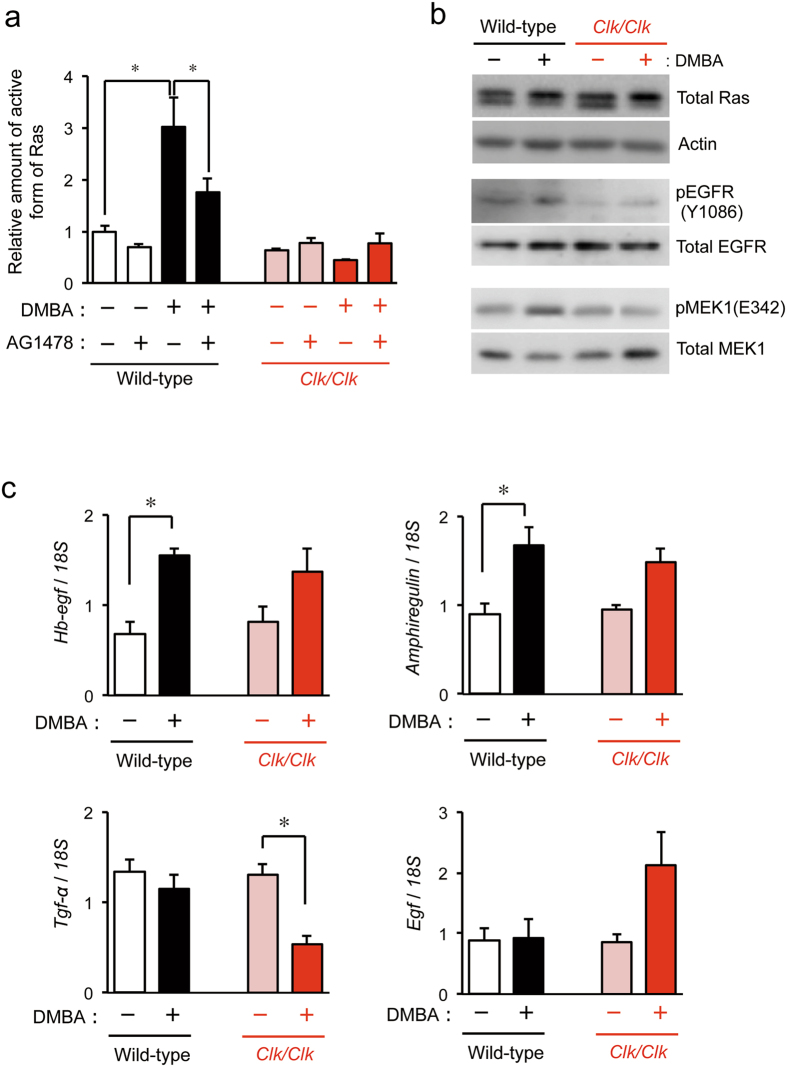
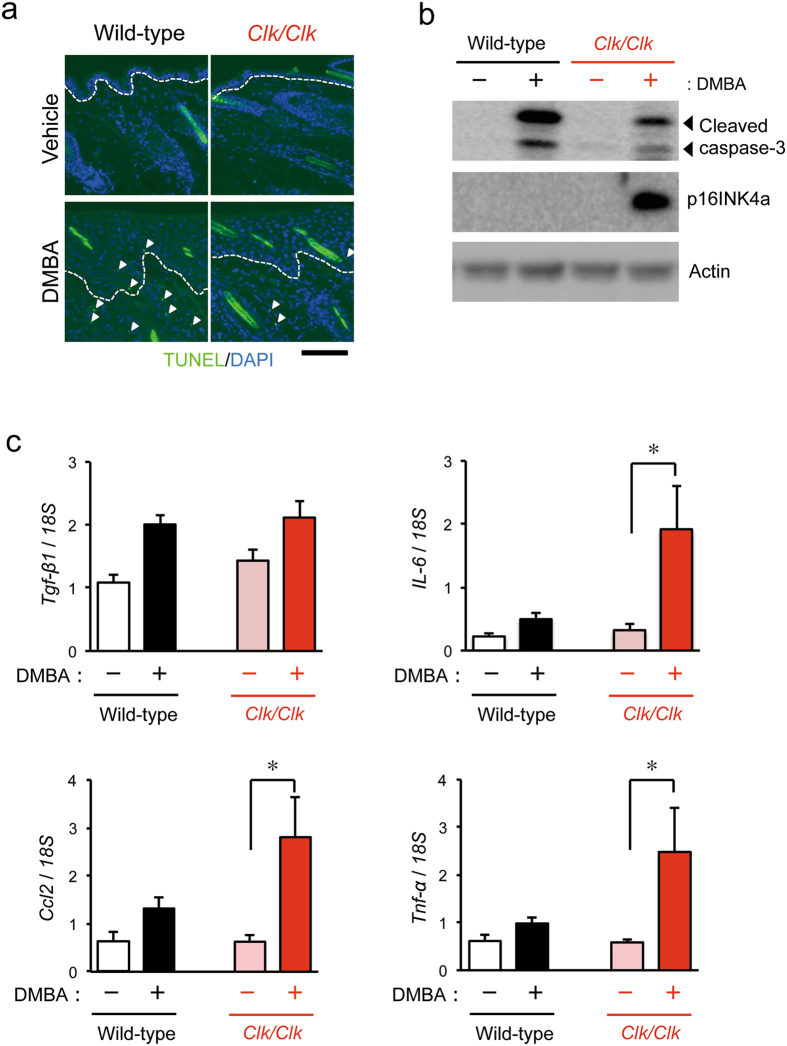
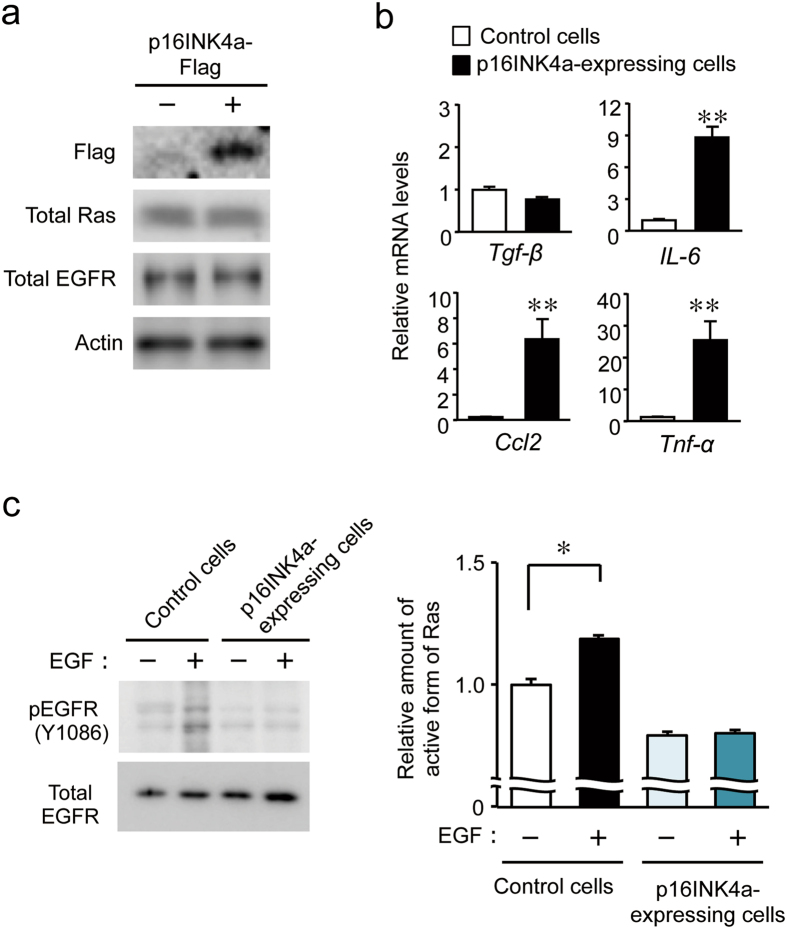
The chronic disruption of circadian rhythms has been implicated in the risk of cancer development in humans and laboratory animals. The gene product CLOCK is a core molecular component of the circadian oscillator, so that mice with a mutated Clock gene (Clk/Clk) exhibit abnormal rhythms in various physiological processes. However, we demonstrated here that Clk/Clk mice resisted chemical carcinogen-induced tumorigenesis by suppressing epidermal growth factor (EGF) receptor-mediated proliferation signals. The repetitive application of 7,12-dimethylbenz[α]anthracene (DMBA) to skin on the back resulted in the significant development of tumors in wild-type mice, whereas chemically-induced tumorigenesis was alleviated in Clk/Clk mice. Although the degree of DMBA-induced DNA damage was not significantly different between wild-type and Clk/Clk mice, EGF receptor-mediated Ras activation was not detected in DMBA-treated Clk/Clk mice. Genetic and biochemical experiments revealed that the suppression of EGF receptor-mediated signal transduction in DMBA-treated Clk/Clk mice was associated with the expression of the cellular senescence factor p16INK4a. These results suggest an uncovered role for CLOCK in the development of chemical carcinogen-induced primary tumors and offers new preventive strategies.


Conflict of interest statement

The authors declare that they have no competing interests.

Figures

Figure 1
Figure 1
Comparison of DMBA-induced skin tumorigenesis between wild-type and Clk/Clk mice. Animals were treated with 100 μg DMBA twice a week. (a) Time course of DMBA-induced skin tumor formation in wild-type and Clk/Clk mice. Each column indicates the average number of tumors and their size distribution obtained from 6–12 mice per each group (means ± s.e.m.). Tumors with a diameter of more than 1 mm were counted every week. DMBA-induced tumorigenesis was significantly alleviated in Clk/Clk mice (F 1,16 = 6.302, P = 0.023; two-way repeated measures ANOVA). (b) Representative photographs of skin tumor formation in wild-type and Clk/Clk mice 8 weeks after initiation of the DMBA treatment. The yellow arrows indicate the formation of tumors. (c) Histological analysis of the dorsal skin of wild-type and Clk/Clk mice after the DMBA treatment. Mice were treated with DMBA or vehicle (200 μL acetone) for 2 weeks. Skin samples were stained with hematoxylin and eosin. Yellow arrows indicate the epidermis. Scale bar, 100 μm. Histological data were confirmed in more than three mice in each group. (d) The protein levels of proliferating cell nuclear antigen (PCNA) in the skin of wild-type and Clk/Clk mice 2 weeks after initiation of the DMBA treatment. Full-size images are presented in Supplementary Fig. 2. Values show the means ± s.e.m. (n = 3). **P < 0.01 significant difference between two groups (F 3,8 = 9.664, P = 0.005; ANOVA with Tukey-Kramer’s post-hoc test).
Figure 2
Figure 2
Induction of Cyp proteins and formation of DNA adducts in the skin of wild-type and Clk/Clk mice after the DMBA treatment. (a) Protein levels of Cyp1a1 and Cyp1b1 in the skin of wild-type and Clk/Clk mice after the DMBA treatment. Skin homogenates were prepared 12 hours after the treatment with 100 μg DMBA. Plus and minus indicate the treatment with DMBA and vehicle (200 μL acetone), respectively. Full-size images are presented in Supplementary Fig. 3. Western blotting data were confirmed in more than three mice in each group. (b) Amounts of DMBA-DNA adducts in the skin of wild-type and Clk/Clk mice. DMBA was applied twice at 8-hour intervals. DNA was extracted from the skin of mice at 0 or 24 hours after the second DMBA treatment. The fluorescence intensity derived from DMBA-DNA adducts was measured, and intensity was normalized by DNA contents in samples (Means ± s.e.m.; n = 3–4).
Figure 3
Figure 3
Biochemical analysis of cell proliferation signaling in the skin of wild-type and Clk/Clk mice after the DMBA treatment. DMBA (100 μg) or vehicle (200 μL acetone) was applied biweekly to the back skin of mice for 2 weeks. Plus and minus indicate the treatment with DMBA and vehicle, respectively. (a) Amount of the active form of Ras in the skin of wild-type and Clk/Clk mice 2 weeks after initiation of the DMBA treatment. AG1478 (100 μg) was applied to the dorsal skin of mice 3 hours before sampling. Values of absorbance at 450 nm were obtained and normalized by total protein levels (means ± s.e.m.; n = 5). *P < 0.05 significant difference between the two groups (F 7,23 = 11.945, P < 0.001; ANOVA with Tukey-Kramer’s post-hoc test). (b) The protein levels of all (active and inactive) forms of Ras, phosphorylated EGF receptor (pEGFR), and phosphorylated MEK1 (pMEK1) in the skin of wild-type and Clk/Clk mice 2 weeks after initiation of the DMBA treatment. Full-size images are presented in Supplementary Fig. 4. Western blotting data were confirmed in more than three mice in each group. (c) mRNA levels of endogenous ligands for the EGF receptor in the skin of wild-type and Clk/Clk mice after initiation of the DMBA treatment (Means ± s.e.m.; n = 5). *P < 0.05 significant difference between the two groups (F 3,16 = 5.986, P = 0.006 for Hb-egf, F 3,16 = 7.257, P = 0.003 for Amphiregulin, F 3,16 = 8.365, P = 0.001 for Tgf-α; ANOVA with Tukey-Kramer’s post-hoc test).
Figure 4
Figure 4
DMBA-induced apoptotic cell death and cellular senescence in the skin of wild-type and Clk/Clk mice. Animals were treated with 100 μg DMBA or vehicle (200 μL acetone) twice a week. (a) Immunofluorescence staining of apoptotic cells in the skin of wild-type and Clk/Clk mice 2 weeks after initiation of the DMBA treatment. Apoptotic cells were detected by the TUNEL assay (Green). DAPI was used to stain nuclei (Blue). White arrows indicate TUNEL-positive cells. Dashed lines denote the epidermis-dermis border. Scale bar, 100 μm. (b) The expression of cleaved caspase-3 and p16INK4a proteins in the skin of wild-type and Clk/Clk mice 2 weeks after initiation of the DMBA treatment. Plus and minus indicate the treatment with DMBA and vehicle (200 μL acetone), respectively. Full-size images are presented in Supplementary Fig. 5. Data shown in panel a and b were confirmed in more than three mice in each group. (c) mRNA levels of inflammatory cytokines in the skin of wild-type and Clk/Clk mice 2 weeks after initiation of the DMBA treatment. (Means ± s.e.m.; n = 5). *P < 0.05 significant difference between the two groups (F 3,14 = 6.412, P = 0.006 for IL-6, F 3,16 = 5.211, P = 0.011 for Ccl2, F 3,16 = 3.682, P = 0.034 for Tnf-α; ANOVA with Tukey-Kramer’s post-hoc test). Plus and minus indicate the treatment with DMBA and vehicle (200 μL acetone), respectively.
Figure 5
Figure 5
Effects of p16INK4a on EGF receptor-mediated Ras activation in human keratinocytes. HaCaT cells were infected with retroviral vectors expressing Flag-tagged p16INK4a. (a) Protein levels of Flag-tagged p16INK4a, total Ras, and EGF receptor in HaCaT cells. Plus and minus indicate the infection with p16INK4a-Flag expressing vectors. Full-size images are presented in Supplementary Fig. 6. Data shown were confirmed in more than three independent experiments. (b) mRNA levels of inflammatory cytokines in cells infected or not infected with the p16INK4a-Flag expressing vectors. (Means ± s.e.m.; n = 6). **P < 0.01 significant difference control cells (t 10 = −8.393, P < 0.001 for IL-6, t 10 = −4.161, P = 0.002 for Ccl2, t 10 = −3.975, P = 0.034 for Tnf-α; unpaired t-test, two-sided). (c) Protein levels of phosphorylated EGFR (right) and the amount of the active form of Ras (left) in cells infected or not infected with the p16INK4a-Flag expressing vectors. For right panel, western blotting data were confirmed in three mice in each group. Full-size images are presented in Supplementary Fig. 7. For left panel, cells were incubated in serum-starved media for 24 hours and then stimulated with 200 ng/ml of EGF for 1 minute. Plus and minus indicate the introduction of the p16INK4a-Flag vector and the EGF treatment, respectively. Values of absorbance at 450 nm were obtained and normalized by total protein levels (Means ± s.e.m.; n = 4). *P < 0.05 significant difference between the two groups (F 3,12 = 29.245, P < 0.001; ANOVA with Tukey-Kramer’s post-hoc test).

References

    1. Gekakis N, et al. Role of the CLOCK protein in the mammalian circadian mechanism. Science. 1998;280:1564–1569. doi: 10.1126/science.280.5369.1564. - DOI - PubMed
    1. Darlington TK, et al. Closing the circadian loop: CLOCK-induced transcription of its own inhibitors per and tim. Science. 1998;280:1599–1603. doi: 10.1126/science.280.5369.1599. - DOI - PubMed
    1. Kume K, et al. mCRY1 and mCRY2 are essential components of the negative limb of the circadian clock feedback loop. Cell. 1999;98:193–205. doi: 10.1016/S0092-8674(00)81014-4. - DOI - PubMed
    1. Jin X, et al. A molecular mechanism regulating rhythmic output from the suprachiasmatic circadian clock. Cell. 1999;96:57–68. doi: 10.1016/S0092-8674(00)80959-9. - DOI - PubMed
    1. Cheng MY, et al. Prokineticin 2 transmits the behavioural circadian rhythm of the suprachiasmatic nucleus. Nature. 2002;417:405–410. doi: 10.1038/417405a. - DOI - PubMed

Publication types