. 2017 Aug 30;7(1):10097.
doi: 10.1038/s41598-017-10711-5.

Evolution of gut Bifidobacterium population in healthy Japanese infants over the first three years of life: a quantitative assessment

Affiliations

Evolution of gut Bifidobacterium population in healthy Japanese infants over the first three years of life: a quantitative assessment

Ravinder Nagpal et al. Sci Rep. .

Abstract

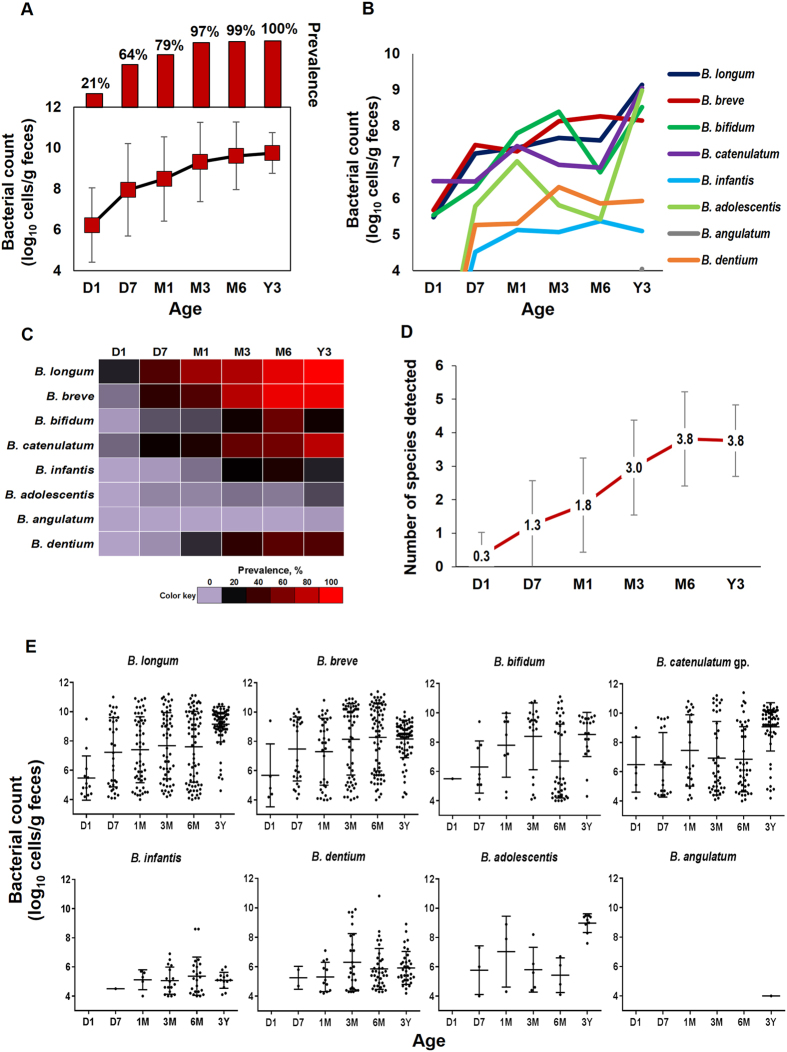
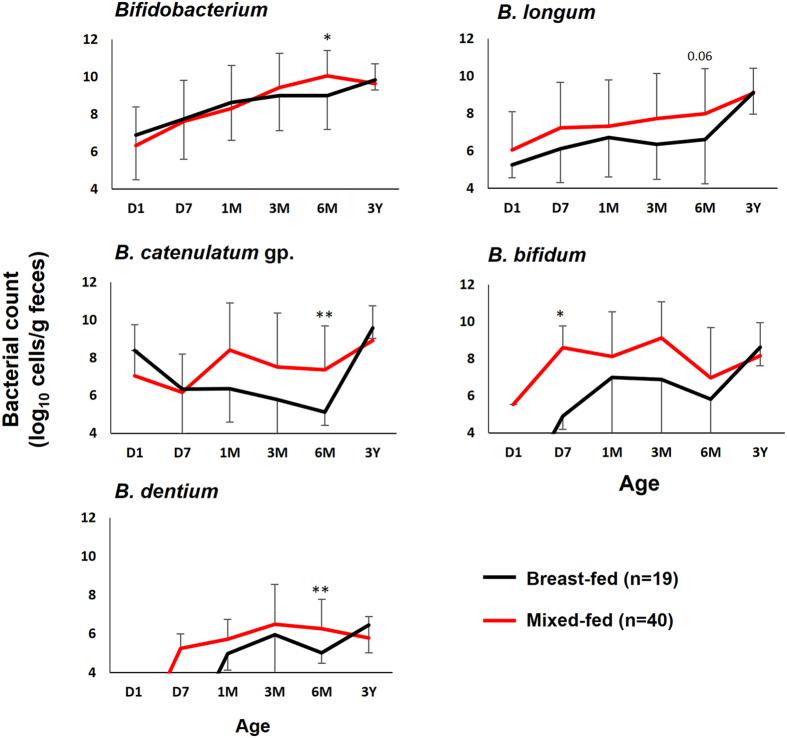
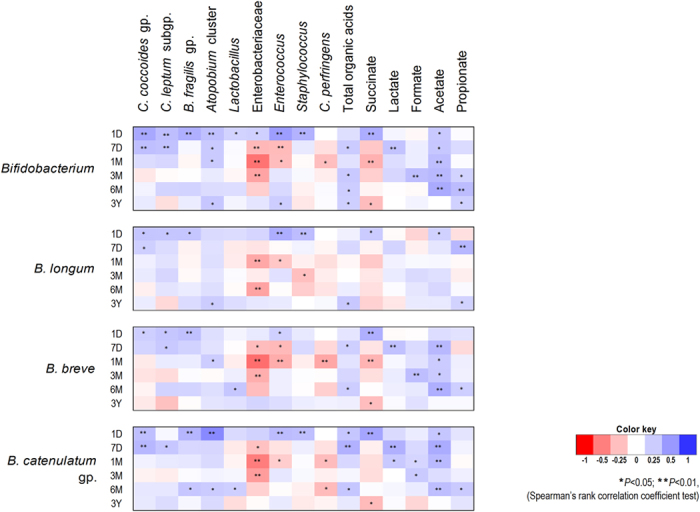
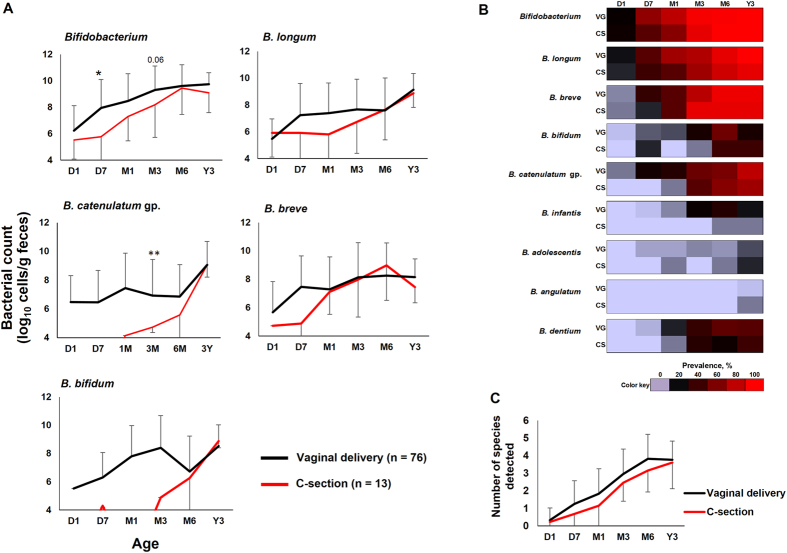
Bifidobacteria are important members of human gut microbiota; however, quantitative data on their early-life dynamics is limited. Here, using a sensitive reverse transcription-qPCR approach, we demonstrate the carriage of eight signature infant-associated Bifidobacterium species (B. longum, B. breve, B. bifidum, B. catenulatum group, B. infantis, B. adolescentis, B. angulatum and B. dentium) in 76 healthy full-term vaginally-born infants from first day to three years of life. About 21% babies carry bifidobacteria at first day of life (6.2 ± 1.9 log10 cells/g feces); and this carriage increases to 64% (8.0 ± 2.2), 79% (8.5 ± 2.1), 97% (9.3 ± 1.8), 99% (9.6 ± 1.6), and 100% (9.7 ± 0.9) at age 7 days, 1, 3 and 6 months, and 3 years, respectively. B. longum, B. breve, B. catenulatum group and B. bifidum are among the earliest and abundant bifidobacterial clades. Interestingly, infants starting formula-feed as early as first week of life have higher bifidobacterial carriage compared to exclusively breast-fed counterparts. Bifidobacteria demonstrate an antagonistic correlation with enterobacteria and enterococci. Further analyses also reveal a relatively lower/ delayed bifidobacterial carriage in cesarean-born babies. The study presents a quantitative perspective of the early-life gut Bifidobacterium colonization and shows how factors such as birth and feeding modes could influence this acquisition even in healthy infants.


Conflict of interest statement

The authors declare that they have no competing interests.

Figures

Figure 1
Figure 1
Dynamics of the fecal Bifidobacterium carriage during the first 3 years of life. (1A) Fecal count and prevalence of genus Bifidobacterium at different time-points. (1B) Fecal counts of Bifidobacterium species. (1C) Heat-map showing the prevalence of Bifidobacterium species. (1D) Average number (mean ± SD) of Bifidobacterium group/ species detected at each time-point. (1E) Scatter dot-plots showing the fecal counts of Bifidobacterium species at different time-points (horizontal lines and error bars represent the mean and standard deviation, respectively). Bacterial count (log10 cells/g feces) is expressed as mean ± standard deviation. Prevalence (detection rate, %) is expressed as the percentage of infants in which the specific bacterium was detected. The count of genus Bifidobacterium represents the sum of the fecal counts of B. longum subsp. longum, B. longum subsp. infantis, B. breve, B. catenulatum group, B. bifidum, B. adolescentis, B. angulatum and B. dentium. B. catenulatum group includes B. catenulatum and B. pseudocatenulatum. Age (x-axis): 1 day, 7 days, 1 month, 3 months, 6 months, 3 years.
Figure 2
Figure 2
Infant nutrition affects gut Bifidobacterium carriage during early childhood. Fecal counts of bifidobacteria in vaginally-born babies that started receiving formula-feed at age 7 days (mixed-fed) vs. those who remained exclusively breast-fed during the first 3 months of life (breast-fed). Bacterial count (log10 cells/g feces) is expressed as mean ± SD. The count of genus Bifidobacterium is expressed as the sum of the counts (log10 cells/g feces) of B. longum subsp. longum, B. longum subsp. infantis, B. breve, B. catenulatum group, B. bifidum, B. adolescentis, B. angulatum and B. dentium. B. catenulatum group includes B. catenulatum and B. pseudocatenulatum. *P < 0.05, **P < 0.01 (Student’s t-test). Only bacteria with notable difference are shown here. Age (x-axis): 1 day, 7 days, 1 month, 3 months, 6 months, 3 years.
Figure 3
Figure 3
Bifidobacteria exhibit wide-ranging correlation arrays with other gut bacterial clades and fecal organic acids. Heat-map depicting the numerical correlation of major bifidobacterial clades with other gut bacteria (log10 cells/g feces) and organic acids (µmol/g feces) in healthy full-term vaginally-born infants (n = 76) at different time-points during the first 3 years of life. The count of genus Bifidobacterium is expressed as the sum of the counts of B. longum subsp. longum, B. longum subsp. infantis, B. breve, B. catenulatum group, B. bifidum, B. adolescentis, B. angulatum and B. dentium. B. catenulatum group includes B. catenulatum and B. pseudocatenulatum. Spearman’s rank correlation coefficients is indicated by color gradient: red denotes negative correlation; Blue denotes positive correlation. *P < 0.05, **P < 0.01. Age (y-axis): 1 day, 7 days, 1 month, 3 months, 6 months, 3 years.
Figure 4
Figure 4
Birth mode may influence early-life gut Bifidobacterium carriage. Differences in the fecal count (4A) and prevalence (4B) of bifidobacterial species, and average (mean ± SD) number of species detected (4C) between vaginally- and cesarean-born babies. Bacterial count (log10 cells/g feces) is expressed as mean ± SD. Prevalence (detection rate, %) is expressed as the percentage of infants in which the specific bacterium was detected. The count of genus Bifidobacterium represents the sum of the counts of B. longum subsp. longum, B. longum subsp. infantis, B. breve, B. catenulatum group, B. bifidum, B. adolescentis, B. angulatum and B. dentium. B. catenulatum group includes B. catenulatum and B. pseudocatenulatum. Age (x-axis): 1 day, 7 days, 1 month, 3 months, 6 months, 3 years. VG: vaginal delivery; CS: C-section. *P < 0.05, **P < 0.01 (Student’s t-test). Only bacteria with notable difference are shown in Fig. 4A. Age (x-axis): 1 day, 7 days, 1 month, 3 months, 6 months, 3 years.

References

    1. Penders J, et al. Factors influencing the composition of the intestinal microbiota in early infancy. Pediatrics. 2006;118:511–521. doi: 10.1542/peds.2005-2824. - DOI - PubMed
    1. Koenig JE, et al. Succession of microbial consortia in the developing infant gut microbiome. Proc. Natl. Acad. Sci. USA. 2011;108:4578–4585. doi: 10.1073/pnas.1000081107. - DOI - PMC - PubMed
    1. Turroni F, et al. Diversity of bifidobacteria within the infant gut microbiota. PLoS One. 2012;7 doi: 10.1371/journal.pone.0036957. - DOI - PMC - PubMed
    1. Ventura M, Turroni F, Lugli GA, Van Sinderen D. Bifidobacteria and humans: our special friends, from ecological to genomics perspectives. J. Sci. Food Agric. 2014;94:163–168. doi: 10.1002/jsfa.6356. - DOI - PubMed
    1. Backhed F, et al. Dynamics and stabilization of the human gut microbiome during the first year of life. Cell Host Microbe. 2015;17:690–703. doi: 10.1016/j.chom.2015.04.004. - DOI - PubMed

Publication types