. 2017 Aug 14:8:943.
doi: 10.3389/fimmu.2017.00943. eCollection 2017.

Different Adjuvants Induce Common Innate Pathways That Are Associated with Enhanced Adaptive Responses against a Model Antigen in Humans

Collaborators, Affiliations

Different Adjuvants Induce Common Innate Pathways That Are Associated with Enhanced Adaptive Responses against a Model Antigen in Humans

Wivine Burny et al. Front Immunol. .

Abstract

To elucidate the role of innate responses in vaccine immunogenicity, we compared early responses to hepatitis B virus (HBV) surface antigen (HBsAg) combined with different Adjuvant Systems (AS) in healthy HBV-naïve adults, and included these parameters in multi-parametric models of adaptive responses. A total of 291 participants aged 18-45 years were randomized 1:1:1:1:1 to receive HBsAg with AS01B, AS01E, AS03, AS04, or Alum/Al(OH)3 at days 0 and 30 (ClinicalTrials.gov: NCT00805389). Blood protein, cellular, and mRNA innate responses were assessed at early time-points and up to 7 days after vaccination, and used with reactogenicity symptoms in linear regression analyses evaluating their correlation with HBs-specific CD4+ T-cell and antibody responses at day 44. All AS induced transient innate responses, including interleukin (IL)-6 and C-reactive protein (CRP), mostly peaking at 24 h post-vaccination and subsiding to baseline within 1-3 days. After the second but not the first injection, median interferon (IFN)-γ levels were increased in the AS01B group, and IFN-γ-inducible protein-10 levels and IFN-inducible genes upregulated in the AS01 and AS03 groups. No distinct marker or signature was specific to one particular AS. Innate profiles were comparable between AS01B, AS01E, and AS03 groups, and between AS04 and Alum groups. AS group rankings within adaptive and innate response levels and reactogenicity prevalence were similar (AS01B ≥ AS01E > AS03 > AS04 > Alum), suggesting an association between magnitudes of inflammatory and vaccine responses. Modeling revealed associations between adaptive responses and specific traits of the innate response post-dose 2 (activation of the IFN-signaling pathway, CRP and IL-6 responses). In conclusion, the ability of AS01 and AS03 to enhance adaptive responses to co-administered HBsAg is likely linked to their capacity to activate innate immunity, particularly the IFN-signaling pathway.

Keywords: AS01; AS03; AS04; adaptive immune response; innate immune response; interferon-γ; vaccine adjuvants.


Figures
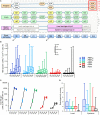
Figure 1
Figure 1
Multi-parametric analysis design and input parameters. (A) Study design schematic. Blood collection time-points for innate and adaptive immune response measurements and reactogenicity recordings are presented after the first and second vaccination (pI and pII, respectively) of hepatitis B surface antigen (HBsAg) adjuvanted with AS01B, AS01E, AS03A, AS04, or aluminum salt (“Alum”). Adaptive responses pII (“output”) expressed as frequencies of HBsAg-specific CD40L+ CD4+ T cells (CD4) or concentrations of HBs-specific antibodies (Abs) were modeled as a function of the innate immune responses pI or pII and reactogenicity pII (“input”). Innate parameters included cytokine/chemokine concentrations in serum (Cyt), gene expression assessed by qPCR in whole blood, and hematology and C-reactive protein measurements (H/C). Innate responses were expressed as fold-changes from baseline values (represented by the yellow shapes). White shapes represent values that were measured/recorded but not included in the multi-parametric analyses. Syringes indicate time-points of vaccination at days 0 and 30. Panels (B–D) represent the HBs-specific CD40L+ CD4+ T-cell responses and anti-HBs antibody responses (N = 286) through D60, and the local and systemic reactogenicity scores (N = 291) for the pooled time-points of the reporting period after the second vaccination, respectively. GMC, geometric mean concentration. CI, confidence interval.
Figure 2
Figure 2
Innate hematology and C-reactive protein (CRP) responses. Normalized CRP concentrations (N = 59, 57, 59, 61, and 55) and normalized lymphocyte, monocyte, and neutrophil counts (N = 38, 40, 45, 39, and 41) in the AS01B, AS01E, AS03, AS04 and Alum groups, respectively, of the per-protocol cohort for innate immunogenicity are represented in box-whisker plots with medians, interquartile ranges, minima and maxima indicated. D, day.
Figure 3
Figure 3
Innate cytokine responses. Interferon (IFN)-γ, interleukin (IL)-1β, IL-6, induced protein (IP)-10, and tumor necrosis factor (TNF)-α concentrations for the AS01B, AS01E, AS03, AS04 or Alum groups of the per-protocol cohort for innate immunogenicity (N = 59, 57, 59, 61 and 55, respectively) are represented in box-whisker plots with medians, interquartile ranges, minima and maxima indicated. The dotted lines indicate the assay cutoffs.
Figure 4
Figure 4
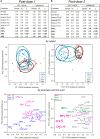
Associations between adaptive responses, and both the innate responses of hematology, C-reactive protein (CRP) and serum protein variables, and reactogenicity. Participants received HB surface antigen adjuvanted with AS01B, AS01E, AS03, AS04, or aluminum salt (Alum; N = 53, 53, 52, 51, and 47, respectively) at days 0 and 30. Data obtained after the first (pI) or the second injection (pII) are shown in panels (A,B), respectively. Upper panels: multi-parametric analyses of adaptive responses were performed for each coefficient (β) of the listed model input parameters, in terms of the estimate of the effect size, standard error (SE), and p-value (p). Input parameters included local and systemic reactogenicity scores calculated from the solicited adverse events (AEs) pII, and the innate responses pI and pII. Intercept, β for Alum group (β0). Adjuvant systems (AS) groups were compared with the Alum group (considered as baseline). HBs-specific CD4+ T-cell and antibody responses were measured at day 44. Principal components (PCs) that were significantly associated (p < 0.05) with the adaptive response are indicated by bold font. Middle panels: PC analysis of the innate response dataset was performed by subject and treatment group and visualized in bivariate plots. The variance explained by the first three PCs was 73% after the first injection and 58% after the second injection. Each dot represents the expression profile of an individual subject. Arbitrary aggregation of the subjects into treatment groups is visualized by the colored ellipses, according to the color coding presented in the left-hand corners of the plots. The PC1 accounted for 52 and 35% of the variance after the first and second dose, respectively, and is plotted against the PCs showing the strongest association with the adaptive response in the table in the upper panels, i.e., the PC3 after the first dose and the PC2 after the second dose. Lower panels: as for the middle panels, but with PCs representing the variables at the post-vaccination time-point indicated by the color coding in the upper corners of the PC plots. An overview of PC plots for each PC1, PC2, PC3 combination by variable/time-point is presented in Figure S3 in Supplementary Material. LYM, lymphocytes; MON, monocytes; NEU, neutrophils; WBC, white blood cells.
Figure 5
Figure 5
STAT1 expression. Reverse cumulative distribution curve of the STAT1 mRNA responses (in FC over day 0 or day 30 levels; N = 18, 23, 28, 22 and 21 in the AS01B, AS01E, AS03, AS04 and Alum groups, respectively) in whole blood after the first and second vaccine dose (left and right parts of the figure, respectively) are presented for the time points up to day 37.
Figure 6
Figure 6
Associations between the adaptive responses, and both the innate mRNA responses and reactogenicity. As for Figure 4, for gene expression in the AS01B, AS01E, AS03, AS04, or Alum groups (N = 11, 18, 23, 15, and 17, respectively). Results show data obtained after the first (A) or second (B) injection. Upper panels: multi-parametric analysis of the adaptive response to vaccination was performed for each coefficient (β) of the listed model input parameters, in terms of the estimate of the effect size, standard error (SE), and p-value (p). Input parameters included the local and systemic reactogenicity scores calculated from the respective solicited adverse events (AEs) post-dose 2 and innate responses after each dose. Intercept, β for Alum group (β0). Adjuvant systems (AS) groups were compared with the Alum group (considered as baseline). HBs-specific CD4+ T-cell and antibody responses were measured at 2 weeks post-dose 2. PCs that were significantly associated (p < 0.05) with adaptive responses are indicated by bold font. Middle panels: principal component (PC) analysis of post-vaccination innate responses was performed by subject. The variance explained by the first three PCs was 55% post-dose 1 and 59% post-dose 2. Each dot represents the expression profile of an individual subject. Aggregation of the subjects into treatment groups is arbitrarily visualized by the colored ellipses, according to the color coding shown in the left-hand corners of the plots. The PC1 accounted for 26 and 37% of the variance after the first and second dose, respectively, and is plotted against the PC showing the strongest association with adaptive responses in the tables shown in the upper panels, i.e., the PC2 after each dose. Lower panels: as for the middle panels, but with the PCs representing the variables at the post-vaccination time-points indicated by the color coding in the upper corners of the plots. An overview of the PC plots by variable/time-point for each PC1, PC2, PC3 combination is presented in Figure S4 in Supplementary Material.
Figure 7
Figure 7
Model schematic of the interplay between innate and adaptive responses. Word clouds represent changes in levels of serum proteins, hematology parameters or mRNA levels, with cloud and font sizes proportional to the response levels presented for these variables in Figure S1. Solid arrows indicate significant associations observed in the multi-parametric models of adaptive responses to vaccination [i.e., responses of HBs-specific CD4+ T cells [CD4] or antibodies (Abs)], with line thickness proportional to the strength of the associations. Analytes presented on the solid arrows reflect those for which the strongest separation and highest loading was observed on the principal component found to be relevant for the association with adaptive responses. Dashed arrows indicate hypothetical associations that are discussed in the manuscript but not evaluated by the multi-parametric analyses. LYM, lymphocytes; NEU, neutrophils.

References

    1. Wencker M, Turchinovich G, Di Marco Barros R, Deban L, Jandke A, Cope A, et al. Innate-like T cells straddle innate and adaptive immunity by altering antigen-receptor responsiveness. Nat Immunol (2014) 15(1):80–7.10.1038/ni.2773 - DOI - PMC - PubMed
    1. Saeed S, Quintin J, Kerstens HH, Rao NA, Aghajanirefah A, Matarese F, et al. Epigenetic programming of monocyte-to-macrophage differentiation and trained innate immunity. Science (2014) 345(6204):1251086.10.1126/science.125108 - DOI - PMC - PubMed
    1. Netea MG, Joosten LA, Latz E, Mills KH, Natoli G, Stunnenberg HG, et al. Trained immunity: a program of innate immune memory in health and disease. Science (2016) 352(6284):aaf1098.10.1126/science.aaf1098 - DOI - PMC - PubMed
    1. Gardiner CM, Mills KH. The cells that mediate innate immune memory and their functional significance in inflammatory and infectious diseases. Semin Immunol (2016) 28(4):343–50.10.1016/j.smim.2016.03.001 - DOI - PubMed
    1. Holmes TD, Bryceson YT. Natural killer cell memory in context. Semin Immunol (2016) 28(4):368–76.10.1016/j.smim.2016.05.008 - DOI - PubMed

Associated data