. 2017 Jul 7;8(8):3571-3582.
doi: 10.1364/BOE.8.003571. eCollection 2017 Aug 1.

Optical coherence tomography angiography of retinal vascular occlusions produced by imaging-guided laser photocoagulation

Affiliations

Optical coherence tomography angiography of retinal vascular occlusions produced by imaging-guided laser photocoagulation

Brian T Soetikno et al. Biomed Opt Express. .

Abstract

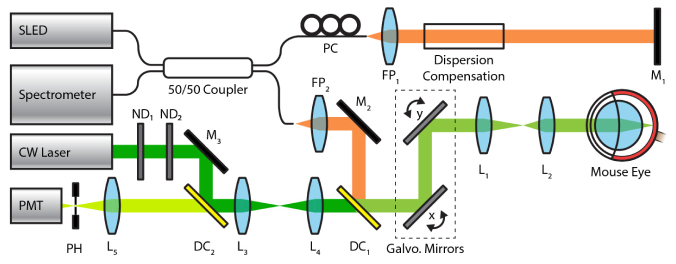
Retinal vascular occlusive diseases represent a major form of vision loss worldwide. Rodent models of these diseases have traditionally relied upon a slit-lamp biomicroscope to help visualize the fundus and subsequently aid delivery of high-power laser shots to a target vessel. Here we describe a multimodal imaging system that can produce, image, and monitor retinal vascular occlusions in rodents. The system combines a spectral-domain optical coherence tomography system for cross-sectional structural imaging and three-dimensional angiography, and a fluorescence scanning laser ophthalmoscope for Rose Bengal monitoring and high-power laser delivery to a target vessel. This multimodal system facilitates the precise production of occlusions in the branched retinal veins, central retinal vein, and branched retinal arteries. Additionally, changes in the retinal morphology and retinal vasculature can be longitudinally documented. With our device, retinal vascular occlusions can be easily and consistently created, which paves the way for futures studies on their pathophysiology and therapeutic targets.

Keywords: (170.0110) Imaging systems; (170.2520) Fluorescence microscopy; (170.4470) Ophthalmology; (170.4500) Optical coherence tomography.


Figures

Fig. 1
Fig. 1
Schematic of the combined OCT and SLO system. CW Laser: continuous wave laser. DC: dichroic mirror. FP: fiber port collimator. M: mirror. ND: neutral density filter wheel. PC: polarization controller. SLED: superluminescent light emitting diode. Focal lengths of lenses L1, L2, L3, L4, L5 were 75 mm, 15 mm, 40 mm, 50 mm, and 30 mm, respectively.
Fig. 2
Fig. 2
Key steps of the retinal vascular occlusion protocol.
Fig. 3
Fig. 3
Producing a branched retinal vein occlusion. (A) Pre-occlusion RB angiogram. Red box indicates scanning area for occlusion. (B) Mean RB fluorescence signal during occlusion corresponding to red box in A. Insets 1 to 4 show frames at points 1 to 4 on the curve. Laser power was 25 mW at the pupil. (C) Post-occlusion RB angiogram. (D) Pre-occlusion OCTA of a retinal vein. (E) Post-occlusion OCTA. White solid circles in D and E indicate the site of occlusion. White dashed region indicates area of capillary non-perfusion. (F) Pre-occlusion OCT B-scan at the white dashed line in D. (G) Post-occlusion OCT B-scan at the white dashed line in E. Yellow arrows in F and G indicate vessel location. Horizontal scale bars are 500 µm. Vertical scale bars are 100 µm. a: artery; v: vein.
Fig. 4
Fig. 4
Longitudinal OCTA of branched vein occlusion. (A) Pre-occlusion RB angiogram. (B) Post-occlusion RB angiogram. Yellow arrow indicates dilated, tortuous vein. Magenta arrow indicates vascular leakage. Yellow circles in A and B indicates site targeted for occlusion. (C) Montage of 9 OCTA images before vein occlusion. a and v denote arteries and veins respectively. White circle denotes the targeted site of occlusion on the 9 o’ clock vein. (D) Montage after vein occlusion. (E) Montage on day 1 after the vein occlusion. White dotted regions in B and C denote areas of capillary non-perfusion. (F,G,H) OCT B-scans at the ONH before, after, and at day 1 for a vein occlusion. White dashed lines in C,D, and E denote the B-scan position for F,G, and H. Horizontal scale bars are 500 µm. Vertical scale bars are 100 µm.
Fig. 5
Fig. 5
Longitudinal OCTA of central vein occlusion. (A) Pre-occlusion RB angiogram. Yellow circle indicates site of occlusion. (B) Post-occlusion RB angiogram. (C) Post-occlusion RB angiogram positioned away from ONH. (D) Montage of 3 OCTA images pre-occlusion. “a” and “v” label the arteries and veins, respectively. White solid circle shows the target site for vessel occlusion. (E) Montage of 3 OCTA images post-occlusion. White dotted region denotes area of capillary non-perfusion. (F) Montage of 3 OCTA images at day 1. (G,H,I) OCT B-scans at the white dashed lines in D,E,F, respectively. Horizontal scale bars are 500 µm. Vertical scale bars are 100 µm.
Fig. 6
Fig. 6
Longitudinal OCTA of branched artery occlusion (A) Pre-occlusion RB angiogram. Yellow circle indicates site of occlusion. (B) Post-occlusion RB angiogram. (C) Montage of 3 pre-occlusion OCTA images. White solid circle denotes the site of occlusion. White solid arrow indicates an arterial branch point. a: artery; v: vein; (D) Montage of 3 post-occlusion OCTA images. White dashed region denotes area of capillary non-perfusion. White solid arrow indicates an arterial branch point (E) Montage of 3 OCTA images on day 1. White dashed region denotes area of capillary non-perfusion. Scale bars: 500 µm.

References

    1. Hayreh S. S., “Ocular vascular occlusive disorders: natural history of visual outcome,” Prog. Retin. Eye Res. 41, 1–25 (2014).10.1016/j.preteyeres.2014.04.001 - DOI - PMC - PubMed
    1. Rogers S., McIntosh R. L., Cheung N., Lim L., Wang J. J., Mitchell P., Kowalski J. W., Nguyen H., Wong T. Y., International Eye Disease Consortium , “The prevalence of retinal vein occlusion: pooled data from population studies from the United States, Europe, Asia, and Australia,” Ophthalmology 117, 313–319 (2010). - PMC - PubMed
    1. Sun C., Li X. X., He X. J., Zhang Q., Tao Y., “Neuroprotective effect of minocycline in a rat model of branch retinal vein occlusion,” Exp. Eye Res. 113, 105–116 (2013).10.1016/j.exer.2013.05.018 - DOI - PubMed
    1. Rehak M., Hollborn M., Iandiev I., Pannicke T., Karl A., Wurm A., Kohen L., Reichenbach A., Wiedemann P., Bringmann A., “Retinal gene expression and Müller cell responses after branch retinal vein occlusion in the rat,” Invest. Ophthalmol. Vis. Sci. 50(5), 2359–2367 (2009).10.1167/iovs.08-2332 - DOI - PubMed
    1. Paques M., Tadayoni R., Sercombe R., Laurent P., Genevois O., Gaudric A., Vicaut E., “Structural and hemodynamic analysis of the mouse retinal microcirculation,” Invest. Ophthalmol. Vis. Sci. 44(11), 4960–4967 (2003).10.1167/iovs.02-0738 - DOI - PubMed