. 2017 Jul 13;8(8):3643-3655.
doi: 10.1364/BOE.8.003643. eCollection 2017 Aug 1.

Quantitatively characterizing the microstructural features of breast ductal carcinoma tissues in different progression stages by Mueller matrix microscope

Affiliations

Quantitatively characterizing the microstructural features of breast ductal carcinoma tissues in different progression stages by Mueller matrix microscope

Yang Dong et al. Biomed Opt Express. .

Abstract

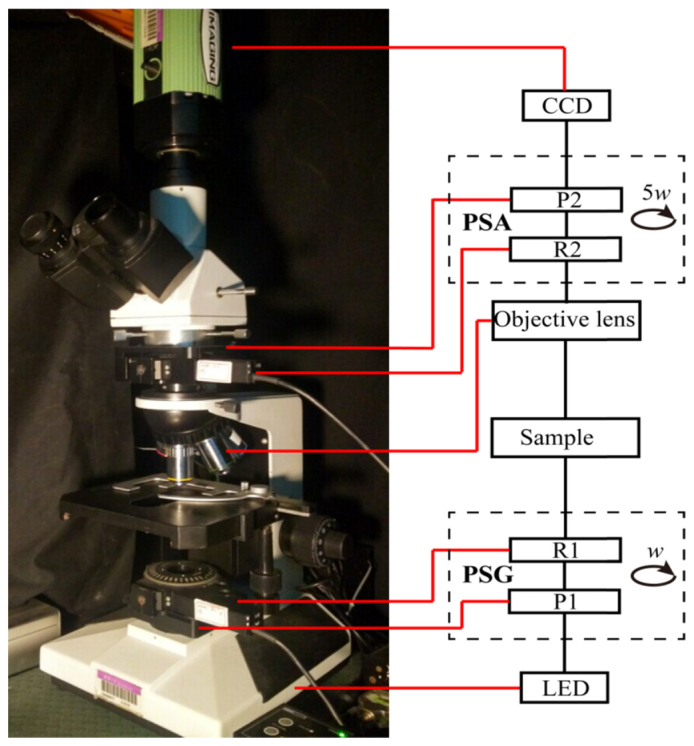
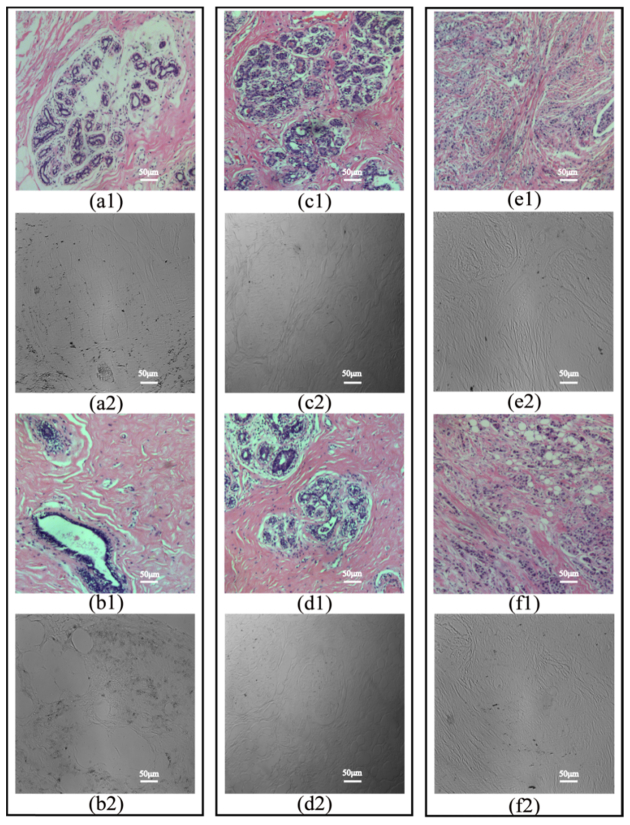
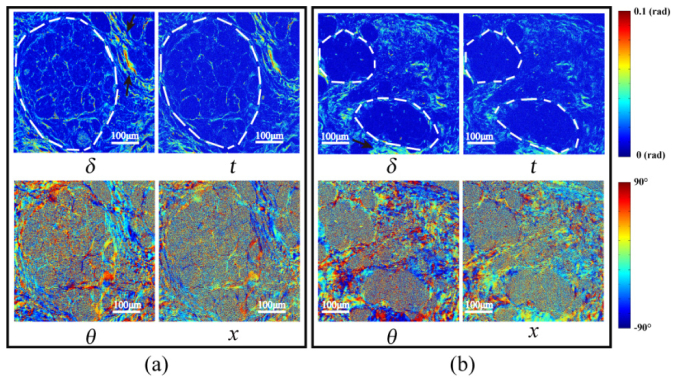
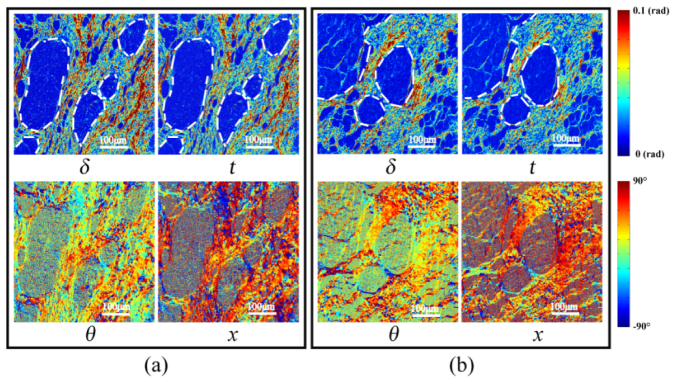
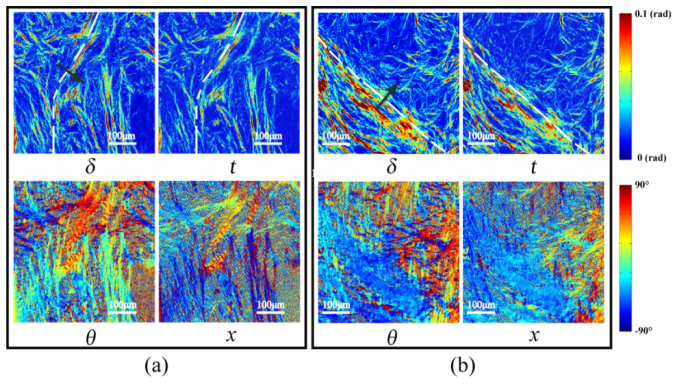
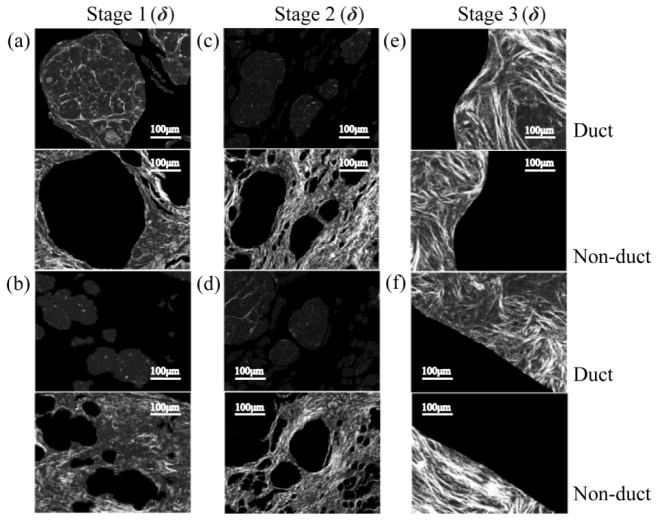
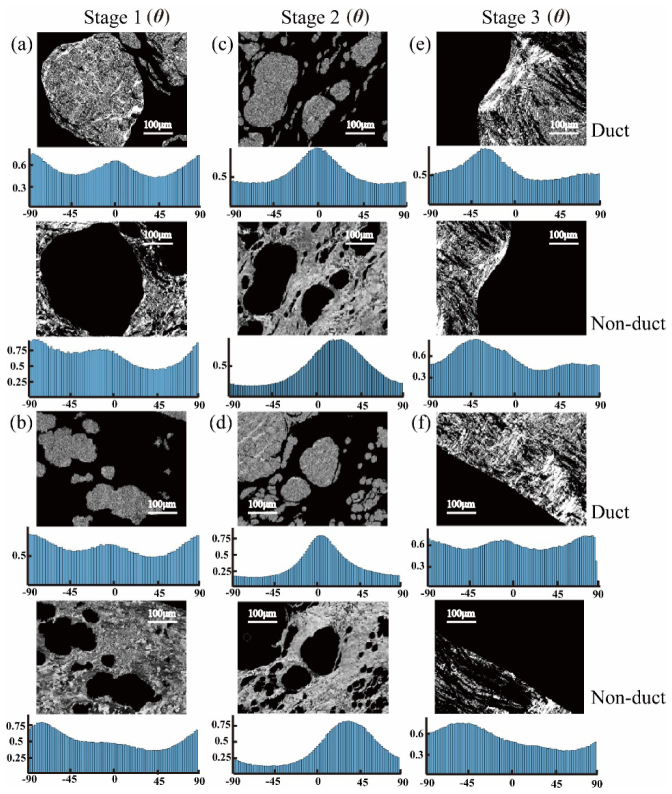
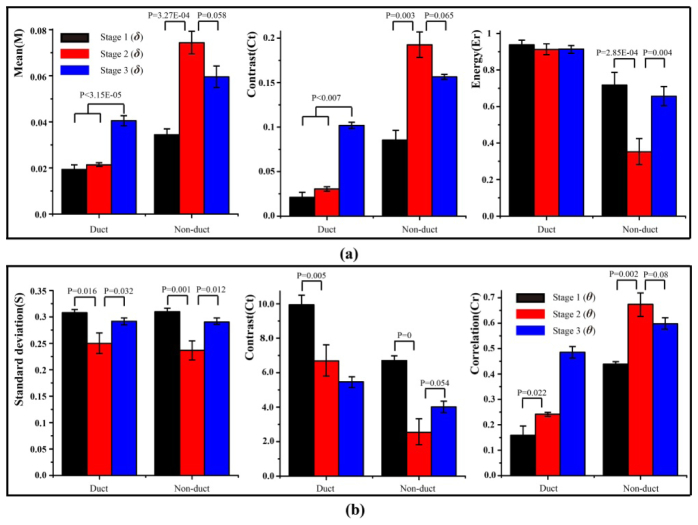
Polarization imaging has been recognized as a potentially powerful technique for probing the microstructural information and optical properties of complex biological specimens. Recently, we have reported a Mueller matrix microscope by adding the polarization state generator and analyzer (PSG and PSA) to a commercial transmission-light microscope, and applied it to differentiate human liver and cervical cancerous tissues with fibrosis. In this paper, we apply the Mueller matrix microscope for quantitative detection of human breast ductal carcinoma samples at different stages. The Mueller matrix polar decomposition and transformation parameters of the breast ductal tissues in different regions and at different stages are calculated and analyzed. For more quantitative comparisons, several widely-used image texture feature parameters are also calculated to characterize the difference in the polarimetric images. The experimental results indicate that the Mueller matrix microscope and the polarization parameters can facilitate the quantitative detection of breast ductal carcinoma tissues at different stages.

Keywords: (110.5405) Polarimetric imaging; (170.3880) Medical and biological imaging; (290.5855) Scattering, polarization.


Figures

Fig. 1
Fig. 1
Photograph and schematic of the Mueller matrix microscope. P: polarizer; R: quarter-wave plate; PSG: polarization state generator; PSA: polarization state analyzer.
Fig. 2
Fig. 2
Microscopic intensity images of the H and E stained slices of breast ductal tissues at different pathological stages: (a1), (b1) samples 1 and 2 in stage 1 respectively; (c1), (d1) samples 3 and 4 in stage 2 respectively; (e1), (f1) samples 5 and 6 in stage 3 respectively, and the corresponding 12-µm-thick unstained dewaxed slices of breast ductal tissues: (a2), (b2) samples 1 and 2 in stage 1 respectively, (c2), (d2) samples 3 and 4 in stage 2 respectively, (e2), (f2) samples 5 and 6 in stage 3 respectively.
Fig. 3
Fig. 3
Images of MMPD and MMT parameters of the 12-µm-thick unstained dewaxed slices of normal breast ductal tissue in stage 1: (a) sample 1; (b) sample 2.
Fig. 4
Fig. 4
Images of MMPD and MMT parameters of the 12-µm-thick unstained dewaxed slices of breast ductal carcinoma in situ for stage 2: (a) sample 3; (b) sample 4.
Fig. 5
Fig. 5
Images of MMPD and MMT parameters of the 12-µm-thick unstained dewaxed slices of breast invasive ductal carcinoma tissue in stage 3: (a) sample 5; (b) sample 6. Black arrows indicate the areas within the ducts.
Fig. 6
Fig. 6
Duct areas (in the first and third row) and non-duct areas (in the second and fourth row) of sample 1-6 were separated based on parameter δ for further quantitative characterization and analysis: (a), (b) stage 1 (samples 1&2); (c), (d) stage 2 (samples 3&4); (e), (f) stage 3 (samples 5&6).
Fig. 7
Fig. 7
Gray image segmentation results of breast ductal tissues in different pathological stages based on parameter θ: (a), (b) stage 1 (samples 1&2); (c), (d) stage 2 (samples 3&4); (e), (f) stage 3 (samples 5&6). Corresponding statistical distribution histograms of θ are provided under the gray image segmentation results.
Fig. 8
Fig. 8
Image texture parameters for duct and non-duct areas of 18 samples in different stages (6 samples for each stage): (a) M, Ct and Er of parameter δ, (b) S, Ct and Cr of parameters θ. P is the P-value between the two sets of experimental data in different stages, which is obtained by the significance test method in statistics (P < 0.05 is significant).

References

    1. Parkin D. M., Bray F., Ferlay J., Pisani P., “Estimating the world cancer burden: Globocan 2000,” Int. J. Cancer 94(2), 153–156 (2001).10.1002/ijc.1440 - DOI - PubMed
    1. Siegel R., Ma J., Zou Z., Jemal A., “Cancer statistics, 2014,” CA Cancer J. Clin. 64(1), 9–29 (2014).10.3322/caac.21208 - DOI - PubMed
    1. Jemal A., Ward E., Thun M. J., “Recent trends in breast cancer incidence rates by age and tumor characteristics among U.S. women,” Breast Cancer Res. 9(3), R28 (2007).10.1186/bcr1672 - DOI - PMC - PubMed
    1. Ginsburg O., Bray F., Coleman M. P., Vanderpuye V., Eniu A., Kotha S. R., Sarker M., Huong T. T., Allemani C., Dvaladze A., Gralow J., Yeates K., Taylor C., Oomman N., Krishnan S., Sullivan R., Kombe D., Blas M. M., Parham G., Kassami N., Conteh L., “The global burden of women’s cancers: a grand challenge in global health,” Lancet 389(10071), 847–860 (2017).10.1016/S0140-6736(16)31392-7 - DOI - PMC - PubMed
    1. Lakhani S. R., Ellis I. O., Schnitt S. J., Tan P. H., van de Vijver M. J., “World Health Organisation classification of tumors of the breast,” Lyon, France: International Agency for Research on Cancer (IARC) (2012).