. 2017 Jul 19;8(8):3700-3713.
doi: 10.1364/BOE.8.003700. eCollection 2017 Aug 1.

Label-free optical detection of action potential in mammalian neurons

Affiliations

Label-free optical detection of action potential in mammalian neurons

Subrata Batabyal et al. Biomed Opt Express. .

Abstract

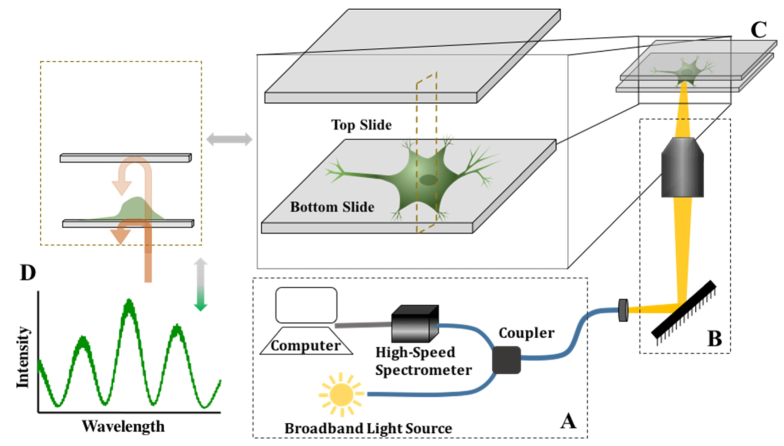
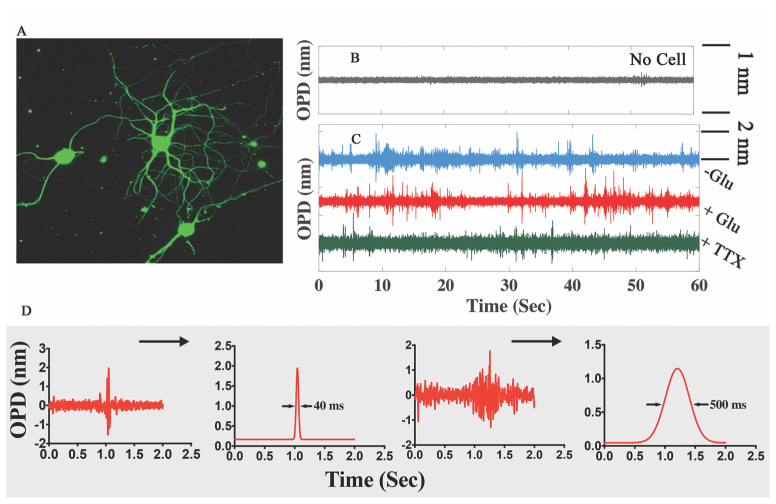
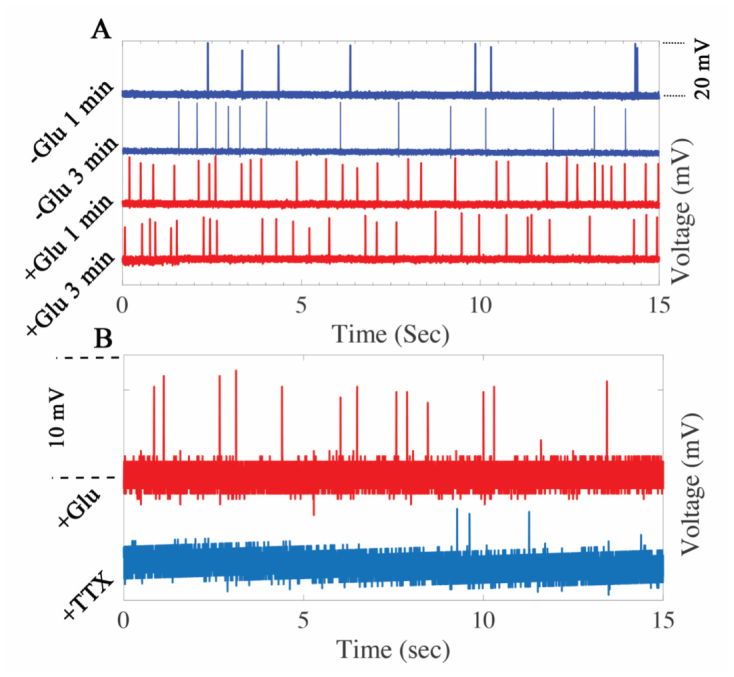
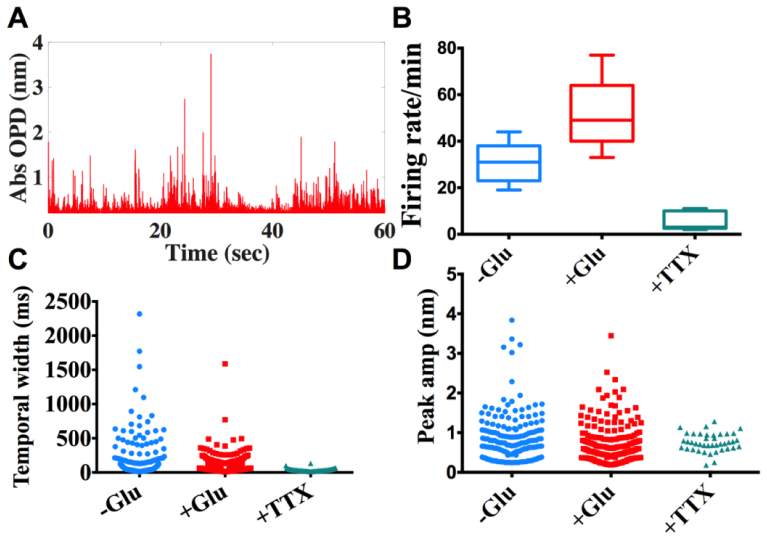
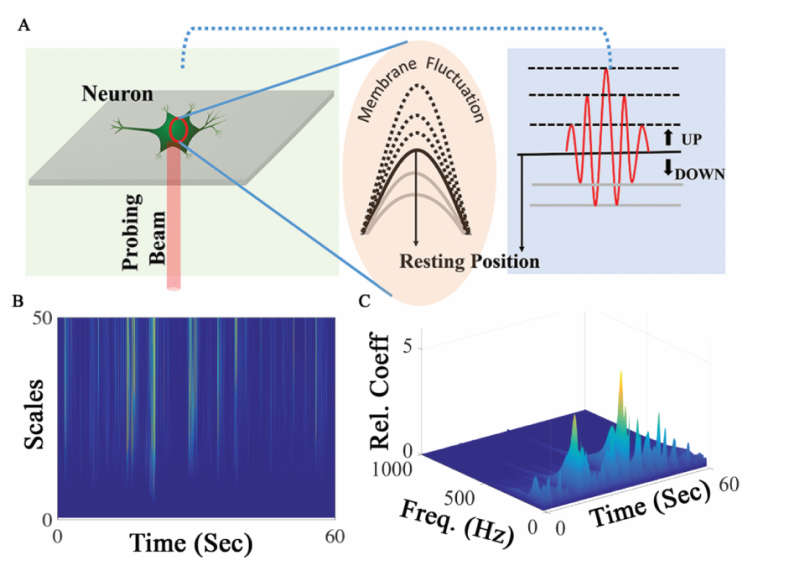
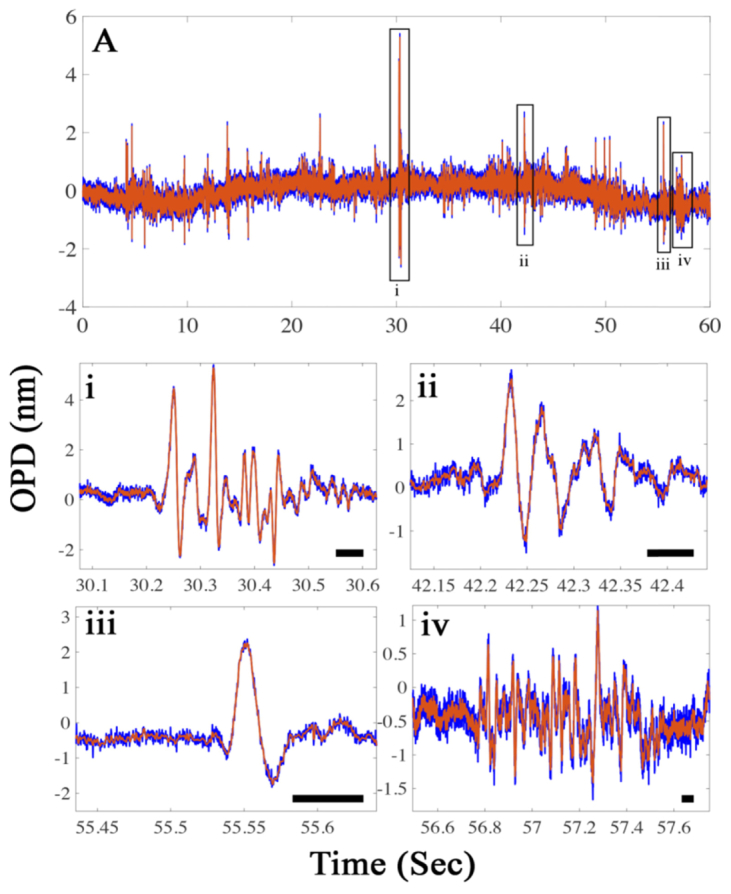
We describe an optical technique for label-free detection of the action potential in cultured mammalian neurons. Induced morphological changes due to action potential propagation in neurons are optically interrogated with a phase sensitive interferometric technique. Optical recordings composed of signal pulses mirror the electrical spike train activity of individual neurons in a network. The optical pulses are transient nanoscale oscillatory changes in the optical path length of varying peak magnitude and temporal width. Exogenous application of glutamate to cortical neuronal cultures produced coincident increase in the electrical and optical activity; both were blocked by application of a Na-channel blocker, Tetrodotoxin. The observed transient change in optical path length in a single optical pulse is primarily due to physical fluctuations of the neuronal cell membrane mediated by a yet unknown electromechanical transduction phenomenon. Our analysis suggests a traveling surface wave in the neuronal cell membrane is responsible for the measured optical signal pulses.

Keywords: (120.3180) Interferometry; (120.5050) Phase measurement; (120.5820) Scattering measurements; (170.2655) Functional monitoring and imaging; (180.3170) Interference microscopy.


Figures

Fig. 1
Fig. 1
Optical setup for detecting neuronal activity using low coherence phase sensitive interferometry. (A) Schematic diagram of the interferometric instrument which consists of a broadband source (center wavelength at 860nm, bandwidth of 63 nm), fiber coupler, high-speed spectrometer, and computer with data acquisition system. (B) Output port of the fiber coupler is attached to the side port of an inverted microscope that transmits and focusses light on the s (C) Illustration of neuronal cell culture device in a sandwich configuration consisting of two glass slides that are separated by a fixed gap (~80 μm) with neurons attached to the bottom glass slide, and (D) Light reflecting from the bottom (glass-cell) and the top (cell-media) interfaces of the two glass slides of the neuronal cell culture device couple back into the interferometer and mix to form spectral interference fringe signal.
Fig. 2
Fig. 2
Representative optical signals recorded from individual neurons in a network. (A) Fluorescence immuno-stained (primary β-III-tubulin antibody- Alexa Fluor 488) image of networked rat cortical neurons used in our experiments. (B) & (C) Temporal change in OPD under different experimental conditions (no cell, cell without any stimulation, cell with Glutamate stimulation, cell with TTX inhibition) showing a non-periodic train of optical signal oscillation from unstimulated and stimulated neurons which die out when inhibited with TTX. Calculated OPD sensitivity (standard deviation of optical trace in (Fig. 2(B))) was 30 pm. (D) Isolated burst of individual optical pulses that have wave packet like signal pulse characteristics and their corresponding envelopes show variation in temporal pulse width.
Fig. 3
Fig. 3
Patch clamp recording of action potential firing from single neurons. (A) Pre-and post-glutamate stimulation voltage recording (current clamp) of randomly generated action potential spikes in networked neurons. (B) Inhibition of electrical activity with addition of TTX. Recordings in (A) and (B) are from two separate experiments.
Fig. 4
Fig. 4
Analysis of extracted features from individual optical pulse (Fig. 2) (N = 5 neurons). (A) Optical signals are rectified, followed by envelope detection of each pulse. (B) Firing rate of unstimulated vs stimulated/inhibited neurons, (p<0.05 for -Glu vs + Glu and -Glu vs + TTX). (C)-(D) scatter plots of envelope width, envelope peak under no stimulation, Glutamate stimulation, and TTX inhibition conditions, respectively.
Fig. 5
Fig. 5
(A) Illustration of plausible mechanistic origin of optical signal pulse (right panel) due to transient oscillation of neural cell membrane (middle panel) which is triggered by propagating action potential (B) Time-frequency analysis (continuous wavelet transform) of optical pulse train, and (C) Frequency characterization of membrane oscillation from individual optical pulse.
Fig. 6
Fig. 6
Optical pulses of varying temporal characteristics (A) Raw (blue) and filtered (low pass-orange) 60 sec extract of optical recording from a signal neuron showing a train of randomly spaced optical pulse. (i-iv) Zoomed section of select windows from optical recordings (A) showing single or multicyclic oscillation of the detected optical pulses. The temporal variation of the selected oscillatory pulses is evident (scale-bar = 50 ms).

Similar articles

Cited by

References

    1. Quiroga R. Q., Reddy L., Kreiman G., Koch C., Fried I., “Invariant visual representation by single neurons in the human brain,” Nature 435(7045), 1102–1107 (2005).10.1038/nature03687 - DOI - PubMed
    1. Rees G., Kreiman G., Koch C., “Neural correlates of consciousness in humans,” Nat. Rev. Neurosci. 3(4), 261–270 (2002).10.1038/nrn783 - DOI - PubMed
    1. Bassett D. S., Bullmore E. T., “Human brain networks in health and disease,” Curr. Opin. Neurol. 22(4), 340–347 (2009).10.1097/WCO.0b013e32832d93dd - DOI - PMC - PubMed
    1. Lossin C., Rhodes T. H., Desai R. R., Vanoye C. G., Wang D., Carniciu S., Devinsky O., George A. L., Jr., “Epilepsy-associated dysfunction in the voltage-gated neuronal sodium channel scn1a,” J. Neurosci. 23(36), 11289–11295 (2003). - PMC - PubMed
    1. Mueller J. K., Tyler W. J., “A quantitative overview of biophysical forces impinging on neural function,” Phys. Biol. 11(5), 051001 (2014).10.1088/1478-3975/11/5/051001 - DOI - PubMed