. 2019 Jan 1;527(1):117-132.
doi: 10.1002/cne.24313. Epub 2017 Sep 15.

Selective synaptic connections in the retinal pathway for night vision

Affiliations

Selective synaptic connections in the retinal pathway for night vision

Deborah L Beaudoin et al. J Comp Neurol. .

Abstract

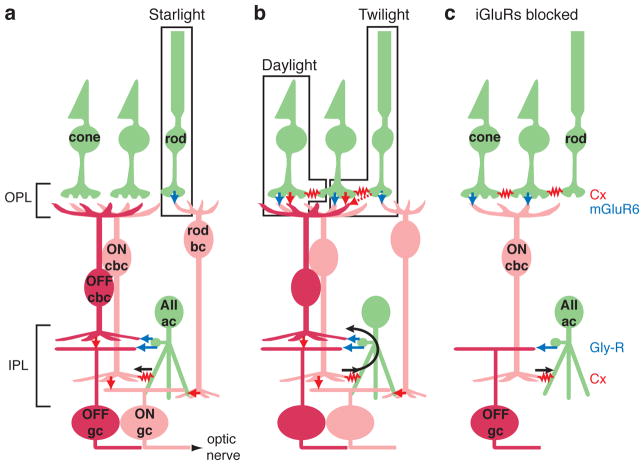
The mammalian retina encodes visual information in dim light using rod photoreceptors and a specialized circuit: rods→rod bipolar cells→AII amacrine cell. The AII amacrine cell uses sign-conserving electrical synapses to modulate ON cone bipolar cell terminals and sign-inverting chemical (glycinergic) synapses to modulate OFF cone cell bipolar terminals; these ON and OFF cone bipolar terminals then drive the output neurons, retinal ganglion cells (RGCs), following light increments and decrements, respectively. The AII amacrine cell also makes direct glycinergic synapses with certain RGCs, but it is not well established how many types receive this direct AII input. Here, we investigated functional AII amacrine→RGC synaptic connections in the retina of the guinea pig (Cavia porcellus) by recording inhibitory currents from RGCs in the presence of ionotropic glutamate receptor (iGluR) antagonists. This condition isolates a specific pathway through the AII amacrine cell that does not require iGluRs: cone→ON cone bipolar cell→AII amacrine cell→RGC. These recordings show that AII amacrine cells make direct synapses with OFF Alpha, OFF Delta and a smaller OFF transient RGC type that co-stratifies with OFF Alpha cells. However, AII amacrine cells avoid making synapses with numerous RGC types that co-stratify with the connected RGCs. Selective AII connections ensure that a privileged minority of RGC types receives direct input from the night-vision pathway, independent from OFF bipolar cell activity. Furthermore, these results illustrate the specificity of retinal connections, which cannot be predicted solely by co-stratification of dendrites and axons within the inner plexiform layer.

Keywords: AII amacrine cell; RRID: AB_2079751; RRID: AB_2307351; RRID: AB_2315776; RRID: AB_2536190; retina; retinal ganglion cells; rod bipolar cell; scotopic vision; synapse.


Conflict of interest statement

Conflict of interest: The authors have no conflicting interests.

Figures

Figure 1
Figure 1. Night vision circuit in mammalian retina
a. In starlight, rods signal to the rod bipolar cell (bc) via glutamate release onto mGluR6 receptors (blue arrow). The rod bc releases glutamate onto iGluRs on the AII amacrine cell (AII ac; red arrow). The AII ac forms two types of output synapse: an electrical gap junction, formed by connexins (Cx), with ON cone bipolar cell (cbc) terminals (red resistor symbol) and glycine release onto OFF cbc and OFF ganglion cell (gc) dendrites (blue arrows). ON and OFF cbc’s release glutamate onto iGluRs of the corresponding gc type (red arrows). Abbreviations: OPL: outer plexiform layer; IPL: inner plexiform layer. b. In twilight, rods signal cones through gap junctions. Under these conditions and in daylight, when cones are stimulated directly, cones signal through glutamate release onto iGluRs and mGluRs at OFF and ON cbc synapses, respectively. In the IPL, ON cbc’s excite the AII ac and cause glycine release onto OFF cbc terminals and OFF gc dendrites. c. In the presence of iGluR blockers, the ability to drive light-evoked gc responses is limited to a circuit where cones stimulate the ON cbc (via mGluR6 receptors), which drives the AII (via a gap junction) to release glycine onto OFF-layer gc dendrites. Rods can also drive this circuit through their gap junctions with cones.
Figure 2
Figure 2. Dendritic tree size and stratification distinguish RGC types
a. Side-projection of a region of interest (46 × 46 μm) from the confocal z-stack of a monostratified RGC (OFF T2-L7 cell; boxed area in Figure 4f). Image at left shows the fluorescent intensity of the filled dendrite; the profile of fluorescence is shown in green, in normalized units. The fluorescence peak was fitted with a polynomial function (black line); the peak of the polynomial indicates the stratification level (black arrow, circle). Image at right shows the fluorescent intensity of the ChAT staining from the same section. The two peaks indicate the inner and outer ChAT bands, as labeled, and the dashed lines indicate the peaks of the fitted polynomial functions (black lines). b. Same format as a. for an example bistratified RGC (ON-OFF LB1-L3.5/L8 cell; boxed area in Figure 5d). c. Each data point represents a single cell and shows its dendritic tree diameter plotted against peak stratification of dendrites relative to the ChAT bands (straight dashed lines). Symbols indicate the presumed RGC type based on a combination of the parameters measured here and the measurements of excitatory conductance in response to a contrast-reversing spot, the input resistance, and the tuning to motion direction measured in subsequent figures. In addition to cells recorded in this study, cells from a previous study were included for four of the cell types (filled symbols; ON Alpha-L3, ON DS-L4, OFF Alpha-L7, OFF Delta-L9; Manookin et al., 2008). Ovals drawn with dashed lines show groups that became apparent based on the morphology measurements alone. In some cases, these groups included more than one cell type (e.g., OFF T1-L7 and OFF T2-L7) that became distinguishable after analyzing physiological responses. Layers of the retina are indicated by the scale in green (L1 – 10); the ChAT bands were aligned with L4 and L7.5, based on previous measurements (Manookin et al., 2008; see Results). For bistratified cells, measurements of inner and outer dendrites are connected by a line.
Figure 3
Figure 3. Direction and orientation tuning of RGCs
a. Example ON direction-selective (DS)-L4 RGC responding to movement of a bar in 12 different directions. Red points show spikes per sweep of the bar in each direction, with spike number plotted as distance from the origin. Below the polar plot are raw spike responses to the preferred and null directions of motion. The bar (100 × 200 μm) was 100% Weber contrast on a gray background and moved along its long edge at 0.5 mm s−1. b. Same format as a. for an example ON-OFF DS-L4.5/L7.5 RGC. Two spike bursts are observed for the leading (ON response) and trailing edge of the bar (OFF response). c. Example of a large bistratified (ON-OFF LB1-L3.5/L8) RGC with mild orientation tuning in response to a grating that drifted in 8 different directions. Red points show firing rate (spikes s−1) in response to the 6-second presentation of the grating. The grating was presented in a square region (1.6 × 1.6 mm) at 100% Michelson contrast with a spatial frequency of 5.3 cycles mm−1 and temporal frequency of 1 Hz. d. Same as c. for an example of a large bistratified (LB Misc-L3.5/L8) RGC with strong orientation tuning.
Figure 4
Figure 4. OFF RGC types distinguished by spot response and input resistance
a. Left, an example OFF Delta-L9 RGC filled with Lucifer Yellow superimposed with a green circle representing the contrast-reversing spot stimulus (0.2-mm diameter, 1 Hz). For the sample of cells (n = 8), the normalized (norm.) excitatory (exc.) and inhibitory (inh.) conductances are shown in black and red, respectively, for each cell. The response was normalized by dividing by the SD of the trace. The average response across cells is shown in cyan (excitatory conductance) or blue (inhibitory conductance). b. Same format as a. for OFF TS-L8 cells. This cell is shown with the 0.2-mm diameter spot superimposed. c. Same format as a. for OFF Misc-L8 cells. d. Same format as a. for OFF Alpha-L7 cells. e. Same format as a. for OFF T1-L7 cells. f. Same format as a. for OFF T2-L7 cells. The boxed area indicates the region of interest shown as a side projection in Figure 2a. g. Input resistance (Rin) plotted against maximum excitatory conductance for OFF cells of all types show in a. – f. Rin distinguished certain cell types. For example, Rin of OFF Alpha-L7 cells (dashed black line) was lower than for OFF T2-L7 cells (dashed orange line), even though their dendrites co-stratified (Figure 2C). h. Excitatory conductance and spike responses distinguished OFF T1-L7 and OFF T2-L7 RGCs. The full-width at half-maximum (fwhm) of the excitatory conductance was measured during the OFF response (cyan line). The spike rate was measured to the drifting grating stimulus (see Figure 3). i. OFF T1-L7 cells had a relatively longer fwhm of excitatory conductance (gexc) and a higher firing rate to the grating.
Figure 5
Figure 5. ON-OFF RGC types distinguished by spot response and input resistance
a. Left, an example ON-OFF M1-L6 RGC filled with Lucifer Yellow superimposed with a green circle representing the contrast-reversing spot stimulus (0.2-mm diameter, 1 Hz). Normalized (norm.) excitatory (exc.) and inhibitory (inh.) conductances are show for each cell, as in Figure 4. The average response across cells is shown in cyan (excitatory conductance) or blue (inhibitory conductance). b. Same format as a. for ON-OFF M2-L6 cells. c. Same format as a. for ON-OFF DS-L4.5/L7.5 cells. Both inner (left) and outer (right) dendrites are shown. d. Same format as c. for ON-OFF LB1-L3.5/L8 cells. The boxed area indicates the region of interest shown as a side projection in Figure 2b. e. Normalized conductances for a group of miscellaneous large bistratified cells (LB-Misc) that stratified in L3.5 and L8. f. The Rin for ON-OFF M1-L6 cells was the highest of all groups, whereas the ON-OFF LB1-L3.5/L8 cells had the lowest Rin.
Figure 6
Figure 6. ON RGC types distinguished by spot response and input resistance
a. Left, an example ON T-L5 RGC filled with Lucifer Yellow superimposed with a green circle representing the contrast-reversing spot stimulus (0.2-mm diameter, 1 Hz). Normalized (norm.) excitatory (exc.) and inhibitory (inh.) conductances are show for each cell, as in Figure 4. The average response across cells is shown in cyan (excitatory conductance) or blue (inhibitory conductance). b. Same format as a. for ON TS-L5 cells. Inhibition was measured in only one case. c. Same format as a. for ON DS-L4 cells. d. Same format as a. for ON S-L3 cells. e. Same format as a. for ON Alpha-L3 cells. For these cells, a large spot size was used (0.5-mm diameter, dashed green line). f. Rin and maximum excitatory conductance distinguished certain cell types. For example, ON T-L5 and ON Alpha-L3 cells had a relatively larger maximum conductance than the other types, which could be separated by the dashed line. ON S-L3 and ON Alpha-L3 co-stratified (Figure 2C), but ON Alpha-L3 cells had lower Rin.
Figure 7
Figure 7. AII amacrine cells make synapses with three OFF RGC types
a. The excitatory (exc.) and inhibitory (inh.) conductance to a contrast-reversing spot (0.2-mm diameter) before (Control), during (iGlur block) and after (Wash) bath-applying iGluR antagonists (either 200 μM CNQX or 100 μM DNQX with 100 μM D-AP5). For three OFF RGC types (OFF Delta-L9, OFF Alpha-L7 and OFF T2-L7), the inhibitory conductance persisted following iGluR block. A partial recovery was observed in the Wash condition. b. Examples of other RGC types that lacked any sign of a light-driven conductance following iGluR block.
Figure 8
Figure 8. Population analysis shows that AII amacrine cells make synapses with a privileged minority of RGC types
a. The peak excitatory conductance measured for control versus iGluR block conditions. The response for each cell was averaged over a 30-ms time window centered on the peak excitatory conductance for the control condition. Responses of all cell types were strongly suppressed, as expected. Symbols for each cell type are shown in c. The identity line is shown here and in b. b. Same format as a. for the inhibitory conductance. Data for three cell types show a persistent response under iGluR block. c. The inhibitory conductance measured under iGluR block relative to the control condition shows a significant response (p < 0.05) for three OFF RGC types (*; with the large outlier removed for both OFF Delta-L9 and OFF Alpha-L7 cells). Conductance was averaged over a 150-ms time window, 50-ms following light onset. Some cell types were grouped for this analysis and in a., b. and d.: ON-OFF M1 and M2 cells; and ON-OFF LB1-L3.5/L8 and LB-Misc-L3.5/L8 cells. d. The Rin was relatively stable between control and iGluR block conditions, changing by less than a factor of two (i.e., points between the gray diagonal lines) for ~89% of cells. e. For three OFF RGC types, the inhibitory conductance under iGluR block showed a common temporal profile. For each RGC type, black lines show the normalized (norm.) inhibitory conductance during contrast reversal. Colored lines show the average for the group, which are shown superimposed at right.

Similar articles

Cited by

References

    1. Anderson JR, Jones BW, Watt CB, Shaw MV, Yang JH, Demill D, Lauritzen JS, Lin Y, Rapp KD, Mastronarde D, Koshevoy P, Grimm B, Tasdizen T, Whitaker R, Marc RE. Exploring the retinal connectome. Molecular Vision. 2011;17:355–379. - PMC - PubMed
    1. Arman AC, Sampath AP. Dark-adapted response threshold of OFF ganglion cells is not set by OFF bipolar cells in the mouse retina. Journal of Neurophysiology. 2012;107:2649–2659. - PMC - PubMed
    1. Baden T, Berens P, Franke K, Roman Roson M, Bethge M, Euler T. The functional diversity of retinal ganglion cells in the mouse. Nature. 2016;529:345–350. - PMC - PubMed
    1. Balakrishnan V, Puthussery T, Kim MH, Taylor WR, von Gersdorff H. Synaptic Vesicle Exocytosis at the Dendritic Lobules of an Inhibitory Interneuron in the Mammalian Retina. Neuron. 2015;87:563–575. - PMC - PubMed
    1. Beaudoin DL, Borghuis BG, Demb JB. Cellular basis for contrast gain control over the receptive field center of mammalian retinal ganglion cells. Journal of Neuroscience. 2007;27:2636–2645. - PMC - PubMed

Publication types

MeSH terms