

Complexity analysis of cortical surface detects changes in future Alzheimer's disease converters
- PMID: 28856799
- PMCID: PMC5745046
- DOI: 10.1002/hbm.23773
Complexity analysis of cortical surface detects changes in future Alzheimer's disease converters
Abstract
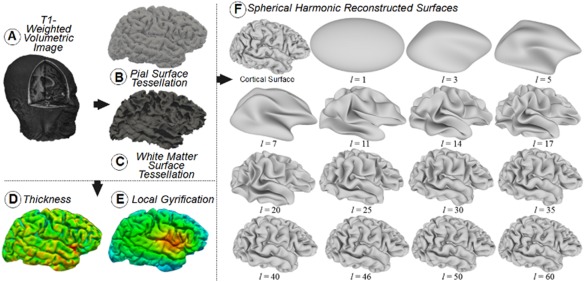
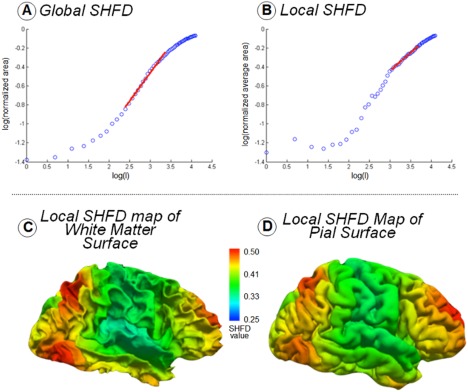
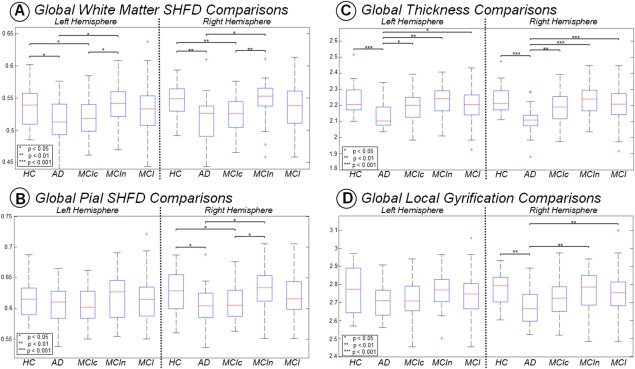
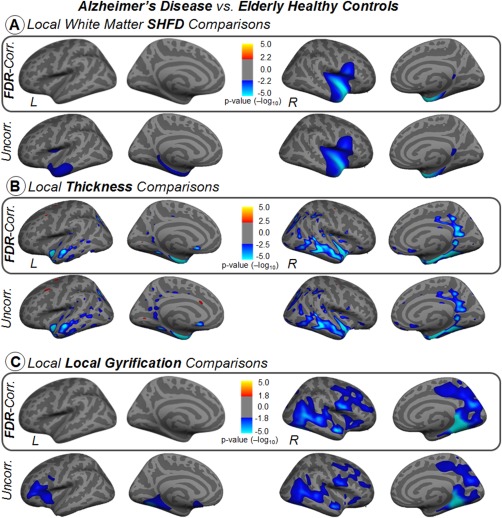
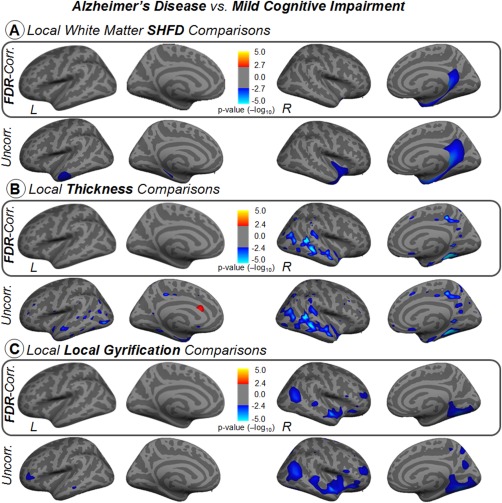
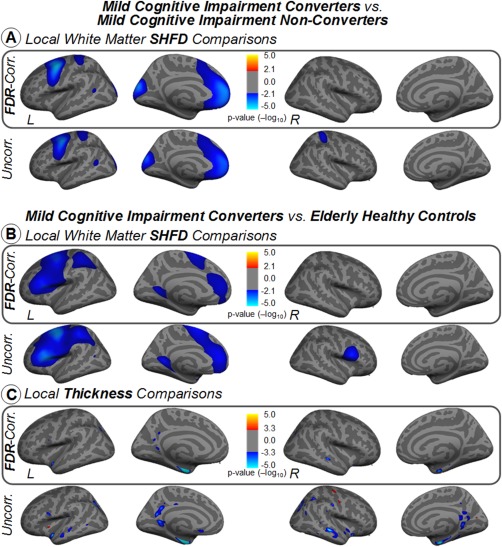
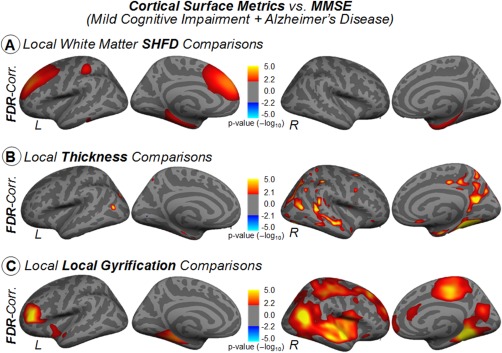
Alzheimer's disease (AD) is a neurological disorder that creates neurodegenerative changes at several structural and functional levels in human brain tissue. The fractal dimension (FD) is a quantitative parameter that characterizes the morphometric variability of the human brain. In this study, we investigate spherical harmonic-based FD (SHFD), thickness, and local gyrification index (LGI) to assess whether they identify cortical surface abnormalities toward the conversion to AD. We study 33 AD patients, 122 mild cognitive impairment (MCI) patients (50 MCI converters and 29 MCI nonconverters), and 32 healthy controls (HC). SHFD, thickness, and LGI methodology allowed us to perform not only global level but also local level assessments in each cortical surface vertex. First, we found that global SHFD decreased in AD and future MCI converters compared to HC, and in MCI converters compared to MCI nonconverters. Second, we found that local white matter SHFD was reduced in AD compared to HC and MCI mainly in medial temporal lobe. Third, local white-matter SHFD was significantly reduced in MCI converters compared to MCI nonconverters in distributed areas, including the medial frontal lobe. Thickness and LGI metrics presented a reduction in AD compared to HC. Thickness was significantly reduced in MCI converters compared to healthy controls in entorhinal cortex and lateral temporal. In summary, SHFD was the only surface measure showing differences between MCI individuals that will convert or remain stable in the next 4 years. We suggest that SHFD may be an optimal complement to thickness loss analysis in monitoring longitudinal changes in preclinical and clinical stages of AD. Hum Brain Mapp 38:5905-5918, 2017. © 2017 Wiley Periodicals, Inc.
Keywords: Alzheimer's disease; fractal dimension; gyrification index; mild cognitive impairment; spherical harmonics; thickness.
© 2017 Wiley Periodicals, Inc.
Figures
Similar articles
-
White matter signal abnormality quality differentiates mild cognitive impairment that converts to Alzheimer's disease from nonconverters.Neurobiol Aging. 2015 Sep;36(9):2447-57. doi: 10.1016/j.neurobiolaging.2015.05.011. Epub 2015 May 28. Neurobiol Aging. 2015. PMID: 26095760 Free PMC article.
-
Morphological Biomarker Differentiating MCI Converters from Nonconverters: Longitudinal Evidence Based on Hemispheric Asymmetry.Behav Neurol. 2018 Mar 19;2018:3954101. doi: 10.1155/2018/3954101. eCollection 2018. Behav Neurol. 2018. PMID: 29755611 Free PMC article.
-
Frontal atrophy as a marker for dementia conversion in Parkinson's disease with mild cognitive impairment.Hum Brain Mapp. 2019 Sep;40(13):3784-3794. doi: 10.1002/hbm.24631. Epub 2019 May 14. Hum Brain Mapp. 2019. PMID: 31090134 Free PMC article.
-
Structural magnetic resonance imaging for the early diagnosis of dementia due to Alzheimer's disease in people with mild cognitive impairment.Cochrane Database Syst Rev. 2020 Mar 2;3(3):CD009628. doi: 10.1002/14651858.CD009628.pub2. Cochrane Database Syst Rev. 2020. PMID: 32119112 Free PMC article.
-
A review on Alzheimer's disease classification from normal controls and mild cognitive impairment using structural MR images.J Neurosci Methods. 2023 Jan 15;384:109745. doi: 10.1016/j.jneumeth.2022.109745. Epub 2022 Nov 14. J Neurosci Methods. 2023. PMID: 36395961 Review.
Cited by
-
Reduced Cortical Complexity in Cirrhotic Patients with Minimal Hepatic Encephalopathy.Neural Plast. 2020 Mar 18;2020:7364649. doi: 10.1155/2020/7364649. eCollection 2020. Neural Plast. 2020. PMID: 32256557 Free PMC article.
-
Editorial: Recent developments in neuroimaging in mood disorders.Front Psychiatry. 2024 Feb 28;15:1371347. doi: 10.3389/fpsyt.2024.1371347. eCollection 2024. Front Psychiatry. 2024. PMID: 38487582 Free PMC article. No abstract available.
-
Age-associated sex and asymmetry differentiation in hemispheric and lobar cortical ribbon complexity across adulthood: A UK Biobank imaging study.Hum Brain Mapp. 2023 Jan;44(1):49-65. doi: 10.1002/hbm.26076. Epub 2022 Sep 15. Hum Brain Mapp. 2023. PMID: 36574599 Free PMC article.
-
Structural brain morphology in young adult women who have been choked/strangled during sex: A whole-brain surface morphometry study.Brain Behav. 2023 Aug;13(8):e3160. doi: 10.1002/brb3.3160. Epub 2023 Jul 17. Brain Behav. 2023. PMID: 37459254 Free PMC article.
-
Dynamic changes of region-specific cortical features and scalp-to-cortex distance: implications for transcranial current stimulation modeling.J Neuroeng Rehabil. 2021 Jan 4;18(1):2. doi: 10.1186/s12984-020-00764-5. J Neuroeng Rehabil. 2021. PMID: 33397402 Free PMC article.
References
-
- Aguado C, Martínez J, Onís M (2000): Adaptation and validation in Spanish of the abbreviated version of the “Geriatric Depression Scale” (GDS) of Yesavage (in Spanish). Atención Primaria 26:328.
-
- Benjamini Y, Hochberg Y (1995): Controlling the false discovery rate: A practical and powerful approach to multiple testing. J R Stat Soc 57:289–300.
-
- Blanc F, Colloby SJ, Philippi N, De Pétigny X, Jung B, Demuynck C, Phillipps C, Anthony P, Thomas A, Bing F, Lamy J, Martin‐Hunyadi C, O'Brien JT, Cretin B, McKeith I, Armspach JP, Taylor JP (2015): Cortical thickness in dementia with lewy bodies and alzheimer's disease: A comparison of prodromal and dementia stages. PLoS One 10. - PMC - PubMed
-
- Chung MK, Robbins SM, Dalton KM, Davidson RJ, Alexander AL, Evans AC (2005): Cortical thickness analysis in autism with heat kernel smoothing. NeuroImage 25:1256–1265. - PubMed
-
- Dale AM, Fischl B, Sereno MI (1999): Cortical surface‐based analysis. I. Segmentation and surface reconstruction. NeuroImage 9:179–194. http://www.ncbi.nlm.nih.gov/pubmed/9931268. - PubMed
Publication types
MeSH terms
Grants and funding
LinkOut - more resources
Full Text Sources
Other Literature Sources
Medical
