. 2017 Aug 25;49(8):e371.
doi: 10.1038/emm.2017.124.

CCCTC-binding factor is essential to the maintenance and quiescence of hematopoietic stem cells in mice

Affiliations

CCCTC-binding factor is essential to the maintenance and quiescence of hematopoietic stem cells in mice

Tae-Gyun Kim et al. Exp Mol Med. .

Abstract

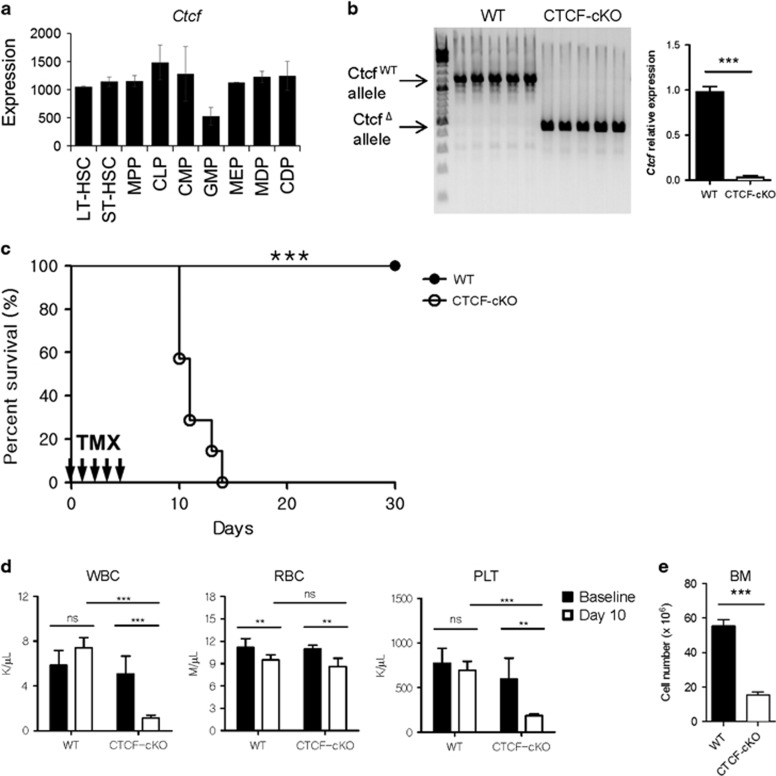
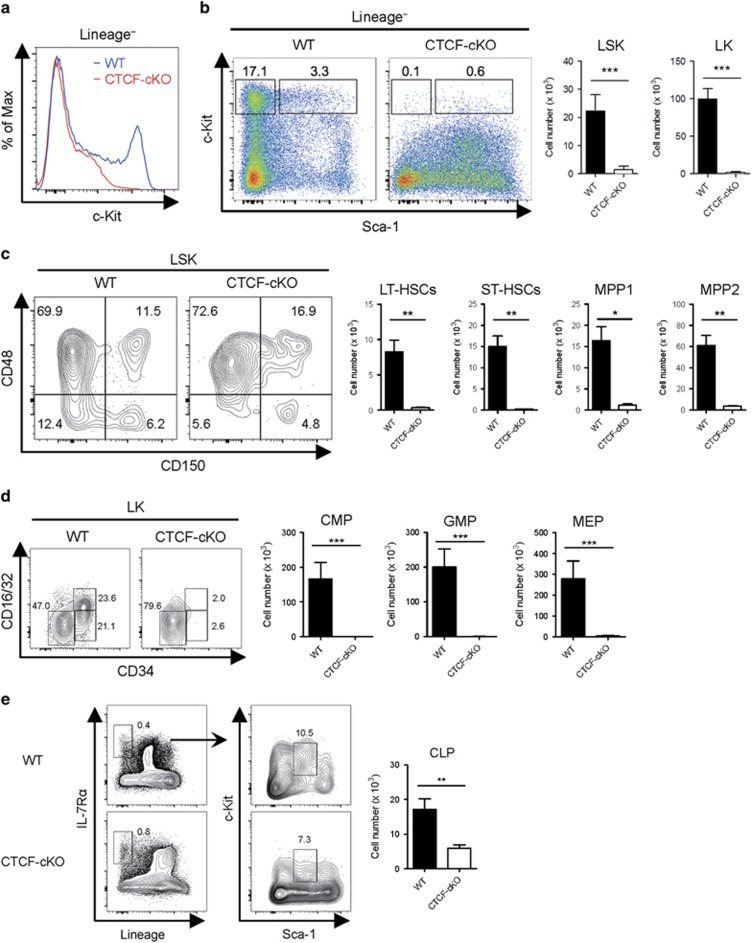
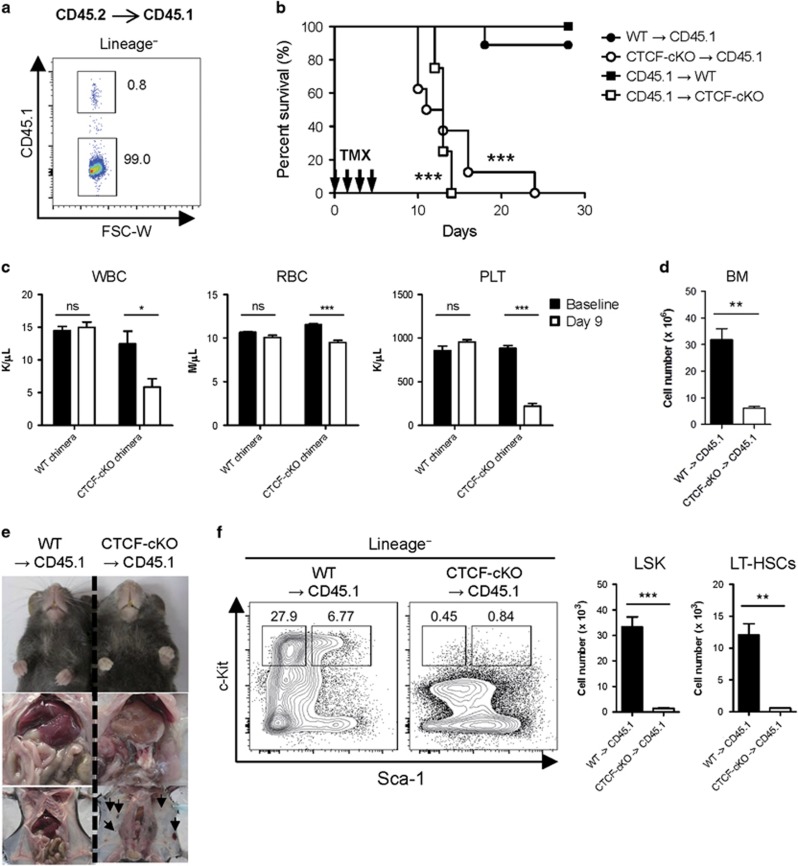
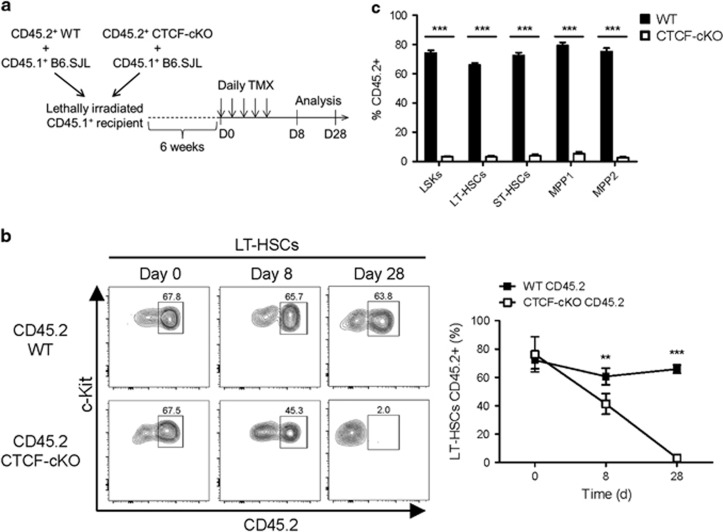
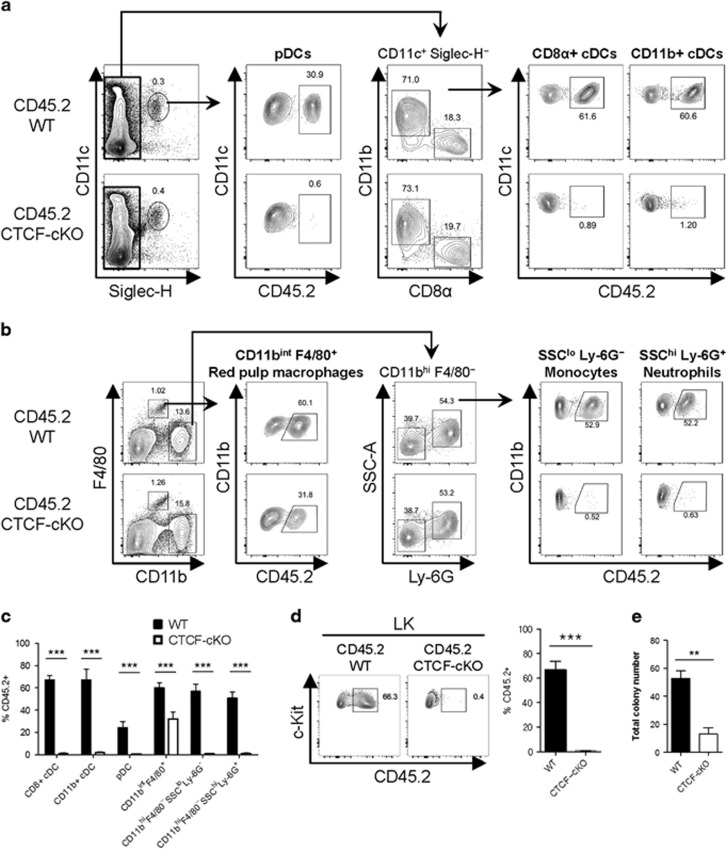
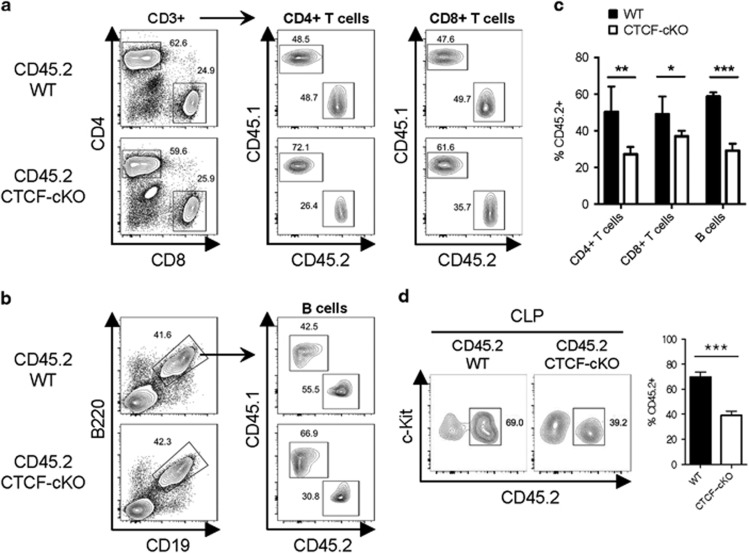
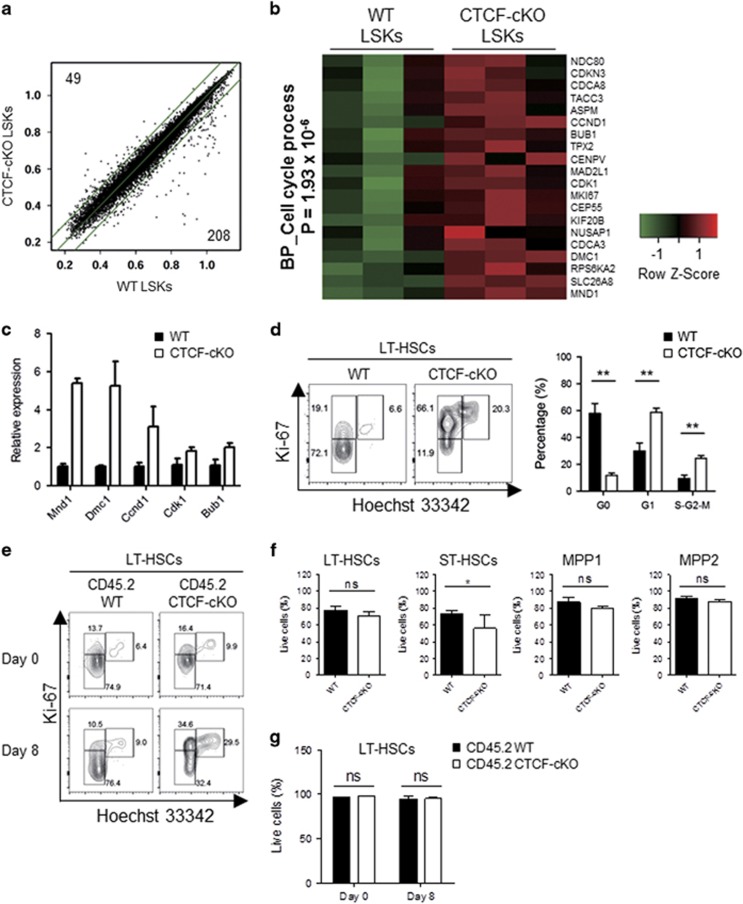
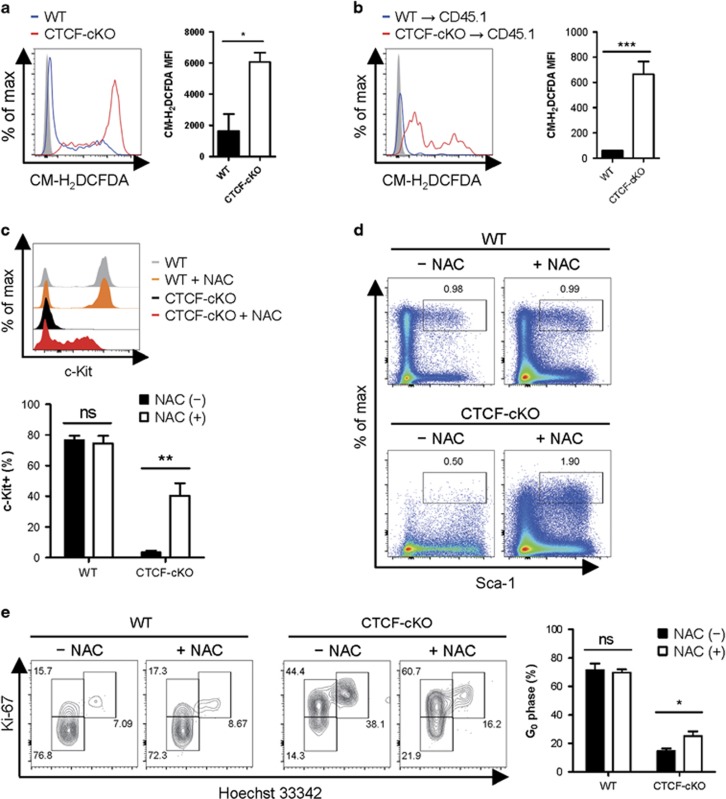
Hematopoiesis involves a series of lineage differentiation programs initiated in hematopoietic stem cells (HSCs) found in bone marrow (BM). To ensure lifelong hematopoiesis, various molecular mechanisms are needed to maintain the HSC pool. CCCTC-binding factor (CTCF) is a DNA-binding, zinc-finger protein that regulates the expression of its target gene by organizing higher order chromatin structures. Currently, the role of CTCF in controlling HSC homeostasis is unknown. Using a tamoxifen-inducible CTCF conditional knockout mouse system, we aimed to determine whether CTCF regulates the homeostatic maintenance of HSCs. In adult mice, acute systemic CTCF ablation led to severe BM failure and the rapid shrinkage of multiple c-Kithi progenitor populations, including Sca-1+ HSCs. Similarly, hematopoietic system-confined CTCF depletion caused an acute loss of HSCs and highly increased mortality. Mixed BM chimeras reconstituted with supporting BM demonstrated that CTCF deficiency-mediated HSC depletion has both cell-extrinsic and cell-intrinsic effects. Although c-Kithi myeloid progenitor cell populations were severely reduced after ablating Ctcf, c-Kitint common lymphoid progenitors and their progenies were less affected by the lack of CTCF. Whole-transcriptome microarray and cell cycle analyses indicated that CTCF deficiency results in the enhanced expression of the cell cycle-promoting program, and that CTCF-depleted HSCs express higher levels of reactive oxygen species (ROS). Importantly, in vivo treatment with an antioxidant partially rescued c-Kithi cell populations and their quiescence. Altogether, our results suggest that CTCF is indispensable for maintaining adult HSC pools, likely by regulating ROS-dependent HSC quiescence.


Conflict of interest statement

The authors declare no conflict of interest.

Figures

Figure 1
Figure 1
Acute systemic CTCF ablation leads to hematopoietic failure. (a) The relative expression levels of Ctcf among various stem/progenitor cells (data from ImmGen). (b) WT and CTCF-cKO mice were treated with TMX for 5 consecutive days, and genomic DNA and total RNA from the BM were isolated at day 8. Efficient Ctcf deletion by TMX treatment in CTCF-cKO mice at the DNA (left) and the RNA (right) levels is shown. (c) Kaplan–Meier curves plotting the survival of WT and CTCF-cKO mice (n=10) are shown. (d) Peripheral blood counts of control and CTCF-cKO mice at baseline and 10 days after the first TMX injection (n=4−5). (e) Bone marrow counts (femurs and tibiae) of WT and CTCF-cKO mice 8 days after TMX treatment (n=5). Data are from at least three independent experiments with four or five mice per group. Error bars indicate the standard error of the mean (s.e.m.). **P<0.01; ***P<0.001; ns, not significant.
Figure 2
Figure 2
Acute systemic depletion of CTCF results in severe decreases in c-Kithi stem/progenitor cell numbers. (a, b) The surface levels of c-Kit in lineage cells (a) and the frequencies and absolute numbers of LSK (lineageSca-1+c-Kithi) and LK (lineageSca-1c-Kithi) cells (b) from WT and CTCF-cKO mice at 8 days after TMX injection. (c) The frequencies and absolute number of LT-HSCs (CD150+CD48), ST-HSCs (CD150CD48), MPP1 (CD150+CD48+) and MPP2 (CD150CD48+) populations among LSKs are shown. (d) FACS analysis with cell numbers of CMP (CD34+CD16/32), GMP (CD34+CD16/32+) and MEP (CD34CD16/32) among the LK population are shown. (e) FACS analysis and quantitation of CLP. Data are from at least three independent experiments with three or four mice per group. Error bars indicate the s.e.m. *P<0.05; **P<0.01; ***P<0.001. FACS, fluorescence-activated cell sorting; GMP, granulocyte-macrophage progenitors; ST-HSC, short-term HSC.
Figure 3
Figure 3
CTCF loss in the hematopoietic system leads to severe BM failure and consequent lethality. (a) The efficiency of chimerism was analyzed in lineage-negative BM cells from CD45.1+ recipients transplanted with CD45.2+ donor BM. (b) Kaplan–Meier curves plotting the survival of single chimeric mice (n=5–9). Statistical analyses were performed between (1) WT→CD45.1 and CTCF-cKO→CD45.1 and (2) CD45.1→WT and CD45.1→CTCF-cKO. (c) Peripheral blood counts of control and CTCF-cKO→CD45.1 chimeric mice at 9 days after the first TMX injection (n=5). (d) Total BM cellularity for each chimera is shown. (e) Clinical pictures of WT and CTCF-cKO chimeras showing anemic (upper and middle) and spontaneous hemorrhagic (lower) propensities. (f) The frequencies and absolute numbers of LSK and LT-HSCs from WT and CTCF-cKO chimeras at 8 days after TMX injection. Data are from at least two independent experiments with three or four mice per group. Error bars indicate the s.e.m. *P<0.05; **P<0.01; ***P<0.001; ns, not significant.
Figure 4
Figure 4
CTCF deficiency-mediated HSC depletion has both cell-non-autonomous and cell-autonomous effects. (a) The experimental scheme of the generation and the use of mixed BM chimeras. (b) The frequencies of CD45.2+ BM-derived LT-HSCs from the TMX-treated mixed chimeric mice. (c) Multiple early progenitor cells from the TMX-treated mixed chimeric mice at day 28 are shown. Data are from two or three independent experiments with four or five mice per group. Error bars indicate the s.e.m. ***P<0.001.
Figure 5
Figure 5
The loss of CTCF results in the exhaustion of myeloid progenitors and their differentiation. (a and b) Gating strategies for dendritic cells (a), red pulp macrophages, monocytes, and neutrophils (b) in the spleen at day 28 are shown. (c) The frequencies of CD45.2+ BM-derived myeloid lineage cells from the spleen of TMX-injected mixed chimeric mice are shown. (d) The proportion of CD45.2+ BM-derived LK cells is shown. (e) The number of total colonies from WT and CTCF-cKO mice cultured in methylcellulose medium supplemented with myeloid-driving factors over 9 days. Data are from at least three independent experiments with four or five mice per group. Error bars indicate the s.e.m. **P<0.01; ***P<0.001.
Figure 6
Figure 6
CLP-derived lymphoid differentiation is less sensitive to CTCF depletion. (a and b) Gating strategies for T cells (a) and B cells (b) in the spleen at day 28 are shown. (c) The frequencies of CD45.2+ BM-derived lymphoid lineage cells from the spleens of TMX-treated mixed chimeric mice are shown. (d) The proportion of CD45.2+ BM-derived CLPs is shown. Data are from at least three independent experiments with four or five mice per group. Error bars indicate the s.e.m. *P<0.05; **P<0.01; ***P<0.001.
Figure 7
Figure 7
CTCF deficiency leads to an augmented cell cycle progression in HSCs. (a) LSKs were sorted 24 h after the last TMX treatment. Scatter plots show the raw expression levels (log2), and the number of genes that exhibited greater than two-fold increases in WT (lower) and CTCF-cKO (upper) LSKs with a P-value of less than 0.05 is indicated. Outer green lines indicate the two-fold boundary. (b) Heat map showing the genes that belong to the cell cycle biological process as revealed by the Gene Ontology analysis. (c) The expression levels of the selected genes from (b) were confirmed by real-time quantitative PCR. (d) Ki-67/Hoechst-based cell cycle analysis of LT-HSCs from WT and CTCF-cKO mice at 8 days after TMX treatment. (e) Cell cycle assay of LT-HSCs from the mixed BM chimeric mice at days 0 and 8 after initiating TMX treatment. (f and g) Apoptosis profiles of multiple HSCs in non-chimeric (f) and mixed BM chimeric mice (g) 8 days after TMX treatment. Data are from at least two or three independent experiments with four or five mice per group. Error bars indicate the s.e.m. *P<0.05; **P<0.01.
Figure 8
Figure 8
CTCF maintains the c-Kithi HSC pool and quiescence in a ROS-dependent manner. (a and b) Intracellular ROS levels were measured using CM-H2DCFDA from TMX-treated straight cKO mice (a) and chimeric mice (b) at 8 days after starting TMX treatment. The MFI of the ROS levels was calculated. (c) The percentage of the c-Kit+ population in the LinSca-1+CD150+CD48 cell population in the indicated experimental group is shown. (d) The representative flow cytometry plots of the lineage population in WT and CTCF-cKO mice at 8 days after inducing CTCF depletion by TMX with or without NAC treatment. (e) Cell cycle analysis of LT-HSCs from WT and CTCF-cKO mice treated with the same conditions as in d. Data are from two independent experiments with three to five mice per group. Error bars indicate the s.e.m. *P<0.05; **P<0.01; ***P<0.001. MFI, mean fluorescence intensity; ns, not significant.

Similar articles

Cited by

References

    1. Orkin SH, Zon LI. Hematopoiesis: an evolving paradigm for stem cell biology. Cell 2008; 132: 631–644. - PMC - PubMed
    1. Wilson A, Trumpp A. Bone-marrow haematopoietic-stem-cell niches. Nat Rev Immunol 2006; 6: 93–106. - PubMed
    1. Wilson NK, Foster SD, Wang X, Knezevic K, Schutte J, Kaimakis P et al. Combinatorial transcriptional control in blood stem/progenitor cells: genome-wide analysis of ten major transcriptional regulators. Cell Stem Cell 2010; 7: 532–544. - PubMed
    1. Bigas A, Espinosa L. Hematopoietic stem cells: to be or Notch to be. Blood 2012; 119: 3226–3235. - PubMed
    1. Bigas A, Guiu J, Gama-Norton L. Notch and Wnt signaling in the emergence of hematopoietic stem cells. Blood Cells Mol Dis 2013; 51: 264–270. - PubMed

Publication types