

Genetic and environmental architecture of executive functions in midlife
- PMID: 28857599
- PMCID: PMC5814340
- DOI: 10.1037/neu0000389
Genetic and environmental architecture of executive functions in midlife
Abstract
Objective: Research on executive functions (EFs) has revealed evidence for general abilities that underlie performance across multiple EF tasks and domains. This Common EF factor is highly stable in adolescence through young adulthood, correlates with other important cognitive abilities, and is explained largely by genetic influences. However, little is known about Common EF beyond young adulthood. This study examines 3 hypotheses regarding the latent structure, genetic/environmental etiology, and cognitive correlates of Common EF in middle age.
Method: We examined data from 1,284 middle-aged twins (51-60 years) in the Vietnam Era Twin Study of Aging who completed 7 neuropsychological measures of EFs, as well as measures of general cognitive ability and processing speed.
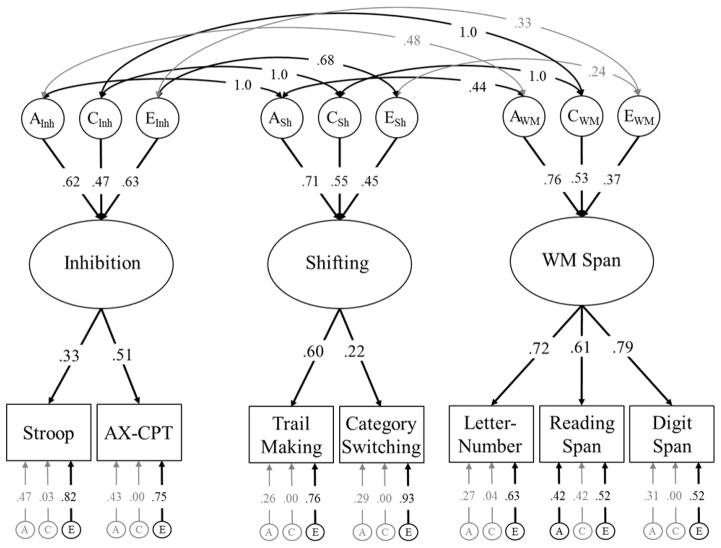
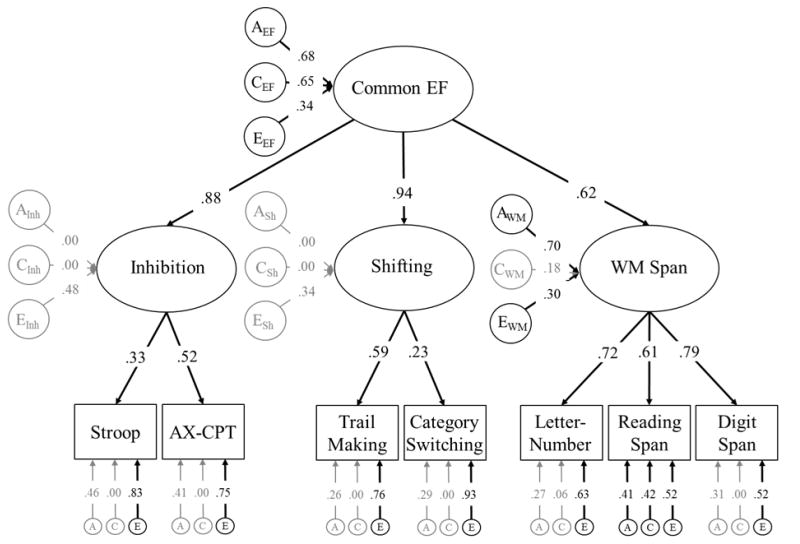
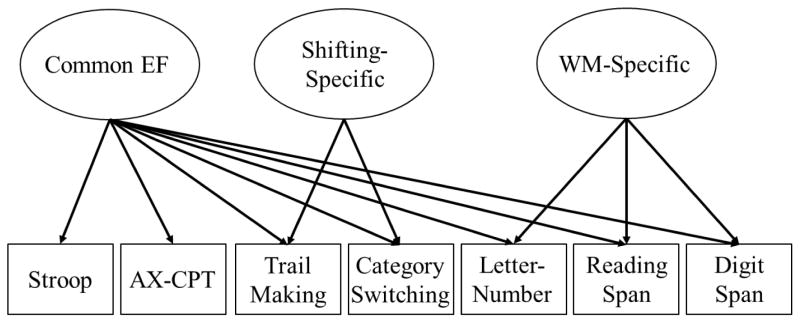
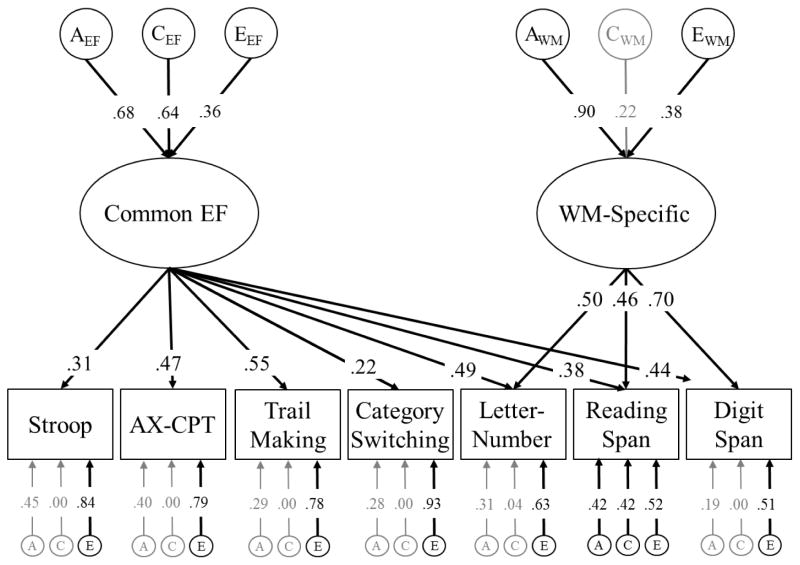
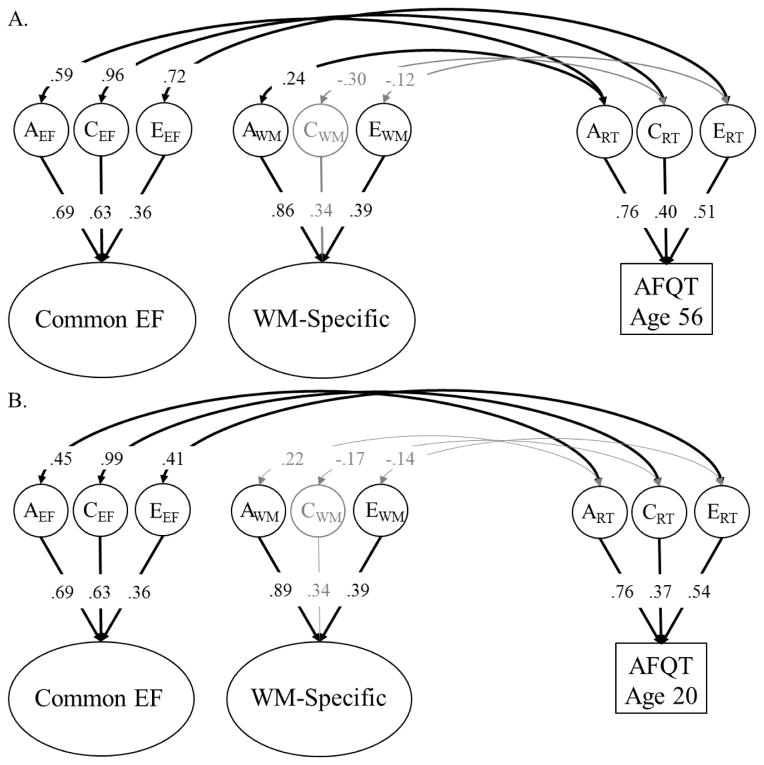
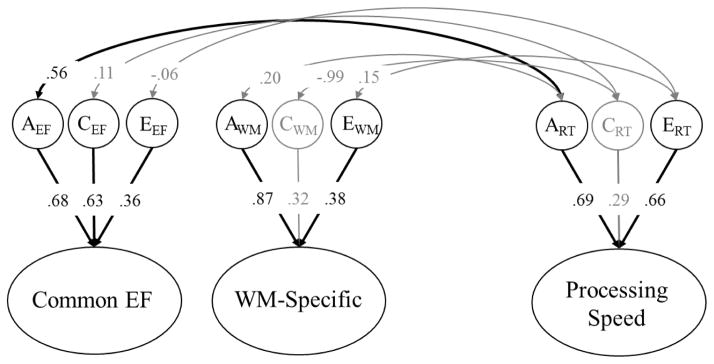
Results: Our confirmatory factor analysis indicated that Common EF explained variation across all 7 EF tasks. Inhibition and shifting were subsumed entirely under the Common EF factor, and there was an additional working memory span-specific factor. Common EF was heritable in midlife (a2 = .46), with additional evidence for both shared environmental influences (c2 = .41) and nonshared environmental influences (e2 = .13). Higher Common EF was moderately associated with higher general cognitive ability, measured both in early adulthood and midlife, and faster processing speed in midlife. These correlations were primarily driven by shared genetic influences.
Conclusions: These results support the hypothesis that Common EF captures similar EF abilities in midlife as in adolescence and young adulthood. However, environmental influences may explain a larger portion of variance in this construct as individuals age. (PsycINFO Database Record
(c) 2018 APA, all rights reserved).
Figures
Similar articles
-
Integrating verbal fluency with executive functions: Evidence from twin studies in adolescence and middle age.J Exp Psychol Gen. 2019 Dec;148(12):2104-2119. doi: 10.1037/xge0000589. Epub 2019 Mar 21. J Exp Psychol Gen. 2019. PMID: 30896200 Free PMC article.
-
Stability of genetic and environmental influences on executive functions in midlife.Psychol Aging. 2018 Mar;33(2):219-231. doi: 10.1037/pag0000230. Psychol Aging. 2018. PMID: 29658745 Free PMC article.
-
Stability and change in executive function abilities from late adolescence to early adulthood: A longitudinal twin study.Dev Psychol. 2016 Feb;52(2):326-40. doi: 10.1037/dev0000075. Dev Psychol. 2016. PMID: 26619323 Free PMC article.
-
Immediate and long-term efficacy of executive functions cognitive training in older adults: A systematic review and meta-analysis.Psychol Bull. 2019 Jul;145(7):698-733. doi: 10.1037/bul0000196. Epub 2019 Apr 18. Psychol Bull. 2019. PMID: 30998045
-
Unity and diversity of executive functions: Individual differences as a window on cognitive structure.Cortex. 2017 Jan;86:186-204. doi: 10.1016/j.cortex.2016.04.023. Epub 2016 May 10. Cortex. 2017. PMID: 27251123 Free PMC article. Review.
Cited by
-
Integrating verbal fluency with executive functions: Evidence from twin studies in adolescence and middle age.J Exp Psychol Gen. 2019 Dec;148(12):2104-2119. doi: 10.1037/xge0000589. Epub 2019 Mar 21. J Exp Psychol Gen. 2019. PMID: 30896200 Free PMC article.
-
Lower general executive function is primarily associated with trait worry: A latent variable analysis of negative thought/affect measures.Emotion. 2020 Jun;20(4):557-571. doi: 10.1037/emo0000584. Epub 2019 Feb 28. Emotion. 2020. PMID: 30816740 Free PMC article.
-
Genetic and Environmental Associations Among Executive Functions, Trait Anxiety, and Depression Symptoms in Middle Age.Clin Psychol Sci. 2019 Jan;7(1):127-142. doi: 10.1177/2167702618805075. Epub 2018 Nov 13. Clin Psychol Sci. 2019. PMID: 30923645 Free PMC article.
-
Cognition and action: a latent variable approach to study contributions of executive functions to motor control in older adults.Aging (Albany NY). 2021 Jun 24;13(12):15942-15963. doi: 10.18632/aging.203239. Epub 2021 Jun 24. Aging (Albany NY). 2021. PMID: 34166223 Free PMC article.
-
How Well Does Subjective Cognitive Decline Correspond to Objectively Measured Cognitive Decline? Assessment of 10-12 Year Change.J Alzheimers Dis. 2021;83(1):291-304. doi: 10.3233/JAD-210123. J Alzheimers Dis. 2021. PMID: 34308902 Free PMC article.
References
-
- Bayroff AG, Anderson AA. Development of Literacy Screening Scales for AFQT 7 and 8 Failures. Washington DC: 1963.
-
- Bollen K. Structural equations with latent variables. New York: John Wiley; 1989. pp. 612–621.
-
- Braver TS, Barch DM, Keys BA, Carter CS, Cohen JD, Kaye JA, … Reed BR. Context processing in older adults: Evidence for a theory relating cognitive control to neurobiology in healthy aging. Journal of Experimental Psychology: General. 2001;130:746–763. - PubMed
Publication types
MeSH terms
Grants and funding
LinkOut - more resources
Full Text Sources
Other Literature Sources
Medical
Miscellaneous
