. 2017 Aug 31:6:e28034.
doi: 10.7554/eLife.28034.

Principles of cellular resource allocation revealed by condition-dependent proteome profiling

Affiliations

Principles of cellular resource allocation revealed by condition-dependent proteome profiling

Eyal Metzl-Raz et al. Elife. .

Abstract

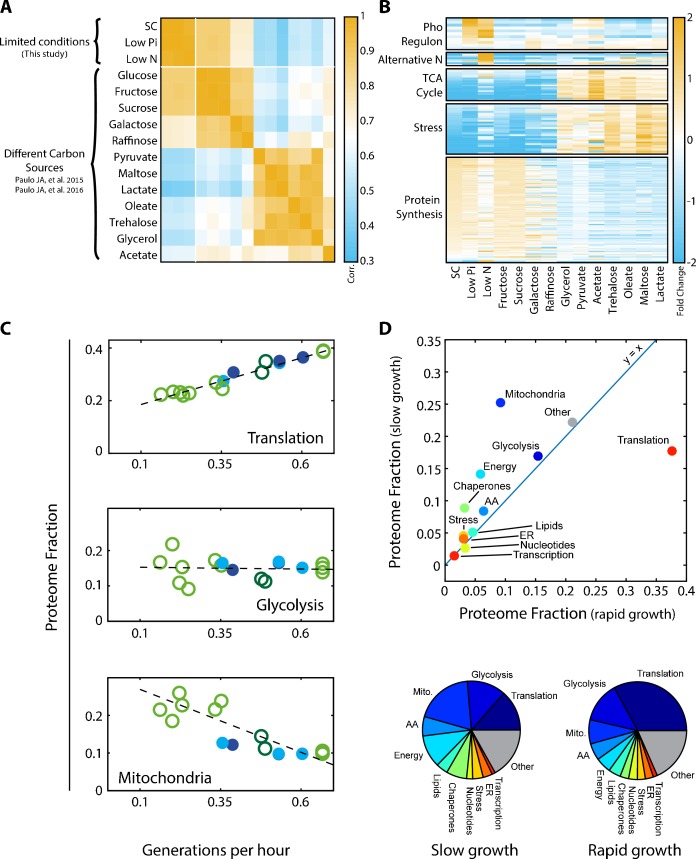
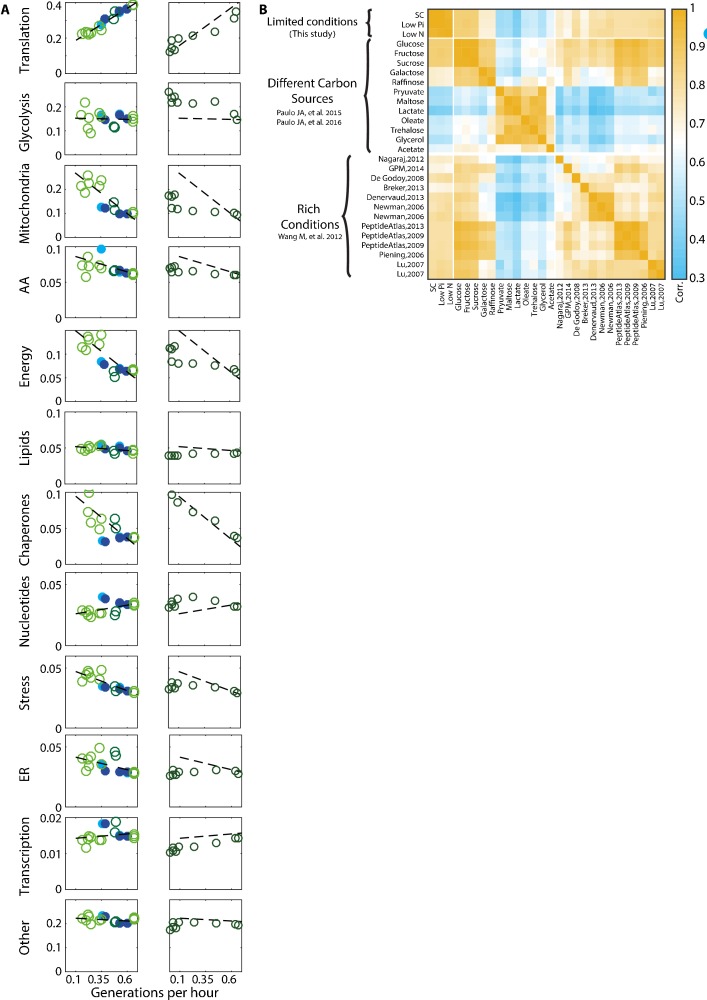
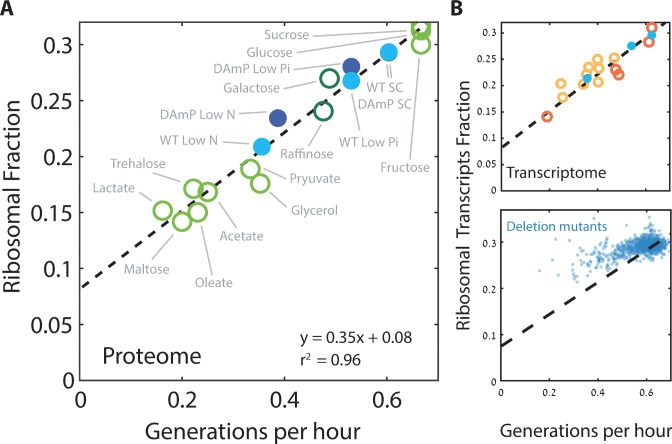
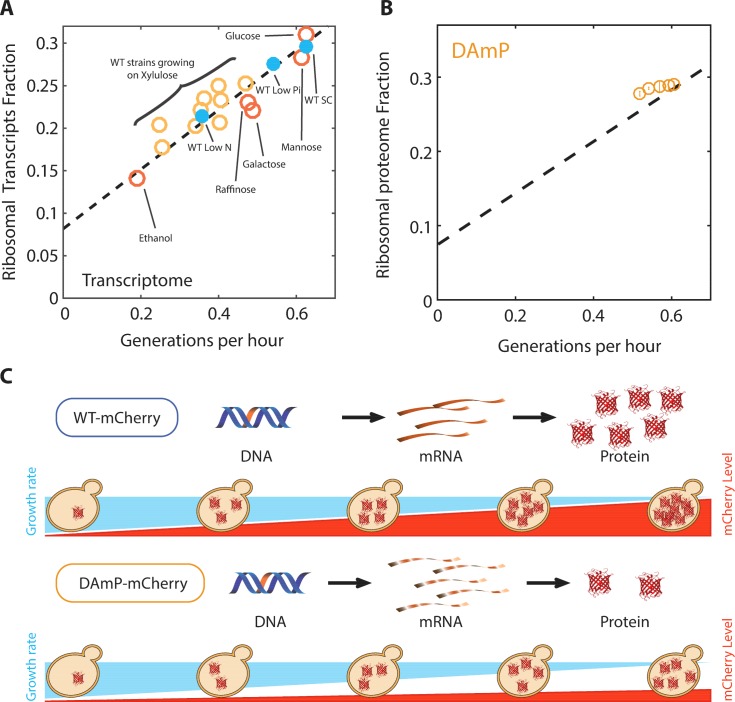
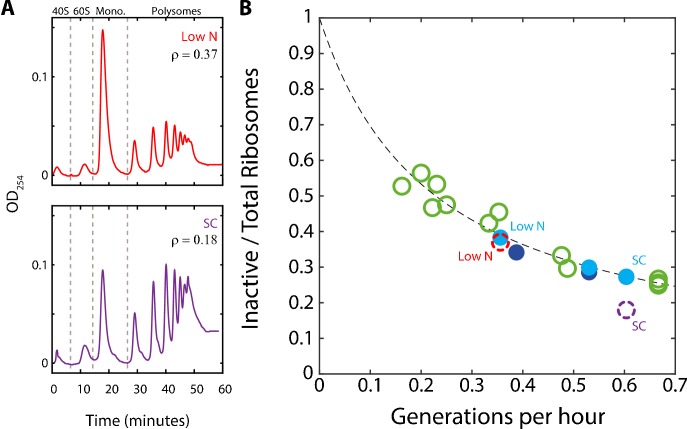
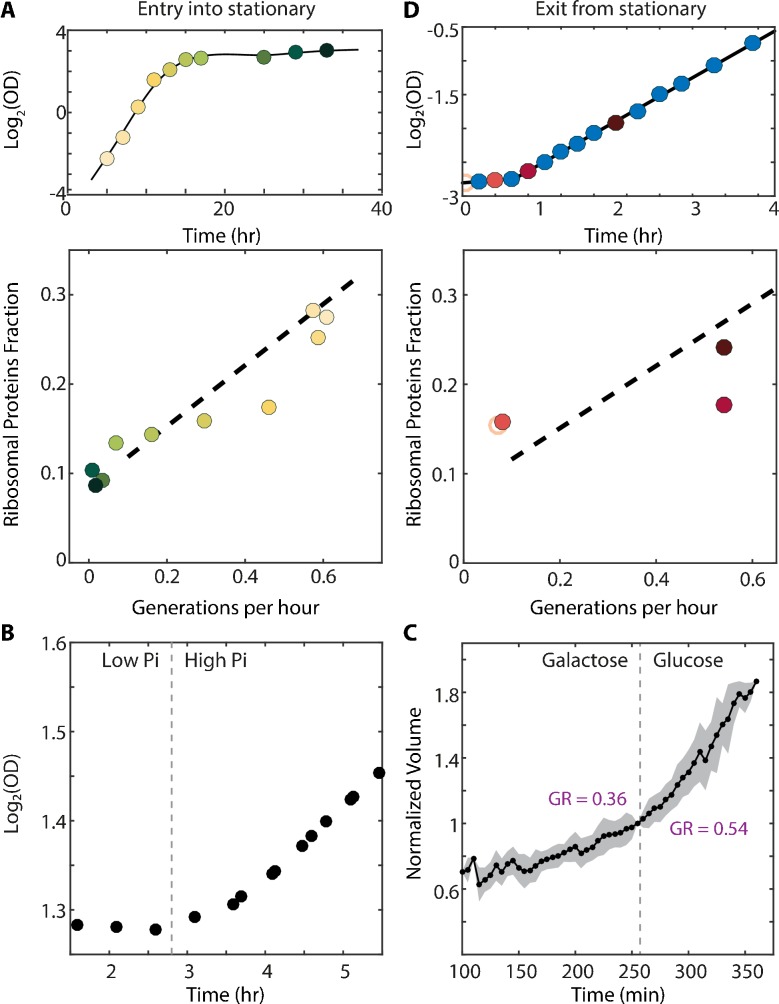
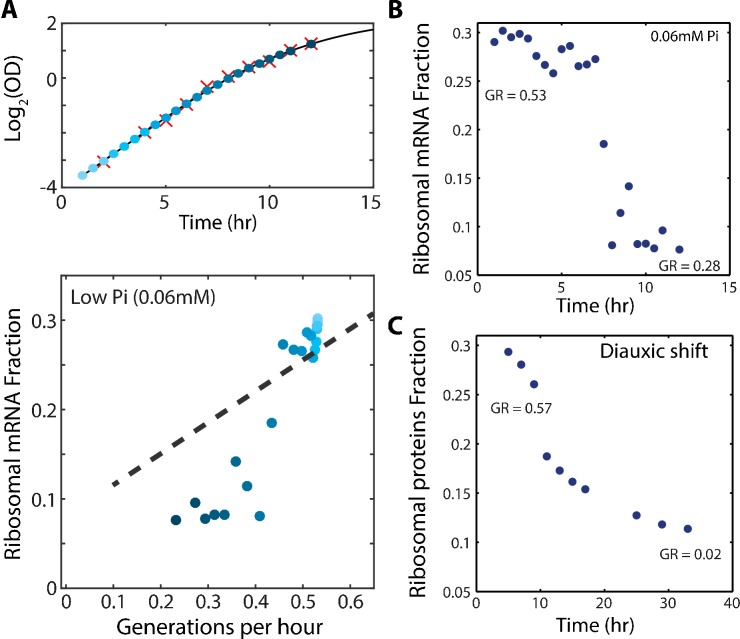
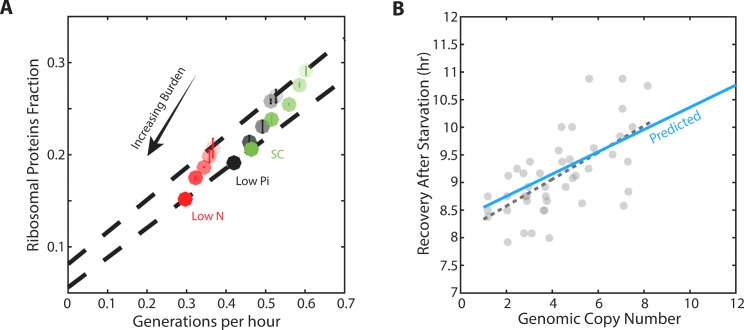
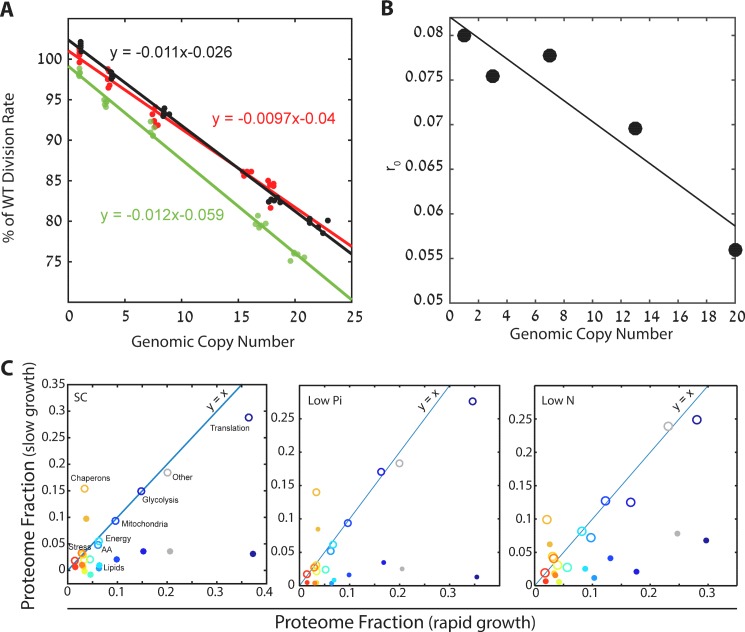
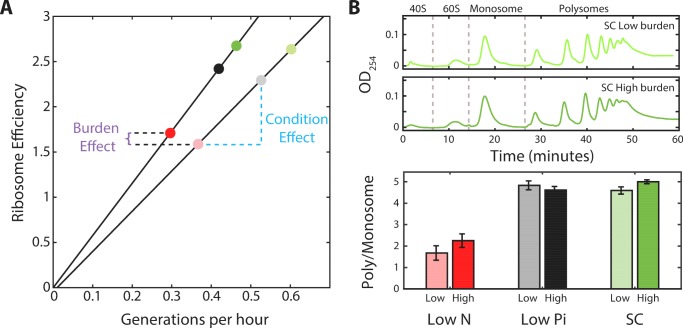
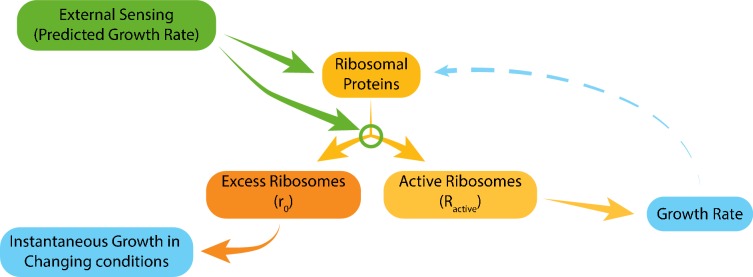
Growing cells coordinate protein translation with metabolic rates. Central to this coordination is ribosome production. Ribosomes drive cell growth, but translation of ribosomal proteins competes with production of non-ribosomal proteins. Theory shows that cell growth is maximized when all expressed ribosomes are constantly translating. To examine whether budding yeast function at this limit of full ribosomal usage, we profiled the proteomes of cells growing in different environments. We find that cells produce excess ribosomal proteins, amounting to a constant ≈8% of the proteome. Accordingly, ≈25% of ribosomal proteins expressed in rapidly growing cells does not contribute to translation. Further, this fraction increases as growth rate decreases and these excess ribosomal proteins are employed when translation demands unexpectedly increase. We suggest that steadily growing cells prepare for conditions that demand increased translation by producing excess ribosomes, at the expense of lower steady-state growth rate.

Keywords: S. cerevisiae; cell biology; computational biology; proteome; resource allocation; ribosomes; systems biology; transcription; translation.


Conflict of interest statement

Senior editor, eLife.

No competing interests declared.

Figures

Figure 1.
Figure 1.. Proteomic analysis of budding yeast grown in different conditions.
(A) Proteome profiles in our dataset clusters into two main groups on their fermentative or respiratory growth mode: Shown is the Pearson correlation matrix between proteome compositions in the indicated conditions. (B) Condition-dependent regulation of protein expression: The expression of each protein in each condition was normalized by its mean expression over all conditions. Shown is the (Log2) protein expression of proteins in the indicated groups. See Supplementary file 2 for protein names. (C) Expression of translation genes decreases in slow-growing cells: Proteins were classified into eleven groups by function, which together included ≈80% of the proteome. For each condition, we calculated the fraction of the proteome coding for each of these eleven groups. Shown here are the proteome fractions of groups composed of proteins involved in translation, glycolysis or mitochondrial function, plotted as a function of Generations per Hour (generation time−1 = µ/ln(2)). Additional protein groups are shown in Figure 1—figure supplement 1A. Filled circles correspond to data obtained in this work while empty circles are data from Paulo et al. (2015), , as specified in Figure 2A. The proteins assigned to each protein group are specified in Supplementary file 1. Dashed lines are the data’s linear fits. Note that the translation group slope (y = 0.36x + 0.15) is almost identical to the ribosomal group slope (Figure 2A). (D) The overall proteome composition in fast vs. slow growing cells: The fraction of proteome encoding for each protein group was compared between the fast and slow growth condition in our dataset. In the upper panel, the proteome fraction encoding each specified protein group is plotted as a function of this group in the slow growing condition. Fast growth (0.67 gen/hr) corresponds to standard (SC) conditions, while slow growth (0.15 gen/hr) is extrapolated from the linear fit of the abundance vs. growth rate relation, shown in Figure 1C and Figure 1—figure supplement 1A. In the bottom panel, the same data is plotted as pie-charts.
Figure 1—figure supplement 1.
Figure 1—figure supplement 1.. Proteome composition.
(A) The proteome composition under different conditions: Left column - proteome composition of all protein groups analyzed as indicated in Figure 1C. Right column – same protein groups as in the left column, with each circle representing a time-point along the growth curve as described in Figure 4A. (B) Correlation between proteome profiles of cells growing in different conditions: Pearson correlation matrix as in Figure 1A, including all rich condition proteomic datasets used in this study.
Figure 2.
Figure 2.. Ribosome content scales linearly with cell growth rate.
(A) Shown is the fraction of the proteome coding for the ribosomal proteins in each condition as a function of cell growth rate. Note that here and henceforth, growth rate is shown in units of generation per hour (Generation Time−1) which is related to the specific growth rate μ by a scaling factor, μ = GT−1*ln(2). The slope of this scaling curve is = 0.35×60 min=21 min so Δr/Δµ = 21/ln(2)[min]. For a broader definition of the translational group, see Figure 1C top panel and Supplementary file 1 for gene names. Our data (filled circles) is generated from three biological repeats. (B) The transcriptome fraction coding ribosomal proteins scales with growth rate: Shown on top is the fraction of the ribosomal protein transcripts from the full transcriptome as a function of cell growth rate. Conditions are specified in Figure 2—figure supplement 1A. Dotted black line is the linear fit from (A). Note the high agreement between the transcriptomic data and the proteomic linear fit, implying that on average, the translation-to-degradation of ribosomal proteins is the same as that of other proteins (primarily highly abundant ones). The bottom figure shows that this scaling is lost when comparing growth-affecting mutations. Mutant data was taken from Kemmeren et al. (2014) and O'Duibhir et al. (2014).
Figure 2—figure supplement 1.
Figure 2—figure supplement 1.. The proteome profiles of budding yeast cells growing in different conditions.
(A) Same as Figure 2B top, specifying the condition. (B) Ribosomal proteome fraction from cells forced to transcribe unstable DAmP transcripts are shown (Kafri et al., 2016b). Error bars represent the standard deviation around the median between three biological repeats. (C) Generation of libraries of burdened cells. See Kafri et al. (2016b).
Figure 3.
Figure 3.. A substantial fraction of ribosomes is not actively translating at a given time.
(A) Estimating the fraction of inactive ribosomes using polysomal profiling: Cells were grown in the indicated conditions and their ribosomal content was analyzed on sucrose gradients as an indication for translational activity. Representative profiles of raw data are shown. The fraction of inactive ribosomes was estimated by the ratio (ρ) of monosomes (mRNAs bound by a single ribosome), the 40S and 60S, to the total ribosome density and is plotted in (B) in corresponding colors (dashed circles). (B) The fraction on inactive ribosomes increases with decreasing growth rate: Shown is the estimated fraction of inactive ribosomes (Y = 0.08/(0.35X + 0.08)) for each condition, as a function of cell generations per hour. Conditions as specified in Figure 2A. Dashed circles represent the inactive/total ribosomes ratio (ρ) calculated in (A) from three independent experiments.
Figure 4.
Figure 4.. The scaling between ribosome content and growth rate changes when balanced growth is perturbed.
(A) The scaling between ribosome content and growth rate changes when cells prepare to enter stationary phase: Cells grown in batch culture were followed as they increase in density (top panel), and were subjected to proteome profiling at the indicated times. The bottom panel shows the fraction of proteome coding for ribosomal proteins along this time course. Data taken from Murphy et al. (2015). Color gradient from light to dark represents increasing time. (B) Cells growing in a phosphate-limited chemostat increase their growth rate immediately upon phosphate addition: Continuous cultures were grown to steady state in a phosphate-limited chemostat at a dilution rate of 4.5 hr/gen. Media containing high phosphate was then injected into the growth chamber (dotted line). Shown is the density (OD) of the culture before and after phosphate injection. (C) Cells increase their volume growth immediately upon transfer to a preferred carbon source: Cells were imaged using microfluidics-coupled live-cell microscopy, while their carbon source was changed from galactose to glucose (dotted line). Shown is the cell volume before and after the media change, averaged over 50 cells. Specific growth rate was calculated 25 min before and after the upshift. Error bars represent SEM. (D) Cells exiting stationary phase resume rapid growth before increasing the ribosome content: Cells were grown in SC until saturation (OD600 ≈6) and diluted back into fresh media at time 0 (empty circle). OD measurements were taken every 15–20 min as shown in the top panel and samples for proteomic analysis were taken as indicated. The ribosomal fraction, as calculated from the proteomic data, is shown in the bottom panel as a function of cell growth rate. Each point is the median of three biological repeats.
Figure 4—figure supplement 1.
Figure 4—figure supplement 1.. The scaling between ribosome content and growth rate changes when balanced growth is perturbed.
(A) The fraction of the transcriptome encoding ribosomal proteins in cells growing in low phosphate: Exponentially growing cells in SC media were diluted into low phosphate media (0.06 mM). Samples were taken for OD measurements only (red marks, top panel) or OD measurements together with RNA samples (blue circles, top panel). The bottom panel shows the ribosomal fraction as calculated from the transcriptomic data from samples of the corresponding color in growth curve. (B) Ribosomal expression data as in (A) plotted as a function of time. (C) Proteomic ribosomal data as in Figure 4A plotted as a function of time.
Figure 5.
Figure 5.. Forcing unneeded protein production reduces the pool of free ribosomes.
(A) Scaling of ribosomal proteins with growth rate in protein-burdened strains: Five strains expressing increasing amounts of mCherry proteins were generated and their proteome profiles and growth rates were measured in the three indicated conditions. Shown is the proteome fraction coding for ribosomal proteins in each strain and in each condition as a function of the cell growth rate. Different strains are indicated by the different shades of colors, with increased burden corresponding to a darker circle. Colors indicate the specific condition used. The two dashed lines correspond to the scaling curves defined by the no-burden and most highly-burdened strains: The top line is the same as in Figure 2A, while the bottom line describes the ribosome content of the highest burden as a function of its growth rate in the different conditions. Error bars represent the standard deviation around the median between three biological repeats. (B) The reduced pool of inactive ribosome in the burden cells quantitatively accounts for their delayed exit from starvation: Cells expressing different amounts of mCherry proteins were grown to saturation. The cells were kept in stationary for a week before diluting them back to fresh media. Recovery times (Y axis) were defined by the time at which cells' optical density increased by 50%. Solid blue line represents the predicted recovery time based on the fold-reduction in free ribosomes, dashed black line is the data’s linear fit. Data is re-plotted and analyzed from Kafri et al. (2016b).
Figure 5—figure supplement 1.
Figure 5—figure supplement 1.. Cells forced to produce unneeded proteins have a smaller pool of excess ribosomes.
(A) Relative growth rates of burdened cells: The growth effect of mCherry copy number in different conditions is plotted; black low pi, green SC; red low N. Relative growth rate was calculated using competition experiments. See also Kafri et al. (2016b). (B) Excess ribosomes (r0) decrease with burden: The r0 fraction is plotted as a function of mCherry copy number, with a linear fit in black. This fit was used for calculations that took into account r0 of burdened cells. (C) Burden passively impacts the ribosomal proteomic fraction: The fraction of proteome in burdened cells dedicated to the indicated protein group in fast (one mCherry copy) or slow (high burden) growing cells. Slow growth is extrapolated from the linear fit of increasing copy number. Closed circles represent all proteomic data including mCherry amounts; Open circles show only endogenous protein content.
Figure 6.
Figure 6.. The ratio of active to inactive ribosomes remains invariant to protein burden.
(A) The ratio of active to inactive ribosome predicted by proteomic data: Shown is the ratio of active to inactive ribosomes ra/r0, as predicted from our analysis of proteomic data as a function of growth rate in wild-type and high-burden cells. Note that while this ratio decreases with growth rate when comparing the same strain across different conditions, it remains almost invariant to the burden when compared between two strains within the same condition. (B) The ratio of active to inactive ribosomes predicted by polysome profiling: Low and high burden cells were grown in the indicated conditions and their ribosomal content was analyzed on sucrose gradients as an indication for translational activity. Representative profiles of raw data are shown on top. The ratio between the polysomes (active transcripts with more than one ribosome bound) to detached small and large subunits (40S and 60S) together with the monosomes (mRNAs bound by a single ribosome) is shown in a bar graph on bottom. SEM error bars are from three biological independent repeats.
Figure 7.
Figure 7.. Model for ribosome allocation.
Cells tune their ribosome content and ribosome efficiency based on signaling from the environment. Evolutionary tuning of this signaling results in a precise scaling of ribosome content with growth rate during logarithmic growth. Growth-rate dependent feedbacks play a minor role in the tuning of ribosome content or efficiency.

References

    1. Aspden JL, Eyre-Walker YC, Phillips RJ, Amin U, Mumtaz MA, Brocard M, Couso JP. Extensive translation of small open reading frames revealed by Poly-Ribo-Seq. eLife. 2014;3:e03528. doi: 10.7554/eLife.03528. - DOI - PMC - PubMed
    1. Balaban NQ, Merrin J, Chait R, Kowalik L, Leibler S. Bacterial persistence as a phenotypic switch. Science. 2004;305:1622–1625. doi: 10.1126/science.1099390. - DOI - PubMed
    1. Boehlke KW, Friesen JD. Cellular content of ribonucleic acid and protein in Saccharomyces cerevisiae as a function of exponential growth rate: calculation of the apparent peptide chain elongation rate. Journal of Bacteriology. 1975;121:429–433. - PMC - PubMed
    1. Bonven B, Gulløv K. Peptide chain elongation rate and ribosomal activity in Saccharomyces cerevisiae as a function of the growth rate. MGG Molecular & General Genetics. 1979;170:225–230. doi: 10.1007/BF00337800. - DOI - PubMed
    1. Bosdriesz E, Molenaar D, Teusink B, Bruggeman FJ. How fast-growing bacteria robustly tune their ribosome concentration to approximate growth-rate maximization. FEBS Journal. 2015;282:2029–2044. doi: 10.1111/febs.13258. - DOI - PMC - PubMed

MeSH terms