. 2017 Aug 31;9(9):114.
doi: 10.3390/cancers9090114.

Stem Cell-Like Properties of CK2β-down Regulated Mammary Cells

Affiliations

Stem Cell-Like Properties of CK2β-down Regulated Mammary Cells

Eve Duchemin-Pelletier et al. Cancers (Basel). .

Abstract

The ubiquitous protein kinase CK2 has been demonstrated to be overexpressed in a number of human tumours. This enzyme is composed of two catalytic α or α' subunits and a dimer of β regulatory subunits whose expression levels are probably implicated in CK2 regulation. Several recent papers reported that unbalanced expression of CK2 subunits is sufficient to drive epithelial to mesenchymal transition, a process involved in cancer invasion and metastasis. Herein, through transcriptomic and miRNA analysis together with comparison of cellular properties between wild type and CK2β-knock-down MCF10A cells, we show that down-regulation of CK2β subunit in mammary epithelial cells induces the acquisition of stem cell-like properties associated with perturbed polarity, CD44high/CD24low antigenic phenotype and the ability to grow under anchorage-independent conditions. These data demonstrate that a CK2β level establishes a critical cell fate threshold in the control of epithelial cell plasticity. Thus, this regulatory subunit functions as a nodal protein to maintain an epithelial phenotype and its depletion drives breast cell stemness.

Keywords: EMT; breast cancer; epithelial plasticity; protein kinase CK2; stem cell.


Conflict of interest statement

The authors declare no conflict of interest.

Figures

Figure 1
Figure 1
Modulation of miRNAs in ΔCK2β-MCF10A cells. (A) Log2 fold change of the main miRNAs modulated in CK2β-depleted versus parental MCF10A cells measured by miRNA array analysis; (B) Changes of miRNA expression between CK2β-depleted and Mock-MCF10A cells were confirmed by using the indicated TaqMan probes. The relative amount of each miRNAs was determined by cross-normalization to ΔCK2β samples using the comparative method and miR-720 as an internal reference; (C) Two targets of miR-200 and miR-30 families, respectively Zeb1 and integrin β3, were analyzed by Western blot and/or immunofluorescence in Mock- and CK2β-depleted cells. The ratio ΔCK2β/Mock of signal intensity in western blot was determined (3.5 and 2.3 for Zeb1 and integrin β3 respectively). Arrows indicate integrin β3 localization; (D) Integrin β1 and β4, targets of miR-21 were analyzed by western blot and/or immunofluorescence in Mock- and CK2β-depleted cells. The ratio ΔCK2β/Mock of signal intensity in western blot was 0.4 for integrin β1. F-actin in green, nuclei in blue, and integrin β in red. Scale bar, 10 μm.
Figure 2
Figure 2
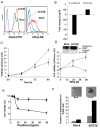
ΔCK2β-MCF10A cells have properties of cancer stem cells(CSCs) and are drug resistant. (A) FACS analysis of CD24 and CD44 markers in in Mock- and ΔCK2β-cells (Blue line, unlabelled cells; green line, Mock-cells; red line, ΔCK2β-cells). Results are representative of three independent experiments; (B) E-cadherin and Vimentin expression levels measured by RT-qPCR. The fold changes compare Mock- to ΔCK2β-cells. p < 0.05; (C) Cell proliferation kinetic of ΔCK2β- (■) and Mock-MCF10A (●); (D) Anoikis: ΔCK2β- (■) and Mock-MCF10A (●) were grown on Poly-HEMA for 48 h. Cell viability was measured with the cell viability-GLO® assay, and apoptosis was visualized by Western blot using anti-PARP antibody; (E) Dose-response curves of ΔCK2β- (■) and Mock-MCF10A cells (●) treated with Paclitaxel. Bars denote the standard error (n = 5); (F) Representative images (top) and quantification (bottom) of mammosphere formation from Mock- and ΔCK2β-cells after first (grey bar) and second (black bar) dissociation steps (scale bar 50 μm).
Figure 3
Figure 3
ΔCK2β- and Mock-MCF10A cell positioning and polarity. (A) Mock and ΔCK2β- MCF10A cells cultured as monolayer (a,b,e,f) or as doublets on H-shaped micropatterns (c,d,g–j) were stained for DNA (blue, a,b,e,f), E-cadherin (red, a–d), F-actin (green, e–h) or paxillin (far red, i,j). Average staining over 20 images on pattern is shown (c,d,g–j). Scale bar, 10 μm; (B) (a) Representative image of doublet cells stained for α-catenin (red), centrosome (green), and DNA (blue) on curved H-shaped micropattern; (b) Time-lapse acquisition of control- and ΔCK2β-MCF10A cell doublets on micropattern was performed. Automated movie analysis of Hoechst-stained cells provided the angular distribution of the nucleus–nucleus axis orientation that is represented by graph; (c) The X coordinate of the normalized nucleus-centrosome vector toward the cell-cell junction was calculated. Horizontal bar graph shows quantification of polarity index as previously described [47]; (C) Confocal images of 3D culture in Matrigel® for nine days, of Mock- and ΔCK2β-MCF10A cells stained for DNA in blue, F-actin in green, and Golgi apparatus in red. Scale bar, 20 μm.
Figure 4
Figure 4
IHC analysis of ΔCK2β- and Mock-MCF10A cells injected in inguinal mammary fate pad. (A) Three months after injection of GFP-transfected Mock- or ΔCK2β-MCF10A cells in mammary fat pad, the glands were harvested, fixed, paraffin included, and sections were stained with anti-GFP (a and b, respectively); (B) High magnification views (40×) of the boxed regions show the staining of GFP (a,e), cytokeratin 5-6 (b,f), cytokeratin 18 (c,g) and αSMA (d,h). Sections were counterstained with hematoxylin; (C) Six weeks post-injection of Mock-cells or ΔCK2β-cells, mammary gland sections were immunostained with human specific Cytokeratin 8/18. Sections were counterstained with Hematoxylin. Pictures are representative of different mammary gland sections injected with Mock-cells (a) or ΔCK2β-cells (b–d). Thin arrows indicate mouse mammary epithelial cells and thick arrows human stained luminal cells. Scale bars, 50 μm.

References

    1. Hanahan D., Weinberg R.A. Hallmarks of cancer: The next generation. Cell. 2011;144:646–674. doi: 10.1016/j.cell.2011.02.013. - DOI - PubMed
    1. Hanahan D., Weinberg R.A. The hallmarks of cancer. Cell. 2000;100:57–70. doi: 10.1016/S0092-8674(00)81683-9. - DOI - PubMed
    1. Kreutzer J.N., Ruzzene M., Guerra B. Enhancing chemosensitivity to gemcitabine via rna interference targeting the catalytic subunits of protein kinase ck2 in human pancreatic cancer cells. BMC Cancer. 2010;10:440. doi: 10.1186/1471-2407-10-440. - DOI - PMC - PubMed
    1. Deshiere A., Duchemin-Pelletier E., Spreux E., Ciais D., Forcet C., Cochet C., Filhol O. Regulation of epithelial to mesenchymal transition: Ck2β on stage. Mol. Cell. Biochem. 2011;356:11–20. doi: 10.1007/s11010-011-0942-y. - DOI - PubMed
    1. Filhol O., Nueda A., Martel V., Gerber-Scokaert D., Benitez M.J., Souchier C., Saoudi Y., Cochet C. Live-cell fluorescence imaging reveals the dynamics of protein kinase ck2 individual subunits. Mol. Cell. Biol. 2003;23:975–987. doi: 10.1128/MCB.23.3.975-987.2003. - DOI - PMC - PubMed