. 2017 Sep;12(9):1980-1998.
doi: 10.1038/nprot.2017.083. Epub 2017 Aug 31.

Optimized retroviral transduction of mouse T cells for in vivo assessment of gene function

Affiliations

Optimized retroviral transduction of mouse T cells for in vivo assessment of gene function

Makoto Kurachi et al. Nat Protoc. 2017 Sep.

Abstract

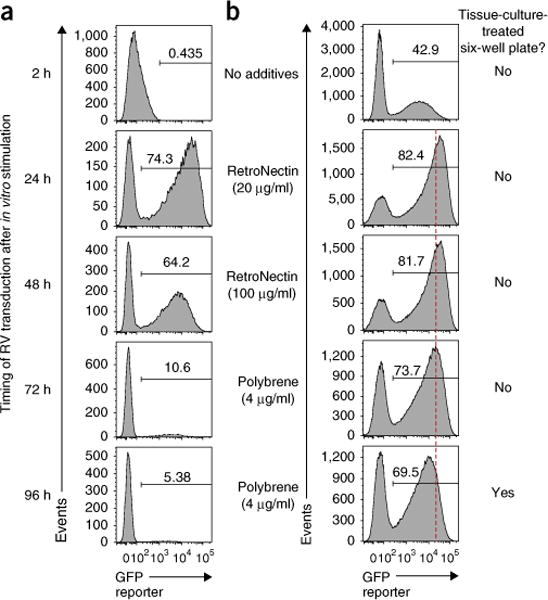
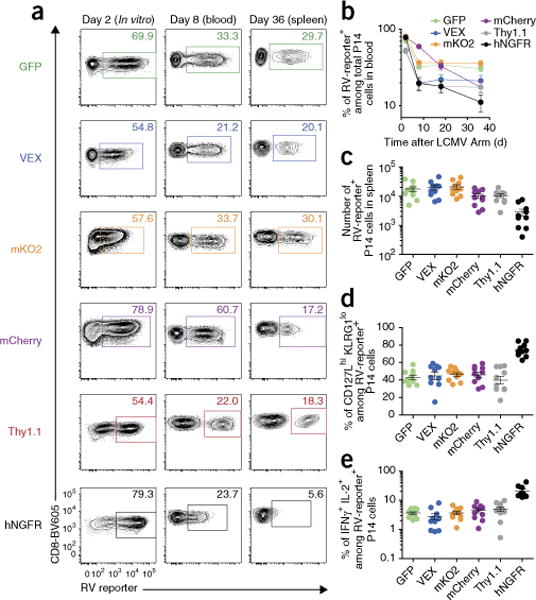
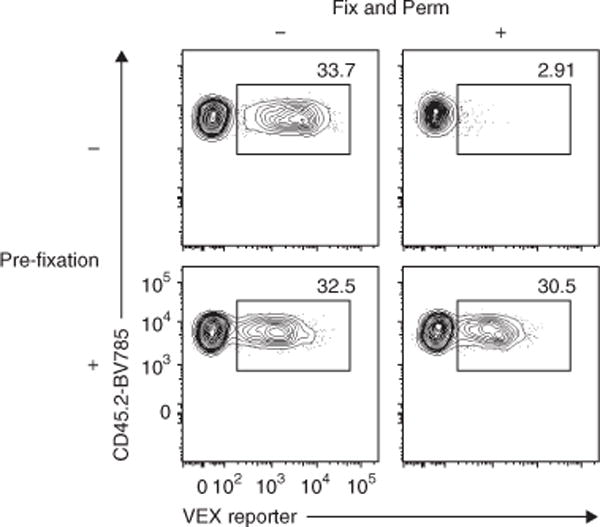
Retroviral (RV) expression of genes of interest (GOIs) is an invaluable tool and has formed the foundation of cellular engineering for adoptive cell therapy in cancer and other diseases. However, monitoring of transduced T cells long term (weeks to months) in vivo remains challenging because of the low frequency and often poor durability of transduced T cells over time when transferred without enrichment. Traditional methods often require additional overnight in vitro culture after transduction. Moreover, in vitro-generated effector CD8+ T cells enriched by sorting often have reduced viability, making it difficult to monitor the fate of transferred cells in vivo. Here, we describe an optimized mouse CD8+ T-cell RV transduction protocol that uses simple and rapid Percoll density centrifugation to enrich RV-susceptible activated CD8+ T cells. Percoll density centrifugation is simple, can be done on the day of transduction, requires minimal time, has low reagent costs and improves cell recovery (up to 60%), as well as the frequency of RV-transduced cells (∼sixfold over several weeks in vivo as compared with traditional methods). We have used this protocol to assess the long-term stability of CD8+ T cells after RV transduction by comparing the durability of T cells transduced with retroviruses expressing each of six commonly used RV reporter genes. Thus, we provide an optimized enrichment and transduction approach that allows long-term in vivo assessment of RV-transduced T cells. The overall procedure from T-cell isolation to RV transduction takes 2 d, and enrichment of activated T cells can be done in 1 h.


Conflict of interest statement

COMPETING FINANCIAL INTERESTS The authors declare no competing financial interests.

Figures

Figure 1
Figure 1
Schematic overview of retroviral transduction experiments in mouse T cells. Overview of in vitro RV transduction of mouse CD8+ T cells (P14 T-cell receptor transgenic (TCR Tg) cells specific for LCMV GP33-41 presented by H-2Db), followed by in vivo adoptive transfer. (Steps 1–28) P14 cells are harvested from the spleen, enriched using a CD8-negative-selection kit, and stimulated with anti-CD3ε and CD28 antibodies in the presence of recombinant human IL-2. (Step 29) On the same day, recipient mice are infected with a model pathogen (here, the LCMV Arm strain was used as acute viral infection model). (Steps 30–51) One day after in vitro stimulation, activated and RV-susceptible P14 cells are enriched by Percoll density centrifugation. (Steps 52–58) Enriched P14 cells are transduced with RV and incubated for 4 h. (Steps 59–67) After incubation, RV-transduced P14 cells are adoptively transferred into the recipient mice. P14 cells have different congenic markers that distinguish donor cells in recipient animals (CD45.2+ to CD45.1+ is shown). (Steps 68–71) An aliquot of RV-transduced P14 cells is maintained in vitro for an additional day and analyzed for RV transduction efficiency. (Steps 72–75) In vivo differentiation of RV-transduced T cells is assessed at multiple time points (e.g., effector expansion, survival and memory or exhaustion differentiation on days 8, 15 and 30, respectively). To enrich RV-transduced cells, the conventional approach is to select RV-positive cells on day 2 using flow sorting or magnetic beads based on an RV reporter such as GFP or Thy1.1 (not shown here).
Figure 2
Figure 2
Enrichment of RV-transduced CD8+ T cells before transfer improves the efficiency of retroviral experiments in vivo. (a) Small-sized ‘resting’ CD8+ T cells are mostly RV-negative. As shown in Figure 1, in vitro-stimulated wild-type P14 cells that were transduced with RV (empty GFP) on day 1 were cultured overnight and analyzed on day 2 (1 d after RV transduction). (b) Density centrifugation with 30 and 60% (vol/vol) Percoll layers enriches activated CD8+ T cells on day 1 (22 h after in vitro stimulation). Flow plots that are gated on 7-AAD-negative CD8-positive population show enrichment step from input (left) to shortly after Percoll separation on day 1 (right middle) and 1 d after (right-most). (c) Graph showing recovery of small- (‘resting’) and large (‘blast’)-size cells in each interface and bottom after Percoll centrifugation. Data are representative of three independent experiments (one technical replicate per experiment). See Supplementary Figure 1 for data from two other experiments. (d) Enrichment by Percoll increases the frequency of RV-transduced CD8+ T cells ~sixfold in vivo. 2 × 10⁴ unenriched or Percoll-enriched P14 cells were adoptively transferred into recipient mice that were infected with LCMV Arm a day before. Flow plots gated on CD8+ P14 cells in vitro at 1 d after RV transduction (left) and in blood at 8 d post infection (d.p.i.) with Arm (right) are shown. (e,f). Percoll enrichment maintains a higher and more stable frequency of RV-transduced CD8+ T cells over time in vivo with LCMV Arm acute (e) and clone 13 chronic (f) infection. Circles and whiskers show mean±s.e.m. Data are representative of two independent experiments (n = 5–10 per group). (g) Percoll minimizes the variance of RV-transduced T cells in vivo. Frequencies of GFP+ cells among P14 cells in spleen at 34 d.p.i. with clone 13 are shown. Bar shows mean ± s.e.m. (n = 9–10 per group). (h,i) Effector and memory differentiation was assessed by CD127 and KLRG1 expression on day 8 (h) and by the percentage of IFNγ+ TNF+ cells upon gp33 peptide re-stimulation (i) on day 46 in Arm infection. Representative plots gated on empty-GFP RV-transduced CD8+ T cells are shown. Bar shows mean±s.e.m. *P < 0.0001 (two-tailed t test). Data are representative of two independent experiments (n = 5–10 per group). All animal experiments depicted in this figure were performed in accordance with the Institute Animal Care and Use Guidelines for the University of Pennsylvania. FS-A, forward scatter–area; FS-H, forward scatter–height; SS-A, side scatter–area.
Figure 3
Figure 3
Reduced cell viability after flow-cytometric sorting leads to instability of transferred T cells in vivo. Wild-type P14 cells that were activated in vitro were transduced with empty-GFP RV on day 1, as depicted in Figure 1. The following day (day 2 after in vitro stimulation), GFP+ P14 cells were enriched by flow-cytometric sorting using the BD ARIA II with a 100-μm nozzle and 20-p.s.i. condition. After sorting, viable cell numbers were carefully determined by 7-AAD and trypan blue staining. As a control, P14 cells without sorting were used, and 1.5 × 10⁵ live cells of each cell type were adoptively transferred into LCMV-Arm-infected recipients. On day 8, expansion of P14 cells was determined in blood. (a) Flow plots showing physical cell size and purity of GFP+ CD8+ cells before and after flow sorting on day 2. Purity of GFP+ CD8+ cells was over 95%. (b) 7-AAD histograms gated on ‘live’ or ‘dying’ cells based on forward scatter (FS) versus side scatter (SS) plot in a, showing that the majority of small cells after sorting are dying. (c) Cell recovery (%) based on the number of total live (trypan blue negative) cells in sorting. (d) Flow plots showing frequencies of P14 cells among total CD8+ cell gate in blood at 8 d.p.i. (e) Graph showing the number of P14 cells per 1 × 10⁶ cells in blood at 8 d.p.i. *P< 0.0005 (two-tailed t test). Data are representative of two experiments (n = 5–15 per group). All animal experiments depicted in this figure were performed in accordance with the institutional animal care and use guidelines of the University of Pennsylvania.
Figure 4
Figure 4
Optimal number of transferred P14 cells in Percoll density enrichment in LCMV Arm infection. Differential numbers of empty-GFP RV-transduced CD45.2+ wild-type P14 cells with or without Percoll enrichment were adoptively transferred into LCMV-Arm-infected CD45.1+ recipient mice as shown in Figure 1. LCMV gp33 antigen-specific CD8+ T cells in the blood were analyzed at day 8 post infection. (a) Representative flow plots gated on gp33-tetramer+ CD8+ T cells. Numbers adjacent to the outlined areas indicate percentage of P14 cells among total gp33-specific CD8+ T cells (top left; black) or percentage of GFP+ cells among total P14 cells (top right; green). (b) Frequency of P14 cells is normalized to endogenous gp33-specific CD8+ T cells in the blood of the same individual mouse. (c) Enhanced in vivo stability of RV-transduced cells using the Percoll approach is independent of the number of transferred P14 cells. Frequencies of GFP+ cells among P14 cells are shown. (d) Numbers of RV-transduced P14 cells per 1 × 10⁶ cells in blood (mean±s.e.m.). Data are representative of two independent experiments (n = 5–10 per group). All animal experiments depicted in Figure 4 were performed in accordance with the institutional animal care and use guidelines of the University of Pennsylvania.
Figure 5
Figure 5
Optimal timing and facilitator for RV transduction to CD8+ T cells. (a,b) Wild-type P14 cells were transduced with empty-GFP RV, at the indicated time after in vitro stimulation in the presence of Polybrene (a), or on day 1 in the absence or presence of Polybrene (4 μg/ml) or RetroNectin (coated at 20 or 100 μg/ml) using six-well plates with or without tissue culture treatment (b), and analyzed for GFP expression 1 d after RV transduction. Plots were gated on live P14 cells. (a) RV transduction efficiency to P14 cells peaks at 24 h after in vitro stimulation. (b) RetroNectin showed better RV transduction efficiency as compared with Polybrene. Data are representative of two independent experiments (duplicate to triplicate per condition).
Figure 6
Figure 6
Comparing the utility of six different RV reporter genes for the study of CD8+ T-cell stability and memory differentiation in vivo. CD45.2+ wild-type P14 cells that were transduced with empty-GFP, VEX, mKO2, mCherry, Thy1.1 or hNGFR RV after Percoll enrichment were adoptively transferred into LCMV-Arm-infected CD45.1+ recipients as shown in Figure 1. (a) Representative flow plots gated on P14 cells showing transduction efficiency on day 2 in vitro (1 d after RV transduction, left), and frequencies of RV-transduced cells on day 8 in blood (center) and on day 36 in the spleen (right). Note that mean fluorescence intensity of hNGFR was already decreased on day 8. (b) Graph showing longitudinal frequencies of RV-reporter+ cells among total P14 cells in blood. (c) Number of RV-transduced P14 cells in the spleen on day 36. (d,e) Memory differentiation was assessed by CD127 and KLRG1 expression (d) and percentage of IFNγ+ IL-2+ cells upon gp33 peptide re-stimulation (e) on day 36. All data in Figure 6 are representative of two independent experiments (n = 9–10 per group). Mean ± s.e.m. All animal experiments depicted in Figure 6 were performed in accordance with the institutional animal care and use guidelines of the University of Pennsylvania.
Figure 7
Figure 7
Pre-fixation of RV-transduced T cells prevents the loss of RV-derived marker detection. Spleens containing empty-VEX+ RV-transduced wild-type P14 cells were harvested on day 36 after Arm infection. After staining with surface CD8, TCR Vα2, CD44, CD45.1 and CD45.2, spleen cells were treated with mock PBS or 2% (vol/vol) PFA in PBS at 4 °C for 20 min. Then half of the cells were fixed and permeabilized (Fix and Perm) using an eBioscience Foxp3 staining kit according to the manufacturer’s instructions. The remaining half of the samples were kept in PBS at 4 °C during the Fix and Perm steps. All samples were analyzed immediately after Fix and Perm procedures. Representative flow plots gated on P14 cells are shown. Numbers in the plots indicate percentage of VEX+ cells among total P14 cells. Data are representative of three independent experiments (1–2 technical replicate(s) per condition in each experiment). All animal experiments depicted in Figure 7 were performed in accordance with the institutional animal care and use guidelines of the University of Pennsylvania.

References

    1. Kaech SM, Cui W. Transcriptional control of effector and memory CD8+ T cell differentiation. Nat Rev Immunol. 2012;12:749–761. - PMC - PubMed
    1. Masopust D, Schenkel JM. The integration of T cell migration, differentiation and function. Nat Rev Immunol. 2013;13:309–320. - PubMed
    1. Wherry EJ, Kurachi M. Molecular and cellular insights into T cell exhaustion. Nat Rev Immunol. 2015;15:486–499. - PMC - PubMed
    1. Cepko C, Pear W. Overview of the retrovirus transduction system. Curr Protoc Mol Biol. 2001 Chapter 9, Unit 9 9. - PubMed
    1. Lee J, Sadelain M, Brentjens R. In: Genetic Modification of Hematopoietic Stem Cells: Methods and Protocols. Baum C, editor. Humana Press; 2009. pp. 83–96.