. 2017 Aug 30;95(5):1147-1159.e4.
doi: 10.1016/j.neuron.2017.08.014.

Synaptic Mechanisms of Feature Coding in the Visual Cortex of Awake Mice

Affiliations

Synaptic Mechanisms of Feature Coding in the Visual Cortex of Awake Mice

Hillel Adesnik. Neuron. .

Abstract

The synaptic mechanisms of feature coding in the visual cortex are poorly understood, particularly in awake animals. The ratio between excitation (E) and inhibition (I) might be constant across stimulus space, controlling only the gain and timing of neuronal responses, or it might change, directly contributing to feature coding. Whole-cell recordings in L2/3 of awake mice revealed that the E/I ratio systematically declines with increasing stimulus contrast or size. Suppressing somatostatin (SOM) neurons enhanced the E and I underlying size tuning, explaining SOM neurons' role in surround suppression. These data imply that contrast and size tuning result from a combination of a changing E/I ratio and the tuning of total synaptic input. Furthermore, they provide experimental support in awake animals for the "Stabilized Supralinear Network," a model that explains diverse cortical phenomena, and suggest that a decreasing E/I ratio with increasing cortical drive could contribute to many different cortical computations.

Keywords: E/I balance; Primary visual cortex; V1; contextual modulation; contrast sensitivity; in vivo whole cell; neural coding; normalization; optogenetics; size tuning.


Figures

Figure 1
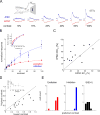
Figure 1. The membrane potential and spiking of L2/3 visual cortical neurons monotonically increase with higher contrasts
A) Top: schematic of the recording configuration in awake, head-fixed mice free to run on a circular treadmill. Middle: representations of the six visual stimuli of fixed size and orientation, but varying contrast. Bottom: Example traces of the membrane potential and spiking activity of one neuron to the six contrast levels. B) Plot of the mean spike rate versus contrast (n = 11 cells). Gray traces are tuning curves from individual cells. C) As in B) but for mean membrane potential during the stimulus. D) Left: Histogram of the preferred contrast for the spiking activity of the 11 recorded cells. Right: As at left, but for the mean depolarization of the membrane potential. Error bars are s.e.m.
Figure 2
Figure 2. Examples of synaptic responses with increasing stimulus contrast
A) Top: recording schematic. Bottom: Four sets of example traces from four different cells showing synaptic excitation (red) or inhibition (blue) for six levels of increasing contrast. The black line indicates the visual stimulus period and the analysis period. The light blue line indicates the zero point. B) Plots of the mean E and I across contrast for the cells whose average traces are shown in A). Left: E and I normalized to their own peak values. Right: E and I normalized to the peak of E. The analysis period is the first second after the onset of the visual stimulus. C) Plots of the E/I ratio versus stimulus contrast for the four example cells. Error bars are s.e.m.
Figure 3
Figure 3. Excitation and inhibition monotonically increase with stimulus contrast, while the E/I ratio decreases
A) Top: experimental schematic. Bottom: Grand average normalized traces of synaptic excitation (red) or inhibition (blue) computed across all recorded cells (n = 12) for six levels of contrast. B) Plot of average excitation (red) and inhibition (blue), across the 15 recorded cells, normalized to the max of excitation in each cell. Inset: E and I normalized to their own peak values. C) Scatter plot of the estimated EC50 of synaptic excitation and inhibition across 13/15 of the recorded cells with good fits (p < 0.05, Wilcoxon sign rank test). D) Plot of the E/I ratio for all 15 cells. Inset: Normalized E/I ratio as a function of contrast. E) Histogram of the preferred contrast for synaptic excitation (left), inhibition (middle), and the E/I ratio (right). Error bars are s.e.m.
Figure 4
Figure 4. The membrane potential and spiking of L2/3 visual cortical neurons are tuned to smaller sizes
A) Top: experimental schematic. Middle: representations of the six drifting visual stimuli of fixed contrast and orientation, but varying size. Bottom: Example traces of the membrane potential and spiking activity of one neuron to the six stimulus sizes. B) Plot of the mean spike rate vs. size (n = 5 cells). Gray traces are tuning curves from individual cells. C) As in B) but for the mean membrane potential during the stimulus. Error bars are s.e.m.
Figure 5
Figure 5. Examples of synaptic responses with increasing stimulus size
A) Top: recording schematic. Bottom: Four sets of example traces from four different cells showing synaptic excitation (red) or inhibition (blue) for six stimulus sizes. The black bar indicates the visual stimulus, and the grey bar indicates the period of analysis. B) Plots of the mean E and I across sizes for the cells whose average traces are shown in A). Left: E and I normalized to their own peak values. Right: E and I normalized to the peak of E. C) Plots of the E/I ratio versus stimulus size for each example cell. Error bars are s.e.m.
Figure 6
Figure 6. The E/I ratio declines with increasing stimulus size
A) Top: experimental schematic. Bottom: Grand average normalized traces of synaptic excitation (red) or inhibition (blue) computed across all recorded cells (n = 20) for six stimulus sizes. B) Plot of average excitation (red) and inhibition (blue), across the 20 recorded cells, normalized to maximal excitation in each cell. Inset: E and I normalized to their peak values. C) Plot of the E/I ratio across the same 20 cells. Inset: E/I ratio as a function of size for all cells exhibiting their maximum ratio at the smallest size (n = 9 cells). D) Histogram of the preferred size for synaptic excitation (left), inhibition (middle), and corresponding E/I ratio (right).
Figure 7
Figure 7. The somatic voltage clamp adequately separates excitation from inhibition in L2/3 pyramidal neurons
A) Experiment schematic. A L2/3 pyramidal neuron is patched with a somatic voltage clamp electrode, while excitatory or inhibitory synapses at defined distances from the soma are photo-stimulated with the sCRACM approach using a rectangular light bar projected via a digital-micromirror device. B) Measurement of the spatial resolution of the photo-stimulation system: plot of the light-induced charge in ChR2-expressing CHO cells (n = 7) when projecting the optical stimulus at defined distances from the cell. C) Example families of light-induced synaptic currents for GABA, NMDA, and AMPA currents. Each family represents traces taken at a series of command voltages at different distances from the soma. D) Plot of the estimated change in rise time of the IPSC as a function of distance from the soma (n = 6, p < 0.05, Kruskal-Wallis). E–F) Plot of the difference of the measured reversal potential for the specified current as compared to the measured value when the light stimulus was on the soma and proximal dendrites (GABA: n = 6; NMDA: n = 6; AMPA: n = 7; p < 0.05 for each, Kruskal-Wallis). H) The plots from E–G are re-plotted on one axis relative to the estimated effective driving force when measuring excitation and inhibition by clamping at either −70 mV or 0 mV, respectively.
Figure 8
Figure 8
Optogenetic suppression of SOM interneurons enhances synaptic excitation and inhibition. A) Top: recording schematic. Bottom: grand average traces of excitation and inhibition in control conditions (black) and during photo-suppression of SOM cells (orange) for six stimulus sizes. B) Plot of the average excitation across the six sizes under control conditions (black) and during SOM cell suppression (orange), n = 7 cells. C) as in B) but for synaptic inhibition (p < 0.05). D) E/I ratio under control (black) and light (orange) conditions, (p = 0.5, n = 7). Error bars are s.e.m.

References

    1. Adesnik H, Bruns W, Taniguchi H, Huang ZJ, Scanziani M. A neural circuit for spatial summation in visual cortex. Nature. 2012;490:226–231. - PMC - PubMed
    1. Anderson JS, Carandini M, Ferster D. Orientation tuning of input conductance, excitation, and inhibition in cat primary visual cortex. Journal of neurophysiology. 2000;84:909–926. - PubMed
    1. Anderson JS, Lampl I, Gillespie DC, Ferster D. Membrane potential and conductance changes underlying length tuning of cells in cat primary visual cortex. Journal of Neuroscience. 2001;21:2104–2112. - PMC - PubMed
    1. Angelucci A, Shushruth S. Beyond the Classical Receptive Field: Surround Modulation in Primary Visual Cortex. New Visual Neurosciences. 2014:425–444.
    1. Ayaz A, Saleem AB, Scholvinck ML, Carandini M. Locomotion Controls Spatial Integration in Mouse Visual Cortex. Curr Biol. 2013;23:890–894. - PMC - PubMed